
This past Wednesday whilst many a StateSider were preoccupied toward getting from home base to grandma's place, or worse, under the stress and duress of hosting Thanksgiving in full finesse, one might have missed Gold instantly regress ... then impress!
In fact, where else are ya gonna see a chart of Gold by the second, eh? Right here, from Wednesday and through the heart of the incoming economic metrics flow at precisely 14:30:00 CET (8:30am Eastern); note therein the two volume spikes as 1,000 contracts got dumped (to the detriment of the so-called "weak Longs"), price a mere second later then getting pumped. That's resilience, baby!
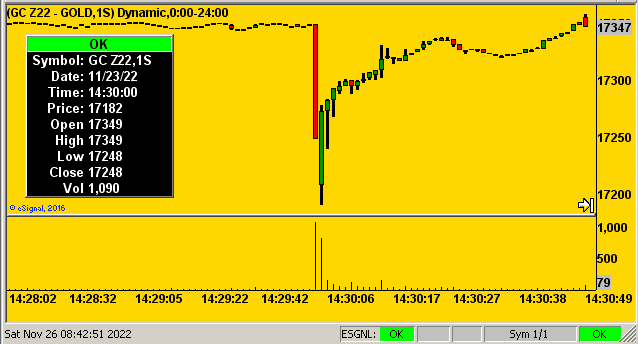
"Or a computer-driven dump and pump as nobody can think that fast, mmb..."
Realistically put, Squire. 'Course for those paying attention to the website's commentary, one already well knew that Wednesday was the sole day for a plethora of metrics into the Economic Barometer, almost as if an entire trading week (abbreviated as 'twas) was rolled into one day.
And specific to Gold, (which entered the brief trading week from 1752), price just hours before Wednesday's data mover was 1746. Then the metrics began to hit, and as quick as a wit, Gold dropped like a stone as shown to 1719. (We even saw an email cross the transom calling for a Gold return to 1600 ... perhaps they ought have waited one second).
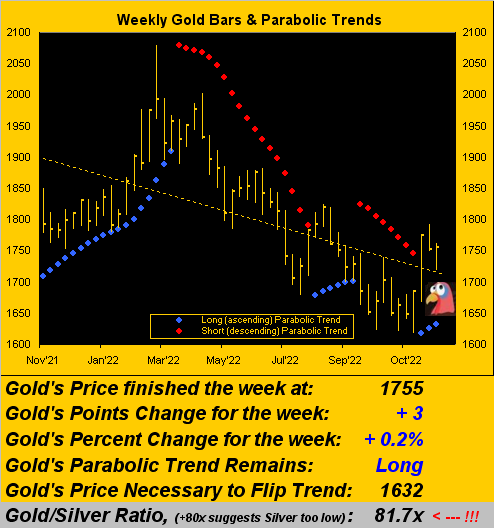
But again, what a difference supported by resilience did the balance of the trading day make, Gold's price swiftly sprinting to a high at 1755, indeed reaching 1761 yesterday (Friday) toward settling the week back at Wednesday's 1755 high. True, that's but a wee net gain of just three points for the week...
But here's the cool bit: the economic data was fairly positive -- an oft-thought Gold negative -- especially as interest rates are expected to continue rising, (regardless of whether the pace is "maintained" or "slowed": up is still up). And amongst Wednesday's improved metrics were October's Durable Orders posting their second best month-over-month gain in the last nine, plus New Home Sales their second best monthly improvement in the last five. Why, even a revised
Specific to the Econ Baro itself -- which from mid-summer until some three weeks ago had put in a comparatively substantive rise following the recession of Q1 and Q2 -- this past week's data at least steadied the recent sag. As you seasoned readers know, the Econ Baro since its inception in 1998 has been a guiding light ahead of the Bureau of Economic Analysis' Gross Domestic Product reports, the Conference Board's lagging indicator of Leading Indicators, and of course the track of the S&P 500. Still, the current read has turned somewhat unclear: 'twas getting better and better, then "Whoops..." and now "Hmmm..." From a year ago-to-date, here 'tis:
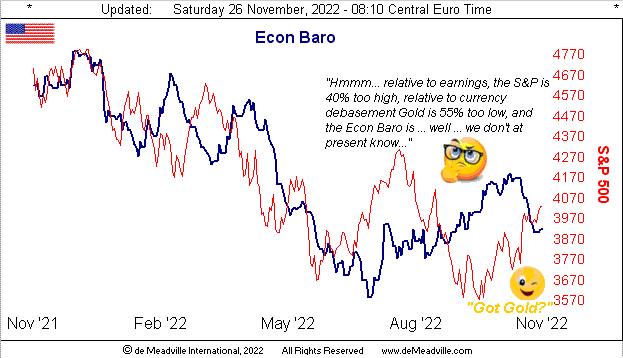
"Got Gold?" indeed. And yet participation hasn't picked up. Through these first 18 trading days in November, Gold's "front month" contract volume is in decline for the third successive year, and significantly so in measuring back to the first 18 days for November 2019: then 'twas 6,737,908 cacs traded; now 'tis 3,821,637 cacs traded; the difference is -43%. It thus remains that nobody cares. (We remain that one day they will, but well north of today's bargain basement price). Reprise: "Got Gold?"
Meanwhile from Rateville, the minutes from the Federal Open Market Committee's 01/02 November meeting are indicative of slowing the rate hike pace. Yet up the road in
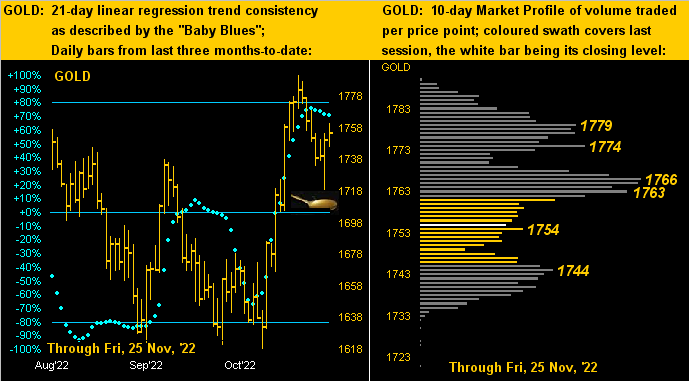
Speaking of which, we next go to our two-panel graphic of Gold's daily bars from three months ago-to-date on the left and the 10-day Market Profile on the right. By the blue dots of regression trend consistency, we'd like to see those get above the +80% axis in support of further upside price push; but standing in the way by the Profile are the denoted overhead resistors:
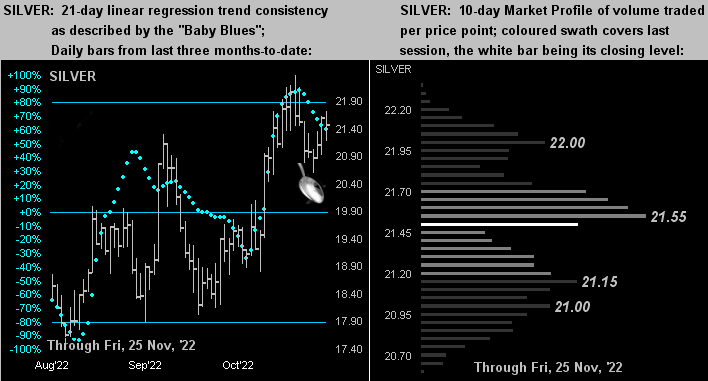
Here is the like graphic depiction for Silver. She thus far has defied her daily parabolic trend having flipped to Short effective 18 November's open, her "Baby Blues" (at left) falling too. In settling the week at 21.48, she's just below 21.55, the most dominantly-traded price (at right) across the past two weeks:
Thus we've conflicting indicators here, there and everywhere, from major markets' mis-valuations, the Econ Baro, and even to the precious metals. Still, The Gold Stack puts price in perspective:
The Gold Stack
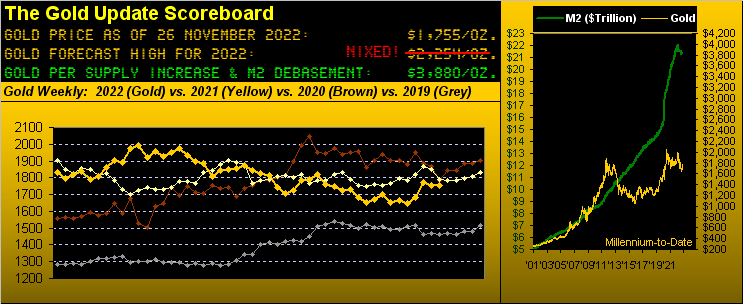
Gold's Value per Dollar Debasement, (from our opening "Scoreboard"): 3880
Gold’s All-Time Intra-Day High: 2089 (07 August 2020)
2022's High: 2079 (08 March)
Gold’s All-Time Closing High: 2075 (06 August 2020)
The Gateway to 2000: 1900+
The 300-Day Moving Average: 1803 and falling
The Final Frontier: 1800-1900
The Northern Front: 1800-1750
Trading Resistance: 1763 / 1766 / 1774 / 1779
10-Session “volume-weighted” average price magnet: 1762
Gold Currently: 1755, (expected daily trading range ["EDTR"]: 29 points)
On Maneuvers: 1750-1579
Trading Support: Notably 1744
10-Session directional range: down to 1719 (from 1792) = -73 points or -4.1%
The Weekly Parabolic Price to flip Short: 1632
2022's Low: 1618 (03 November)
The Floor: 1579-1466
Le Sous-sol: Sub-1466
The Support Shelf: 1454-1434
Base Camp: 1377
The 1360s Double-Top: 1369 in Apr '18 preceded by 1362 in Sep '17
Neverland: The Whiny 1290s
The Box: 1280-1240
We'll wrap it for this week with some fun from the faux FinMedia follies:
→ By "conventional wisdom", everybody knows this year's stock market got too low, and everybody knows it always comes all the way back, and everybody knows Q3 Earnings Season was pretty great with COVID no longer a weight (unless you're in
→ 'Course, we know that the "live" price/earnings ratio of the S&P 500 is now 37.5x vs. its lifetime mean of 22.4x, and we know it took 13 years for the S&P to rise just +2% from 2000's peak until 2013, and we know that 2022's Q3 Earnings were the fifth weakest for quarterly improvement in the past six years.
→ But the good folks over at Bloomy couldn't resist and went for it this past Tuesday with "Retailers Rally Into Holiday Season After Earnings Blowouts; Best Buy is the top performer on the S&P 500 after results." Yet knowing the true weakness underscoring earnings these days, we decided to actually do the math: BBY's bottom line was -34% lower than recorded a year ago, and the revenues were -11% lower. Not very resilient there. And that was the "top performer"? Bloomy: Get with the program! Everyone: Get some Gold!

Cheers!
...m...
About the author
