
AI is becoming ubiquitous. Fears are mounting. Will it eliminate my job? From the weaving loom to cars to the internet there was fear of the latest technology. Each time, however, jobs just changed and new ones were created. Now the question is whether the stock market is in a bubble because of AI? Michael Burry, he of the Big Short during the 2008 financial crisis has warned that the stock market is locked in a massive, artificial intelligence-driven speculative bubble that is on the verge of a systemic collapse. The MAG7 have led the way. Will the party continue?
Like the late 1990s dot-com bubble, the AI bubble has similar elements but is also different. We examine technology through the ages and its impact on work and the economy. What we find interesting is the demand for energy in order to build AI. That also results in demand for a host of critical minerals from gold and silver to rare earths. One of the biggest is copper. Yet the market doesn't appear to have fully focused on that need.
Kevin Warsh was sworn in as the new Fed Chairman. But Jerome Powell remains. To monitor him due to his perceived association with President Trump?
Sometimes overlooked given the rise in bond yields in the U.S. is that Japan is also seeing a huge rise in Japanese Government Bond (JGB) yields. It's the subject of our chart of the week.
This past week the Dow Jones Industrials (DJI) soared to new highs but hardly anyone joined the party with the DJI. Another divergence? We continue to see bearish signs in the stock market. Or is this time different? On the other hand, both gold and oil appear to be forming bullish triangle patterns. A beneficiary of increased oil and metals prices is Secure Waste Infrastructure Corp., recovering and recycling metal and oil waste, that reported increased discretionary free cash flow, and higher adjusted EBITDA, pays a dividend, and is held in the Enriched Capital Conservative Growth Strategy.*
We had a taste of a nice spring weather, then it got cold again. A sign? Monday is the Memorial Day holiday in the U.S. The U.S. markets are closed. The summer driving season begins. Have a great week!
DC
* Reference to the Enriched Capital Conservative Growth Strategy and its investments, celebrating an
8.25 - year history of 191% growth (annual 13.85%), is added by Margaret Samuel, President, CEO and Portfolio Manager of Enriched Investing Incorporated, who can be reached at 416-203-3028 or msamuel@enrichedinvesting.com This information should not be construed as an offer, or a solicitation of an offer or sale of any security. Past performance does not guarantee future returns.
“What's important in Libya is, first of all, it has a good deal of oil. A lot of the country is unexplored; there may be a lot more. And it's very high-quality oil, so very valuable.”
—Noam Chomsky, American intellectual, linguist, political activist, social critic, professor at University of Arizona, Massachusetts Institute of Technology (MIT), authored over 150 books, including his most famous one, Manufacturing Consent: Political Economy of the Mass Media (1988); b. 1928
“One pound of uranium is worth about 3 million pounds worth of coal or oil.”
—James Lovelock, English independent scientist, environmentalist, futurist, created the Gaia hypothesis that postulates the earth functions as a self-regulating system, worked for MI5, model for “Q” in the James Bond films; 1919–2022
“Chile is not a rich country in terms of gas, or oil or coal, but we are extremely rich in terms of the energies of the future.”
—Sebastien Pinera, Chilean businessman, politician served as 34th and 36th president of Chile 2010–2014, 2018–2022; 1949–2024
AI has become ubiquitous. And everyone is worried about it, even as many also embrace it. Technological change always brings anxiety. The same things that were concerns about the rise of the internet are being said today: jobs will be obsolete; machines will replace people; people don’t know how to train for it. University students don’t know what to take and fear they’ll never get a job beyond slinging hamburgers somewhere.
Farm mechanization eliminated thousands of jobs. The automobile destroyed buggy makers. Textile machines destroyed hand weavers and artisans, four-lane highways destroyed towns and closed motels (remember the Bates Motel – okay, we know, not real). Computers destroyed clerical and bookkeeping jobs. The iPhone destroyed cameras. But in their place sprung up new industries as manufacturing expanded and jobs in healthcare, technology, and other areas soared. The fear about AI is the same. Initially, it will result in considerable dislocation, but if history repeats itself, new jobs and industries will pop up in place of the old ones. The face of education will change to adapt to it. Initially though, jobs will be lost, older workers will be unable to adapt or be retrained, and many will not know how to deal with it, but new services and jobs will spring up and productivity will jump.
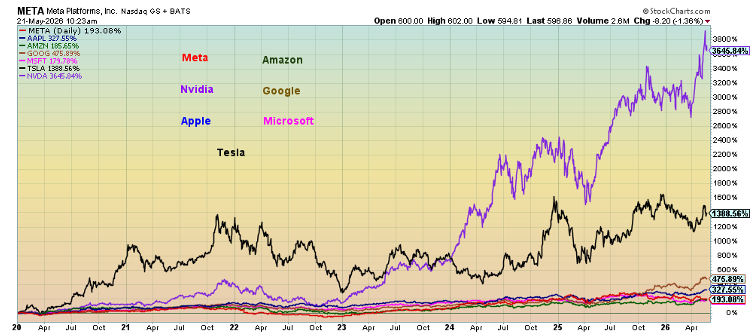
The MAG7 have soared as AI expanded. Nvidia was the driver. Software and cloud platforms exploded. Google has Gemini, Microsoft has Open AI, Amazon has numerous web services, and Meta has its Llama models. Apple has imbedded AI into its systems and Tesla has led the way for AI being imbedded into all car manufacturers’ systems. AI is everywhere. The MAG7 and AI stocks make up some 37% of the S&P 500.
Is AI in a bubble? That is debatable. We know that AI firms are hugely profitable, unlike the dot.com era where many technology companies soared on no profits and flimsy revenues. AI firms have cash flow. AI is already embedded for commercial use. Dot.com firms had price-to-earnings (PEs) ratios over 100 and little or no earnings. Some AI firms have PEs in the mid-twenties but average around 70. AI is everywhere in finance from the Bloomberg machine, to FactSet and many market data feeds. It’s even used by The Scoop as a research assistant.
Source: www.stockcharts.com
Since 2020, AI/MAG7 stocks have soared. Nvidia is up 3,645%, by far the leader. Tesla follows, up 1,388%. The rest follow – Google up 476%, Apple up 327%, Amazon gaining 186%, Meta up 193%, and Microsoft up 180%. By comparison, the NASDAQ has gained 190%, the S&P 500 129%, and gold 197%.
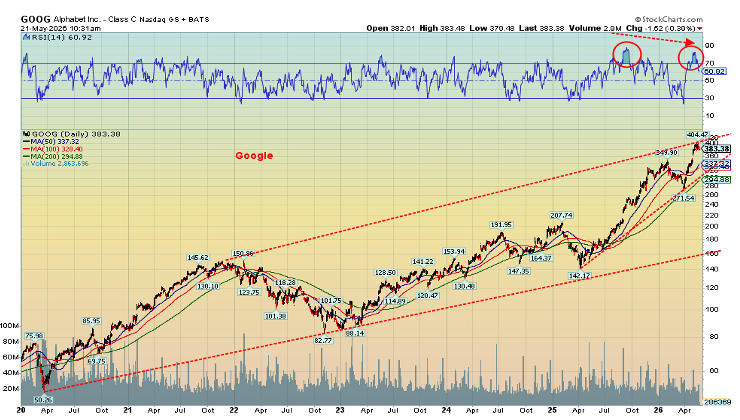
Google has been one of the recent big winners, up some 170% since that low in early 2025. Google is up 22% in 2026, the best MAG7 performer this year. But will it last? Google appears to be forming what looks to us as an ascending wedge triangle as it moves higher. An ascending wedge triangle is bearish, characterized by two upward-sloping, converging trendlines. It suggests to us that momentum is slowing and buyers are struggling to push the price higher. The breakdown point is currently around $305 and, if correct, suggests a move back to that 2025 low near $142. Grant you, a pullback now and yet another ascent higher would not be surprising. We note the overbought RSI indicator and the MACD indicator have recently given a sell signal.
One of the least understood features of AI is its massive energy needs going forward. AI requires a lot of power. That in turn could put upward pressure on electricity prices and strain on the electrical grid, requiring major new infrastructure. All that costs money – lots of it, in the billions. It is estimated that AI centres could consume upwards of 17% of U.S. electricity capacity by 2030 vs. only 4% today.
All this means that there is increasing interest in energy projects – natural gas, nuclear, renewables, battery storage. AI impacts not only the power grid but also infrastructure and the commodities needed to power the plants. That also turns it into a geopolitical story when the commodities needed are not readily available but are instead held by foreign countries not necessarily friendly to the U.S. or the West – i.e., China, which is a dominant supplier of the critical minerals needed. No wonder China is a leader in AI and leads as well in the number of data centres.
Specialized minerals include copper, gold, silver, tin, tantalum, gallium, germanium, and rare earths. If the last few don’t ring a bell, it’s because they’re rare. The biggest need is copper for transmission lines, transformers, motors, cooling systems, wiring, and more. Other needs include aluminum, nickel, lithium, and graphite. Others are manganese, cobalt, and graphite. Copper in particular faces shortages because of its heavy use in electrification, EVs, and renewable energy. Evidence suggests China and Asia are snapping up silver supplies because of the needs of AI, EVs, and renewables.
Key countries are China (rare earths), Chile (copper), Peru (copper), Canada (nickel, uranium, critical minerals), Australia (lithium, iron ore), and the Democratic Republic of the Congo (cobalt). As a result, these minerals become national security issues as well as economic ones. Investors may wish to look at key stocks that mine and produce these minerals.
AI is pervasive. It pops up in media feeds. Is it real or AI? AI can be geared to misinform and mislead and or it’s outright fake, but you don’t know it. University professors admit they have trouble telling the difference between an AI-generated essay and one written by the student. AI is both good and bad. In my university days we went to the library. Today it is AI and Wikipedia. Are libraries a relic of the past?
AI is not going to go away. It will cause disruption, including potentially massive job losses. But if history is a guide, it creates new jobs and expanded use, including new products, particularly for health care. Tensions will remain over the source of the minerals needed for AI. That could include wars for control. It is a new and exciting period but potentially one wrought with conflict.
One last note: AI stocks have soared. They are the darlings. They dominate the indices. But a reminder that all periods of bubbles in the latest technology ended in grief. Railways during the 1840s and again during 1880s, the automobile and radio during the 1920s, aerospace and computers during the 1960s and the 1970s (the Nifty Fifty bubble), and the internet and dot.com boom of the 1990s. Is this time different? Speculation always outruns reality. Remember, even the Luddites – members of a 19th century movement of English textile workers who protested the use of certain automated machinery during the Industrial Revolution – eventually succumbed to reality.
Source: www.stockcharts.com
The MAG7
|
MAG7 |
All-Time High Date/Price $ |
Current Price Close 5/22/26 |
Change $/% |
|
Amazon (AMZN) |
5/5/26 - $278.56 |
$266.32 |
$12.24 - (4.4)% |
|
Apple (AAPL) |
5/22/26 - $311.40 |
$308.82 |
$2.58 – (1.0)% |
|
Google (GOOG) |
5/18/26 - $404.47 |
$379.38 |
$25.09 – (6.2)% |
|
Meta (META) |
8/15/25 - $794.38 |
$610.26 |
$184.12 – (23.2)% |
|
Microsoft (MSFT) |
10/28/25 - $550.24 |
$418.57 |
$131.67 – (24.0)% |
|
Nvidia (NVDA) |
5/14/26 -$236.54 |
$215.33 |
$21.21 – (9.0)% |
|
Tesla (TSLA) |
12/22/25 - $498.83 |
$426.01 |
$72.82 – (14.6)% |
Source: www.stockcharts.com
Our table of the MAG7 shows how they have performed since their all-time highs. Two, Meta and Microsoft, are in bear markets. Apple just made their all-time high, so the differential is inconsequential. Our question is, are Meta and Microsoft the canaries in the coal mine for how the MAG7, and by extension the stock market is going forward? AI is ubiquitous. But history suggests the party doesn’t last forever. Cisco (CSCO), the darling of the dot.com boom, topped in March 2000 then promptly collapsed 90% into 2002. Course it has now more than recovered but it took 25 years to finally take the 2000 high out. Fame has its consequences.
The Kevin Warsh era at the Fed begins
Kevin Warsh was sworn in as the new Fed chairman this past week, thus ending the Jerome Powell era. Not to be pushed aside, Powell is staying on as Fed governor until 2028 as he is allowed to. Does the split Fed become even more split?
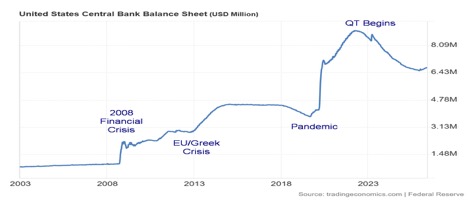
So, what does Warsh want to do? He wants to reduce the Fed balance sheet, currently at $6.7 trillion, down to around $3 trillion. He doesn’t believe in huge Fed interventions as was seen in the past during the Russian default/LTCM crisis 1998, the financial crisis of 2008, and the pandemic of 2020. He believes the rise of AI will unleash huge productivity gains, thus lowering inflation and allowing for interest rates to go lower as well. Also, he wants to Fed to concentrate on its core mandate of full employment and price stability and no longer on things like DEI (diversity, equity, and inclusion), climate change, and social issues.
The Fed came into existence in 1913 after the panic of 1907 that required a number of banks to bail out to prevent an economic meltdown. The bailout was headed by J.P. Morgan. The Fed is not owned by the government of the U.S., even as they receive the profits of the Fed. The Fed is owned by its member banks, but they have limited control as they own the stock but receive only an annual interest payment and they do not control its policy-making decisions. The Fed is a unique public/private government agency. Control and policy- making rest with the government-appointed Board of Governors. Its ultimate aim is to protect the banks, not to protect the American citizen. How Warsh maneuvers his way with Powell looking over his shoulder should prove interesting. How Warsh maneuvers with many believing he is puppet of President Trump will also prove interesting.
Federal Reserve Balance Sheet (US$ millions) 2003-2026
Source: www.tradingeconomics.com, www.federalreserve.gov
Chart of the week
Japan’s 10-year yield JGBs, inflation rate and BOJ interest rate 2016–2026

Source: www.tradingeconomics.com, www.soumo.go.gp, www.boj.or.gp
We’ve noted this before and now we emphasize it again: Japanese interest rates have been rising. In 2020 during the pandemic Japan’s 10-year Government Bond (JGBs) was trading at negative 0.31%. Yes, negative. For years Japan suppressed rates, buying government bonds to suppress yield. They held them at artificially low levels for years in an attempt to revive its moribund economy. There was low or negative inflation. Japan’s low rates encouraged what we call the Japanese carry trade whereby one borrows in yen at ultra-low rates and then sells it, usually in U.S. dollars, and buys U.S. treasury bills or notes/bonds at higher rates. This works as long as Japanese rates are held low.
It was a winning trade. It did, however, put downward pressure on the Japanese yen, pushing it down over 36% from 2020 to current levels. The yen is down 52% from its all-time high seen in 2011.
While the currency fell, it did help push Japan’s Nikkei Dow (TKN) to all-time highs from a low in 2009. But then Japan’s inflation began to rise, along with other G7 countries. Japan has now ended yield curve control as inflation soars above the BOJ’s targets. The BOJ also reduced bond purchases that helped keep yields artificially low. Japan has huge debt. Its debt to GDP ratio is the highest in the G7 at around 250%. Its debt is held mostly in Japan – pension funds, banks, insurance companies, and especially the BOJ, which has an estimated 46% of the debt. Unlike the U.S. and others, Japan is not beholden to foreign investors. Japan owes its money to itself, thus allowing the high debt to GDP ratio.
On the other hand, Japan because of its export economy is a major holder of foreign debt and stocks. Japan has the largest holdings of U.S. treasuries at over $1.2 trillion, 3% of the U.S. debt. But now rising rates are rippling through the Japanese economy, impacting borrowing costs and ultimately the Japanese stock market and bond market, and putting negative pressure on the yen carry trade that needs to be unwound (i.e., by selling foreign holdings, usually U.S. treasuries, and converting them to yen). With yields rising at home, the incentive to hold investments elsewhere falls. Besides U.S. treasuries, Japan also invested in foreign stock markets, corporate bonds, and cryptocurrencies.
If there is anything in this for Japan, it is that U.S. interest rates have remained high relative to Japan’s, thus making some aspects of the yen carry trade still profitable. The risk is that all this falls apart as bond yields rise, triggering a tsunami of selling even for the Japanese stock market to pay for losses in the bond market. Japan’s cheap money is no longer very cheap. What goes up eventually comes down.
Debt is the elephant in the room not just in the U.S. but also Japan and elsewhere.
Stocks
Source: www.stockcharts.com
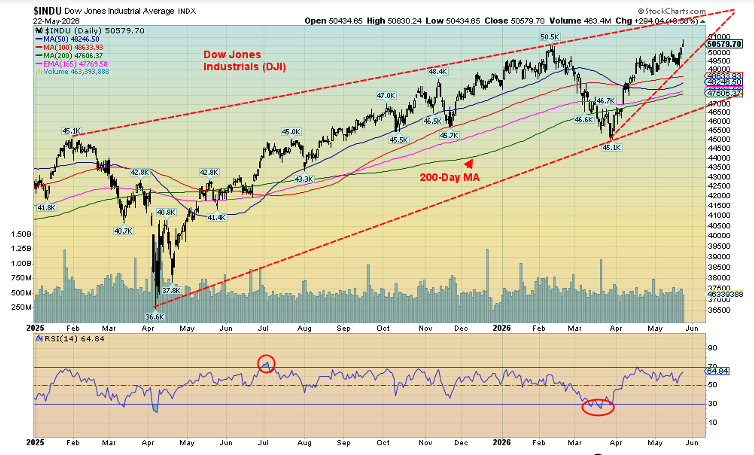
The party continues. In a surprise move this past week, the Dow Jones Industrials (DJI) soared to new all-time highs. The S&P 500 and NASDAQ that had previously led the way did not. No, not even the Russell 1000, 2000, and 3000 joined the party. A lonely walk? Of course, time will tell whether this is significant or if we will see the rest catch up. We can’t presuppose it until shown otherwise.
Nonetheless, this market is long in the tooth. Volumes have been putrid; the move has been largely straight up which is normally not sustainable. The DJI in particular, appears to be forming an ascending wedge triangle which is bearish. It breaks under 49,000 and projects at least down to 45,000. Sell in May and go away, may still come into play.
Markets were generally up this past week, thanks to lower oil prices and marginally lower bond yields. Was there a Warsh rally, given the confirmation of Kevin Warsh as the new Fed chair? He’s viewed as a bit of a dove after being a hawk. The markets keep on hoping that the U.S./Iran will reach a deal. But the president appears desperate for a deal to get him out his mess. He says a deal is close on one hand and the other hand threatens them with obliteration if they don’t sign a deal.
On the week, the S&P 500 rose 0.9%, the DJI was up 2.1%, the Dow Jones Transportations (DJT) was up 3.2%, and the NASDAQ was up 0.5%. The surprise was the slightly weaker S&P 500 and NASDAQ as the MAG7 and FAANGs faltered. While CrowdStrike jumped 11.7% and Advanced Micro (AMD) was up 10.2%, Google made an all-time high and then closed down 3.5%. Nvidia lost 4.4%. In sweet justice, Donald Trump’s Trump Media (DJT) fell to all-time lows, down 8.3%.
The S&P 400 (Mid) was up 1.8% and the S&P 600 (Small) gained 2.5%. The S&P 500 Equal Weight Index was one of the few joining the DJI to a new all-time high, up 2.5%. Another divergence? The NY FANG Index lost 0.1%. In Canada, the TSX gained 1.9% while the TSX Venture Exchange (CDNX) continued to falter, off 1.6%.
With the TSX up, we note that Income Trusts (TCM), Energy (TEN), Financials (TFS), and Utilities (TUT) all made all-time highs. So did the TSX 60. In the EU, the London FTSE rose 2.9%, the EuroNext was up 2.7%, the Paris CAC 40 was up 2.1%, and the German DAX gained 2.7%. In Asia, China Shanghai’s Index was down 0.5%, the Tokyo Nikkei Dow (TKN) was up 3.1%, and Hong Kong’s Hang Seng (HSI) was down 1.4%. India’s Nifty Fifty was up 0.3%. So, generally, indices were up on the week, thanks to lower oil prices.

Source: www.stockcharts.com
We show the DJI next to highlight that potential ascending wedge (bearish) triangle.
Source: www.stockcharts.com
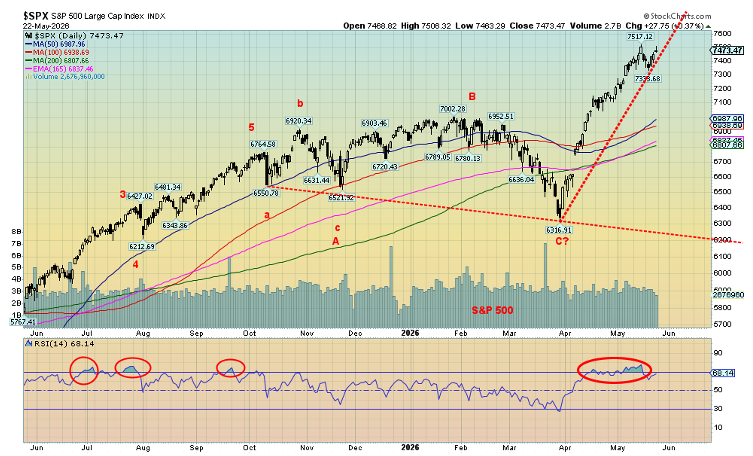
The S&P 500 appeared to have broken that steep uptrend but then turned around and rose again. That recent low at 7,330 now becomes a break point. Under 7,000 a top is confirmed. Given all the divergences, we continue to be cautious about the stock market and would refrain from buying up here. It’s May, after all.
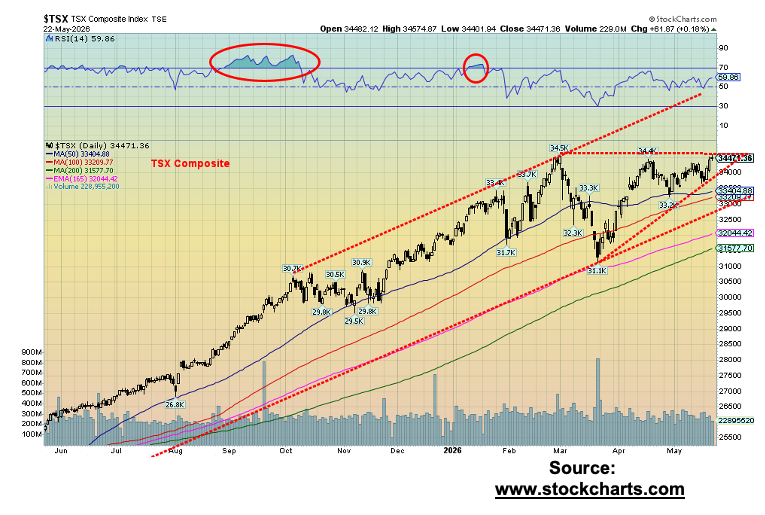
The TSX chart is on the next page, and it too appears to be exhibiting an ascending wedge triangle. It breaks under 33,850 and confirms a breakdown under 33,200. Support can be seen down to 33,000. If there are encouraging signs for the TSX, it’s that it also appears to be making a triple top, a rare event. But triple tops can soon be busted to the upside. New highs over 34,500 could suggest we will continue higher. To do that we’d need the participation of the materials group: golds, metals, and materials.
Source: www.stockcharts.com
U.S. Michigan Consumer Sentiment Index 1952-2026
Source: www.tradingeconomics.com, www.umich.edu
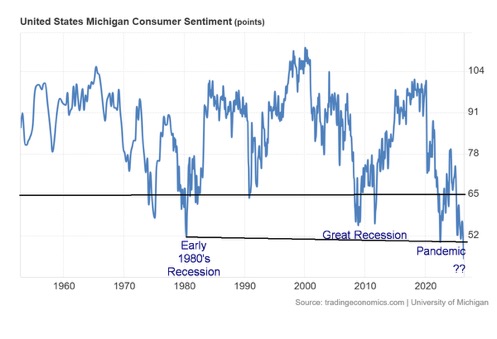
The K economy just got wider. While the stock market makes record highs, consumer confidence as measured by the Michigan Consumer Sentiment Index just hit an all-time low. Do we have a depression? No. Do we have a recession? No. Today, the Michigan Consumer Sentiment Index is lower than it was at the lows of the 1980–1982 recession, lower than the lows of the Great Recession of 2007–2009, and lower than it was at the time of the 2020 pandemic. But the stock market soars. The stock market is not the economy. As we have noted, the top 10% owns 87%–93% of the stock market while The bottom 90% holds the rest. The bottom 50% holds roughly 1%. Inequality in the U.S. has rarely been higher. That inequality is showing up in this index. Inflation and the cost of living top the concerns. Longer-term inflation expectations remain high, although so far not at highs seen during the 2022 inflation run-up.
Bonds

Source: www.tradingeconomics.com, www.home.treasury.gov, www.bankofcanada.ca
With oil prices falling this past week, it was no surprise to see that bond yields also ticked lower. The U.S. 10-year Treasury note dropped from 4.61% to 4.56% while the Canadian 10-year Government of Canada bond (CGB) dropped to 3.53% from 3.69%. As we noted, Kevin Warsh became the new Fed chairman and will conduct his first FOMC meeting on June 16–17. At this time the expectation is that they will leave rates unchanged. Pressure will be on to lower rates. With $40 trillion in Federal government debt and upwards of $10 trillion maturing in 2026, lower short rates would ease some of the cost pain.
The U.S. already pays over $1 trillion in interest payments, now the third-highest expenditure, behind Social Security and Medicare/Medicaid and ahead of defense spending. The Fed can lower bond yields by buying back government bonds and mortgage-backed securities, thus putting liquidity into the financial system. That in turn could fuel a further stock market rally. But Warsh wants to lower the Fed balance sheet and buying bonds doesn’t do the trick. Instead, they’d have to sell bonds, which takes funds out of the financial system. Notably, foreign holdings of U.S. treasuries are falling, not rising.
The latest data shows that foreign holdings of U.S. treasuries fell $139 billion in March 2026. Japan’s holdings fell $48 billion (unwinding of the yen carry trade?) while China’s holdings dropped $41 billion. Apparently, Turkey, who has serious economic problems, sold all of its U.S. treasuries. Foreigners selling holdings of U.S. treasuries is negative for U.S. bond yields. The U.S. 30-year bond is already over 5.00% and may rise further. The 10-year U.S. Treasury note doesn’t potentially break down until under 4.30% down from the current 4.56%. The odds favour higher, not lower, rates. Hence, that’s why it might be considered important to lower the Fed rate from the current 3.75% and issue more treasury bills rather than long-term debt. That in turn could create a buyer’s strike. Central banks have over the past number of years been selling U.S. treasury securities and buying gold.
Gold and silver
Source: www.stockcharts.com
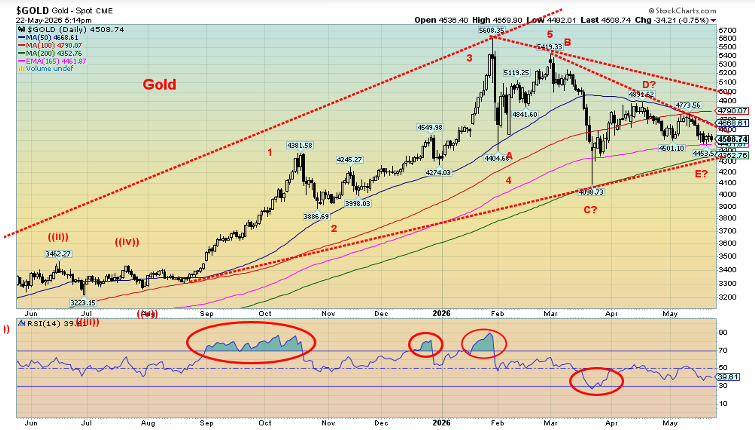
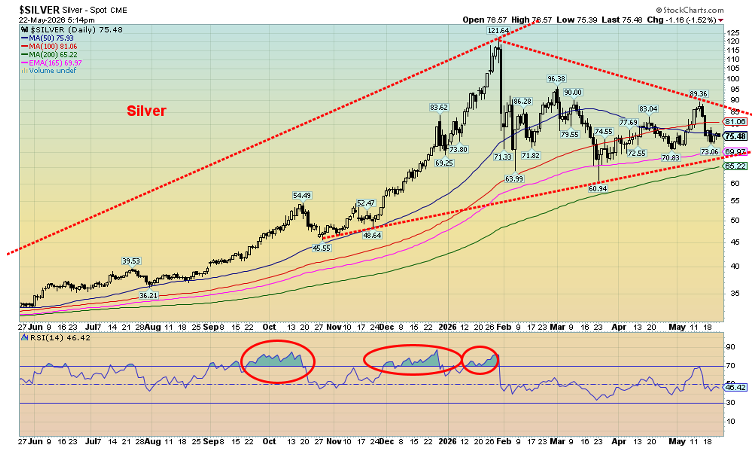
The correction (overdue) that got underway for the precious metals sector after the January 2026 top is not yet over. For the second week in a row, the precious metals sector fell as concern over rising oil prices (even if they fell this past week) weighs on concerns that the Fed will have to hike rates rather than cut them. That the former hawk Kevin Warsh (who is now more a dove) takes over as the new Fed chairman has not calmed the market. Some Fed governors are expressing a need for higher, not lower, rates to quell inflation. Not helping was a mildly stronger US$ Index as well. Concerns about inflation are outweighing concerns about the economy. And that was despite both oil prices and longer-dated bond yields falling this past week.
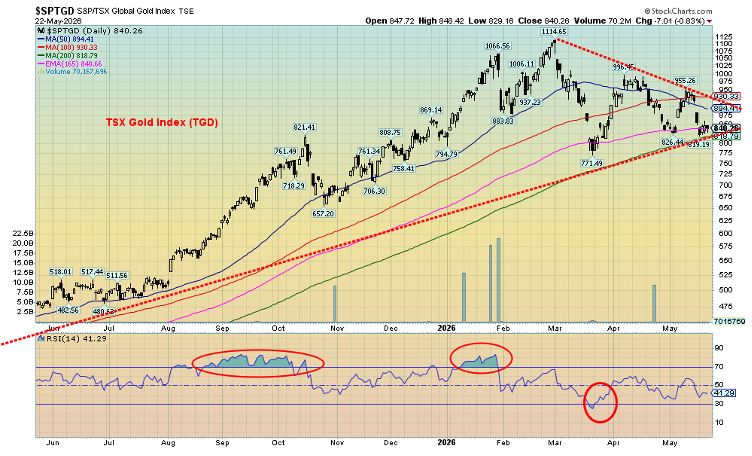
Gold fell 0.7% this past week, silver was down 0.6%, and platinum was off 2.4%. Of the near precious metals, palladium fell 4.8% but copper, with its growing needs and shortages, rose 1.9%. No surprise then that the Gold Bugs Index (HUI) dropped 2.6% while the TSX Gold Index (TGD) was off 1.8%. The gold/silver ratio fell slightly by 0.2%, reflecting silver’s continued outperformance to gold. We continue to view that as positive going forward.
In a surprise move, we note that the commercial short position on the Commitment of Traders (COT) report is falling. That is a potentially bullish development. If one wants a detailed analysis of what is going on with the COT and other gold/silver reports, the best source is Ed Steer, writing for SilverSeek (www.silverseek.com). Here’s a link to that article (https://silverseek.com/article/huge-drop-commercial-net-short-position-gold). It’s quite technical but thorough.
Source: www.stockcharts.com
One thing that keeps us bullish in the precious metals sector (gold, silver) is the appearance of large symmetrical triangles for gold, silver, and the gold stocks (as represented by the TSX Gold Index (TGD)). These patterns can signal a consolidation or even a top. The last major low was seen in 2022 and since then we count three completed up waves while the current wave appears to us as a fourth-wave correction. If that’s correct, then we should break to the upside. Gold breaks out over $4,700 with confirmation over $5,000, silver goes over $89 with confirmation over $95, and the TGD goes over 993 with confirmation over 997. Above $5,250, gold suggests new highs ahead, silver over $107.50, and the TGD over 1,040. Seasonals suggest a low in June but we could hang on until July. Beware a false breakdown, characterized by breaking the bottom of the triangle but with little follow-through. Those drops are meant to shake out weak longs. We note that the 200-day MA is just below for gold at $4,350 and silver at $65.00.
Source: www.stockcharts.com
Holders of gold stocks are not having a good time lately. We note especially those in the junior mining exploration stocks where the TSX Venture Exchange (CDNX) is down on the year. Many of these junior exploration plays remain deeply undervalued and as a result represent significant investment opportunities. The trouble is there are hundreds, even thousands of companies and landing on the right one can be more luck than skill. Still, they represent strong opportunities as many can double, triple, and even more in a hurry if things heat up.
We remain bullish on the precious metals sector but recognize that corrective phases can be frustrating. While we put low odds on a breakdown, gold falling under $4,000 and silver under $50 would be quite bearish.
Oil and gas
Source: www.stockcharts.com
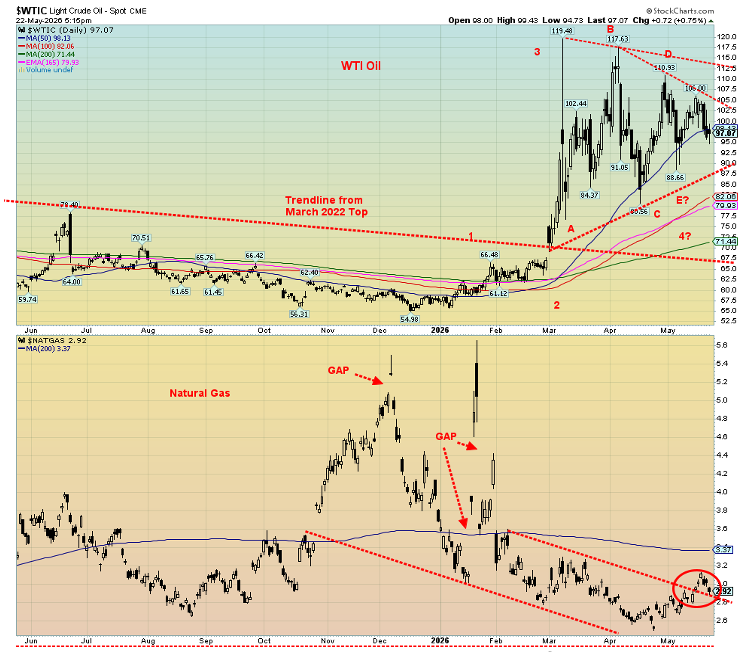
Whither oil prices? Oil prices continued to be battered by the whims of the president who bounces between saying peace is at hand with Iran and the Strait of Hormuz will open, or that we’ll bomb Iran into the Stone Age if they don’t sign. Which is it? This past week it was peace was at hand as WTI oil prices fell almost $10 or 9.1%. Brent crude fell 5.6%. As a result, the stock market soared to new highs (okay, at least the DJI) while rising bond yields faltered and gold sold off. The reality is the Strait of Hormuz is still not opened and even if they came to an agreement to get the strait open and end the blockades by both Iran and the U.S., it will take months or longer to get things moving again and repair the damage to oil facilities in the Gulf region. Meanwhile, there are some signs of a weakening economy and forecasts of oil needs are pulling back. Offsetting that is that, because of the closing of the Strait of Hormuz, governments have run down their strategic reserves. They will need replenishing.
Iran and the U.S. say they are negotiating, but they also appear to be talking over each other as neither side is accepting of the other side’s demands. Iran is preparing for the long haul. The U.S. under Trump desperately wants out but they can’t find a way without admitting defeat. Inflation has soared. The U.S. consumer is becoming antsy. Tensions because of rising gas prices are also rising. Clashes are breaking out, and even rationing.
From our perspective as technical analysts, we look at how oil prices appear to be forming a large symmetrical triangle with a potential five-point reversal pattern labelled ABCDE. If that’s correct, this consolidation pattern should break out to the upside (not the answer most people want to hear). The breakout point is around $105/$106 and could project up to $144/$145 with initial resistance at $112.50. Over $107.50, WTI oil signals potential new highs above $119.48.
Even if we were to break down (lower odds), then there is a probable floor near $80 or, as a best case, down to around $70. Natural gas (NG) also appears to have broken a downtrend line; however, upside follow-through has been weak, suggesting this is not a major breakout. NG at the Henry Hub fell 2.0% this past week while EU NG at the Dutch Hub was down 4.5%. Energy stocks were hit with some profit-taking as the ARCA Oil & Gas Index (XOI) was off 1.0% and the TSX Energy Index (TEN), despite making slight new all-time highs, closed down 0.3%.
We continue to see little to suggest that the oil crisis is over, even if it ended tomorrow. The worst, we believe, is yet to come, particularly as we go into the July/August period. High oil prices and by extension high gas prices are here to stay for the foreseeable future. And the odds favour it getting worse, not better.
Markets and trends follow
Markets and Trends
|
|
|
|
% Gains (Losses) Trends |
|
||||
|
|
Close Dec 31/25 |
Close May 22/26 |
Week |
YTD |
Daily (Short Term) |
Weekly (Intermediate) |
Monthly (Long Term) |
|
|
|
|
|
|
|
|
|
||
|
S&P 500 |
6,845.50 |
7,473.57 |
0.9% |
9.2% |
up |
Up |
up |
|
|
Dow Jones Industrials |
48,063.29 |
50,579.70 (new highs) * |
2.1% |
5.2% |
up |
up |
up |
|
|
Dow Jones Transport |
17,357.19 |
20,767.41 |
3.2% |
19.7% |
neutral |
up |
up |
|
|
NASDAQ |
23,241.99 |
26,343.97 |
0.5% |
13.4% |
up |
up |
up |
|
|
S&P/TSX Composite |
31,712.76 |
34,471.36 |
1.9% |
8.7% |
up |
up |
up |
|
|
S&P/TSX Venture (CDNX) |
987.74 |
973.47 |
(1.6)% |
(1.4)% |
down |
up |
up |
|
|
S&P 600 (small) |
1,467.76 |
1,670.72 |
2.5% |
13.8% |
up |
up |
up |
|
|
ACWX MSCI World x US |
67.18 |
75.12 |
1.9% |
11.8% |
up |
up |
up |
|
|
Bitcoin |
87,576.98 |
75,877.90 |
(4.1)% |
(13.4)% |
up |
down |
neutral |
|
|
|
|
|
|
|
|
|
|
|
|
Gold Mining Stock Indices |
|
|
|
|
|
|
|
|
|
Gold Bugs Index (HUI) |
701.49 |
727.34 |
(2.6)% |
3.7% |
down |
neutral |
up |
|
|
TSX Gold Index (TGD) |
817.76 |
840.13 |
(1.8)% |
2.7% |
down |
neutral |
up |
|
|
|
|
|
|
|
|
|
|
|
|
Bonds% |
|
|
|
|
|
|
|
|
|
U.S. 10-Year Treasury Bond yield |
4.17% |
4.56% |
(1.1)% |
9.4% |
|
|
|
|
|
3.3Cdn. 10-Year Bond CGB yield |
3.44% |
3.53% |
(4.3)% |
2.6% |
|
|
|
|
|
Recession Watch Spreads |
|
|
|
|
|
|
|
|
|
U.S. 2-year 10-year Treasury spread |
0.69% |
0.43% |
(17.3)% |
(37.7)% |
|
|
|
|
|
Cdn 2-year 10-year CGB spread |
0.85% |
0.61% |
(3.2)% |
(28.2)% |
|
|
|
|
|
|
|
|
|
|
|
|
|
|
|
Currencies |
|
|
|
|
|
|
|
|
|
US$ Index |
98.26 |
99.30 |
flat |
1.1% |
up |
down |
down |
|
|
Canadian $ |
72.87 |
72.40 |
(0.4)% |
(0.6)% |
down |
up |
neutral |
|
|
Euro |
117.48 |
116.05 |
(0.2)% |
(1.2)% |
down |
up |
up |
|
|
Swiss Franc |
126.21 |
127.41 |
0.2% |
1.0% |
neutral |
up |
up |
|
|
British Pound |
134.78 |
134.42 |
1.0% |
(0.3)% |
neutral |
up |
up |
|
|
Japanese Yen |
63.83 |
62.83 |
(0.2)% |
(1.6)% |
down (weak) |
down |
down |
|
|
|
|
|
|
|
|
|
|
|
|
Precious Metals |
|
|
|
|
|
|
|
|
|
Gold |
4,311.97 |
4,507.04 |
(0.7)% |
4.5% |
down |
neutral |
up |
|
|
Silver |
71.16 |
75.46 |
(0.6)% |
6.0% |
neutral |
up (weak) |
up |
|
|
Platinum |
124.81 |
1,931.00 |
(2.4)% |
(5.7)% |
down |
neutral |
up |
|
|
|
|
|
|
|
|
|
|
|
|
Base Metals |
|
|
|
|
|
|
|
|
|
Palladium |
1,619.50 |
1,358.50 |
(4.8)% |
(16.1)% |
down |
down |
up |
|
|
Copper |
5.64 |
6.35 |
1.9% |
12.6% |
up |
up |
up |
|
|
|
|
|
|
|
|
|
|
|
|
Energy |
|
|
|
|
|
|
|
|
|
WTI Oil |
57.44 |
96.33 |
(9.1)% |
67.7% |
down (weak) |
up |
up |
|
|
Nat Gas |
3.71 |
2.91 |
(2.0)% |
(21.6)% |
up |
down (weak) |
neutral |
|
Source: www.stockcharts.com
* New All-Time Highs
Note: For an explanation of the trends, see the glossary at the end of this article.
New highs/lows refer to new 52-week highs/lows and, in some cases, all-time highs.
Copyright David Chapman 2026
GLOSSARY
Trends
Daily – Short-term trend (For swing traders)
Weekly – Intermediate-term trend (For long-term trend followers)
Monthly – Long-term secular trend (For long-term trend followers)
Up – The trend is up.
Down – The trend is down
Neutral – Indicators are mostly neutral. A trend change might be in the offing.
Weak – The trend is still up or down but it is weakening. It is also a sign that the trend might change.
Topping – Indicators are suggesting that while the trend remains up there are considerable signs that suggest that the market is topping.
Bottoming – Indicators are suggesting that while the trend is down there are considerable signs that suggest that the market is bottoming.
Disclaimer
David Chapman is not a registered advisory service and is not an exempt market dealer (EMD) nor a licensed financial advisor. He does not and cannot give individualised market advice. David Chapman has worked in the financial industry for over 40 years including large financial corporations, banks, and investment dealers. The information in this newsletter is intended only for informational and educational purposes. It should not be construed as an offer, a solicitation of an offer or sale of any security. Every effort is made to provide accurate and complete information. However, we cannot guarantee that there will be no errors. We make no claims, promises or guarantees about the accuracy, completeness, or adequacy of the contents of this commentary and expressly disclaim liability for errors and omissions in the contents of this commentary. David Chapman will always use his best efforts to ensure the accuracy and timeliness of all information. The reader assumes all risk when trading in securities and David Chapman advises consulting a licensed professional financial advisor or portfolio manager such as Enriched Investing Incorporated before proceeding with any trade or idea presented in this newsletter. David Chapman may own shares in companies mentioned in this newsletter. Before making an investment, prospective investors should review each security’s offering documents which summarize the objectives, fees, expenses and associated risks. Although Artificial Intelligence (AI) may be deployed from time to time, AI output is monitored and adjusted, if necessary, for accuracy. David Chapman shares his ideas and opinions for informational and educational purposes only and expects the reader to perform due diligence before considering a position in any security. That includes consulting with your own licensed professional financial advisor such as Enriched Investing Incorporated. Performance is not guaranteed, values change frequently, and past performance may not be repeated.
About the author


Website: https://www.enrichedinvesting.com
Disclaimer: David Chapman is not a registered advisory service and is not an exempt market dealer (EMD) nor a licensed financial advisor. We do not and cannot give individualised market advice. David Chapman has worked in the financial industry for over 40 years including large financial corporations, banks, and investment dealers. The information in this newsletter is intended only for informational and educational purposes. It should not be considered a solicitation of an offer or sale of any security. The reader assumes all risk when trading in securities and David Chapman advises consulting a licensed professional financial advisor before proceeding with any trade or idea presented in this newsletter. David Chapman may own shares in companies mentioned in this newsletter. We share our ideas and opinions for informational and educational purposes only and expect the reader to perform due diligence before considering a position in any security. That includes consulting with your own licensed professional financial advisor.