
“If you want a love message to be heard, it has got to be sent out. To keep a lamp burning, we have to keep putting oil in it.”
—Mother Teresa, also known as Saint Mother Teresa of Calcutta, Catholic nun, founder of Missionaries of Charity and Catholic Saint, canonized by the Catholic Church; 1910–1997
“We have developed a case of oil addiction in Saudi Arabia.”
—Mohammed bin Salman, known as MBS, de facto ruler of the Kingdom of Saudi Arabia, crown prince and prime minister, heir apparent to the Saudi throne, grandson of nation’s founder Ibn Saud; b. 1985
“Working across the aisle, I helped pass laws exposing business dealings in Iran, cracking down on Iranian human rights abusers, and applying crippling sanctions to Iran's oil and gas industries.”
- Ted Deutch, American lawyer, politician, representative for Florida’s 22nd congressional district (2010–2022), member of Democratic Party, CEO American Jewish Committee 2022–present; b. 1966
Just when you thought it was safe to go back in the water, the Memorandum of Understanding (MOU) fell apart, and they are back to bombing each other (Iran/US). Will the new hostilities last with yet another ceasefire? Or will this continue for whatever period of time? High gasoline prices have a way with bringing President Trump back to the table. Will that work again?
Markets reacted. Oil soared, gold and stocks fell then rebounded, and bond yields rose. The US$ Index rose marginally. The U.S. stock market was already shaky with the semiconductors falling. But no sooner were they falling when recommendations came to buy the dip. The market seems to suspect that hostilities won’t last long before they are talking about a ceasefire once again. That’s the way it has been since the onset of the MOU with on-again, off-again bombing. Expect volatility.
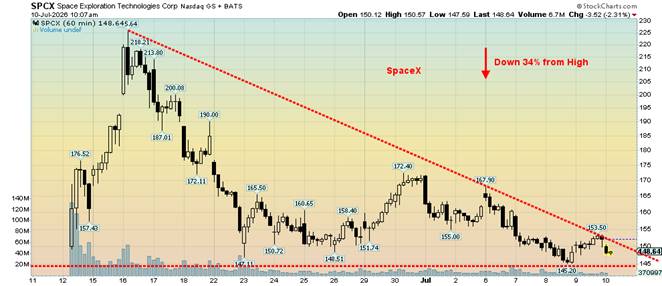
SpaceX was the darling that came out with huge fanfare and expectations. It soared from its original IPO offering of $135 to over $225. Then it crashed back to earth, now down 34% from its high. Given inclusion into the NASDAQ 100, it was thought it would help SpaceX to soar once again. No such luck. It went in the opposite direction.
Funds were gobbling up the issue. A lot of people are going to be disappointed. No, we don’t think it will turn into the debacle that occurred over the Trump cryptocurrency meme coin where the Trump family is estimated to have made some $1.4 billion. At least a million investors in the Trump meme coin are reported to have lost roughly $3.8 billion. When the Trump meme coin came out it soared to $45. It’s now $1.60, a loss of some 97%. The Melania meme coin fell even more from its post-issue high. When air goes up on hype, the fall is swift and devastating.
SpaceX has become a meme for the market. Whether it recovers or not, the damage has already been done. The Dow Jones Industrials (DJI) soared to all-time highs, then reversed and closed lower the day it made the new high. Then the DJI closed lower on the week. Does the rush to the exits become a stampede? That remains to be seen. But there weren’t many other indices rushing to new highs. July crashes are rare, but one we remember was 1990 and the outbreak of Gulf War 1 in Iraq. The market peaked on July 17, 1990, and over the next three months it fell some 22%, triggering a mild recession. Note that August is the 10th to 11th worst month of the year, September is the worst, and October is the month of crashes.
SpaceX June 11–present Hourly Chart
 Source: www.stockcharts.com
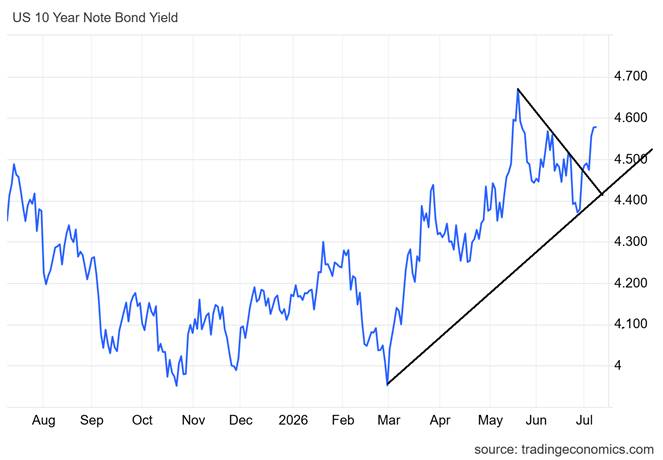
We see a couple of serious threats to the market. Bond yields are going up once again and the last thing the market needs is higher rates. The U.S. already pays out more in interest payments (estimated at over $1 trillion) on the debt than it spends on defense. What is the cost of the war with Iran? It is already estimated at between $40 billion to $100 billion. And that’s just over four and half months, during which there have been pauses. Call it the on again off again-on-again war oops off again war.
U.S. 10-year Treasury note yields have already jumped 8 bp in the past week. Canada is up as well but not as much. Even the 2-year Treasury note is up 2 bp.
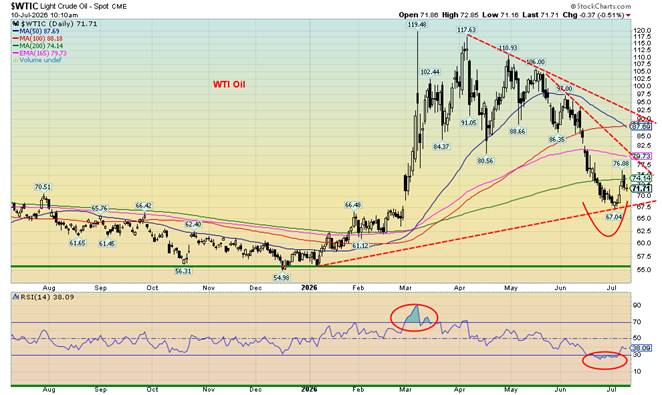
WTI oil prices have already jumped up over $5 since last week before settling back. Gasoline prices will follow. They peaked in the U.S. at on average over $4.50/gallon during the Iran war but are now around $3.80/gallon. Before the outbreak of the Iran war, U.S. gasoline prices were around $2.90/gallon. If the current outbreak continues, returning to earlier highs is probable and prices could go even higher.
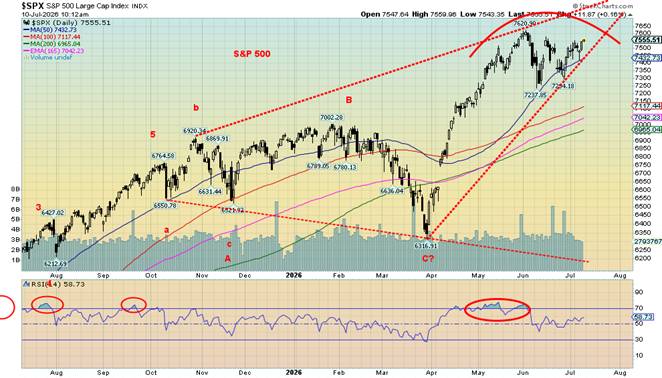
The stock market is wobbly. The AI bubble reached valuation levels comparable to what was seen during the peak of the Nifty Fifty bubble in 1972–1973 and the dot.com bubble in 1995–2000. All bubbles end badly and this one should be no exception. Already the recent drop in the semiconductors is signaling problems in the market. But to date no important points have been broken. The S&P 500 still has not firmly broken what appears as an ascending wedge triangle. That currently comes under 7,400. The S&P 500 needs to break under 7,200 to confirm the start of another wave to the downside. A topping pattern appears to be forming. However, a move back to over 7,550 would most likely signal that, instead of falling, we may be on our way to new all-time highs. Until we break down, that can never be ruled out. Above 7,550 new highs are probable. The S&P 500 gained 1.2% on the week but as noted the DJI made new highs but closed down 0.5% on the week.
Source: www.tradingeconomics.com, www.treasury.gov
While the DJI went on to new all-time highs, the other major indices did not. A divergence? Again, that can only be confirmed with a break of the recent daily low. Since peaking, the S&P 500 is down barely 2% while the NASDAQ is off its high by almost 5%. These declines are barely registrable. Ongoing positive economic
numbers or another announcement of a peace deal sends stocks higher. To trigger a decline, something else is needed. A sovereign debt crisis (The EU has some debt issues)? A large money center bank default (not likely)? Blowup in the private equity/private credit market? A blowup in the commercial real estate market? There are considerable risks around, but do any have the size to trigger a bigger market decline?
Source: www.stockcharts.com
A trigger could be a huge escalation in the Iran war that sends oil prices north of $150. But reality is that oil prices have to reach over $200 today to even equal the highs of 2008. Oil is much less factor in the economy today than it was in the 1970s or even 2008 as the world continues to wean itself off of oil. Overall WTI oil gained 4.1% on the week but Brent crude, which is closer to the action in Iran jumped 5.9%.
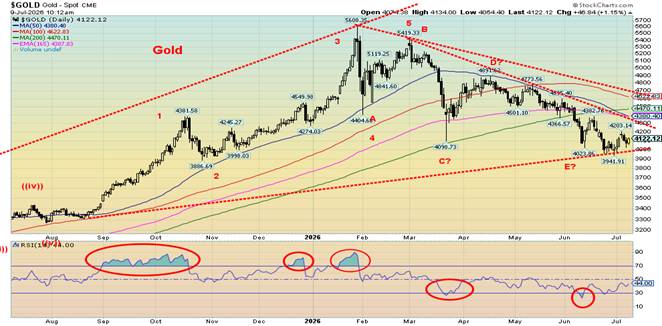
Gold and by extension silver and the gold stocks, represented by the Gold Bugs Index (HUI) and the TSX Gold Index (TGD), continue to struggle. This past week gold fell 0.3% while silver was down 1.9%. The gold stocks were hit with the Gold Bugs Index (HUI) off 4.8% and the TSX Gold Index (TGD) down 6.2%.
Given seasonal factors, gold could hit a secondary low before the end of July. That would not be unusual as the best seasonal months are usually August and September. The danger is that gold could break under $3,900, the recent low, and drop to around $3,400. That cannot be ruled out. Charts show that gold needs to break above first $4,400 and then $4,700 to suggest that a low is in. Gold continues to have the appearance of a
complex corrective pattern to the huge move that took place from 2022 to the top in January 2026 at $5,600. Gold needs to break above $5,200 currently to suggest new highs.
Some analysts have lowered their target for gold, notably Goldman Sachs. But others maintain targets up to $6,000. Gold’s demand by central banks remains robust, especially China, as they continue to lessen their holdings of U.S. treasuries and replace it with gold. If market perception lowers its expectations for a Fed rate hike, that would also be positive for gold. So far, gold’s response to the Iran war has been largely negative as bond yields tick higher. Higher interest rates are not friendly to gold. Also, while remaining somewhat subdued, the US$ Index also rose, which again is not friendly to gold.
Source: www.stockcharts.com
Continues
Source: www.stockcharts.com
As to silver and the gold stocks indices, silver needs to break above $70 and then $75 to suggest higher prices. Only above $106 are new highs possible. Silver needs to hold above $56, the recent low. The same is true for both the HUI and TGD. The HUI’s points are above 775 and hold the lows near 600. For the TGD, the points are above 900 and hold at the recent low near 720. The HUI gained 470% from the 2022 low to the January2026 high. Currently it is down 35% from that high. For the TGD, they gained 410% but are now down 32%. Compared to gold and silver, the gold stocks held quite well during this correction. Previously, drops of 70% were not unusual.
We remain friendly to the gold sector, and somewhat bearish towards the stock market. Neither have proven their next direction to date. Oil is highly dependent on the Iran war. Expectations are that oil prices will remain elevated as the odds of any lasting peace in the Middle East remain elusive. Everything – the price of oil, the stock market, and the price of gold – is currently prisoner to the ongoing unresolved U.S./Iran war. The stock market is also being shaken by the semiconductors. The summer continues to be hot, and we haven’t even mentioned the weather.
Chart of the Week
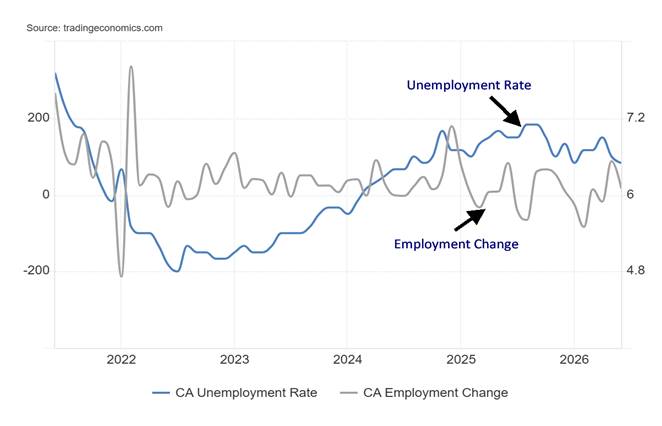
Canada Unemployment Rate, Employment Change 2021–2026
Source: www.tradingeconomics.com, www.statcan.gc.gov
Well, that was a surprise. Canada reported a gain of 18,200 jobs for June. But before we get too excited, only 600 were full-time while the rest (17,600) were part-time (student summer jobs?). Still, it’s a gain. They were only expecting 10,000. The unemployment rate fell to 6.5% from 6.6%. That was because the number employed rose while the number unemployed fell. The labour force participation rate remained unchanged at 65%. The R8 rate of unemployment (discouraged searchers, waiting group, and portion of involuntary part-timers) also fell to 8.5% from 9%. So, a good report except the jobs were part-time. However, many of those surprise part-time jobs went to young people.
Another surprise was that hourly average wages rose 3.7% year over year vs. an expectation of 3.1% and May’s 3.2%.
Given everything that’s going on, this report was a pleasant surprise.
Markets and Trends
|
|
|
|
% Gains (Losses) Trends |
|
||||
|
|
Close Dec 31/25 |
Close Jul 10/26 |
Week |
YTD |
Daily (Short Term) |
Weekly (Intermediate) |
Monthly (Long Term) |
|
|
|
|
|
|
|
|
|
||
|
S&P 500 |
6,845.50 |
7,575.39 |
1.2% |
10.7% |
Up |
up |
up |
|
|
Dow Jones Industrials |
48,063.29 |
52,637.01 (new highs) * |
(0.5)% |
9.5% |
up |
up |
up |
|
|
Dow Jones Transport |
17,357.19 |
22,177.86 |
0.7% |
27.8% |
up |
up |
up |
|
|
NASDAQ |
23,241.99 |
26,281.61 |
1.7% |
13.1% |
neutral |
up |
up |
|
|
S&P/TSX Composite |
31,712.76 |
35,305.31 |
0.1% |
11.3% |
up |
up |
up |
|
|
S&P/TSX Venture (CDNX) |
987.74 |
905.98 |
(3.4)% |
(8.3)% |
down |
down |
up |
|
|
S&P 600 (small) |
1,467.76 |
1,769.61 |
(0.7)% |
20.6% |
up |
up |
up |
|
|
ACWX MSCI World x US |
67.18 |
75.72 |
0.7% |
12.7% |
up (weak) |
up |
up |
|
|
Bitcoin |
87,576.98 |
63,815.63 |
2.6% |
(27.1)% |
up (weak) |
down |
neutral |
|
|
|
|
|
|
|
|
|
|
|
|
Gold Mining Stock Indices |
|
|
|
|
|
|
|
|
|
Gold Bugs Index (HUI) |
701.49 |
635.12 |
(4.8)% |
(9.5)% |
down |
down |
up |
|
|
TSX Gold Index (TGD) |
817.76 |
756.70 |
(6.2)% |
(7.5)% |
down |
down |
up |
|
|
|
|
|
|
|
|
|
|
|
|
Bonds% |
|
|
|
|
|
|
|
|
|
U.S. 10-Year Treasury Bond yield |
4.17% |
4.57% |
1.8% |
9.6% |
|
|
|
|
|
3.3Cdn. 10-Year Bond CGB yield |
3.44% |
3.51% |
1.7% |
2.0% |
|
|
|
|
|
Recession Watch Spreads |
|
|
|
|
|
|
|
|
|
U.S. 2-year 10-year Treasury spread |
0.69% |
0.35% |
12.9% |
(49.3)% |
|
|
|
|
|
Cdn 2-year 10-year CGB spread |
0.85% |
0.69% |
flat |
(18.8)% |
|
|
|
|
|
|
|
|
|
|
|
|
|
|
|
Currencies |
|
|
|
|
|
|
|
|
|
US$ Index |
98.26 |
100.97 |
0.1% |
2.8% |
up |
up |
down (weak) |
|
|
Canadian $ |
72.87 |
70.63 |
0.2% |
(3.1)% |
down |
down |
down |
|
|
Euro |
117.48 |
114.15 |
(0.2)% |
(2.8)% |
down |
down |
up |
|
|
Swiss Franc |
126.21 |
123.67 |
(0.6)% |
(2.0)% |
down |
down |
up |
|
|
British Pound |
134.78 |
133.99 |
0.4% |
(0.6)% |
up (weak) |
down |
up |
|
|
Japanese Yen |
63.83 |
61.83 |
(0.4)% |
(3.1)% |
down |
down |
down |
|
|
|
|
|
|
|
|
|
|
|
|
Precious Metals |
|
|
|
|
|
|
|
|
|
Gold |
4,311.97 |
4,111.58 |
(0.3)% |
(4.7)% |
down |
down |
up |
|
|
Silver |
71.16 |
59.75 |
(1.9)% |
(16.0)% |
down |
down |
up |
|
|
Platinum |
2,046.90 |
1,636.30 |
0.5% |
(20.1)% |
down |
down |
up |
|
|
|
|
|
|
|
|
|
|
|
|
Base Metals |
|
|
|
|
|
|
|
|
|
Palladium |
1,619.50 |
1,279.00 |
0.5% |
(21.0)% |
down (weak) |
down |
neutral |
|
|
Copper |
5.64 |
6.23 |
1.8% |
10.5% |
down (weak) |
up |
up |
|
|
|
|
|
|
|
|
|
|
|
|
Energy |
|
|
|
|
|
|
|
|
|
WTI Oil |
57.44 |
71.52 |
4.1% |
24.5% |
down |
neutral |
neutral |
|
|
Nat Gas |
3.71 |
2.94 |
(8.1)% |
(20.8)% |
down |
down |
neutral |
|
Source: www.stockcharts.com
* New All-Time Highs
Note: For an explanation of the trends, see the glossary at the end of this article.
New highs/lows refer to new 52-week highs/lows and, in some cases, all-time highs.
Copyright David Chapman 2026
|
GLOSSARY Trends Daily – Short-term trend (For swing traders) Weekly – Intermediate-term trend (For long-term trend followers) Monthly – Long-term secular trend (For long-term trend followers) Up – The trend is up. Down – The trend is down Neutral – Indicators are mostly neutral. A trend change might be in the offing. Weak – The trend is still up or down but it is weakening. It is also a sign that the trend might change. Topping – Indicators are suggesting that while the trend remains up there are considerable signs that suggest that the market is topping. Bottoming – Indicators are suggesting that while the trend is down there are considerable signs that suggest that the market is bottoming. |
David Chapman is not a registered advisory service and is not an exempt market dealer (EMD) nor a licensed financial advisor. He does not and cannot give individualised market advice. David Chapman has worked in the financial industry for over 40 years including large financial corporations, banks, and investment dealers. The information in this newsletter is intended only for informational and educational purposes. It should not be construed as an offer, a solicitation of an offer or sale of any security. Every effort is made to provide accurate and complete information. However, we cannot guarantee that there will be no errors. We make no claims, promises or guarantees about the accuracy, completeness, or adequacy of the contents of this commentary and expressly disclaim liability for errors and omissions in the contents of this commentary. David Chapman will always use his best efforts to ensure the accuracy and timeliness of all information. The reader assumes all risk when trading in securities and David Chapman advises consulting a licensed professional financial advisor or portfolio manager such as Enriched Investing Incorporated before proceeding with any trade or idea presented in this newsletter. David Chapman may own shares in companies mentioned in this newsletter. Before making an investment, prospective investors should review each security’s offering documents which summarize the objectives, fees, expenses and associated risks. Although Artificial Intelligence (AI) may be deployed from time to time, AI output is monitored and adjusted, if necessary, for accuracy. David Chapman shares his ideas and opinions for informational and educational purposes only and expects the reader to perform due diligence before considering a position in any security. That includes consulting with your own licensed professional financial advisor such as Enriched Investing Incorporated. Performance is not guaranteed, values change frequently, and past performance may not be repeated.
About the author


Website: https://www.enrichedinvesting.com
Disclaimer: David Chapman is not a registered advisory service and is not an exempt market dealer (EMD) nor a licensed financial advisor. We do not and cannot give individualised market advice. David Chapman has worked in the financial industry for over 40 years including large financial corporations, banks, and investment dealers. The information in this newsletter is intended only for informational and educational purposes. It should not be considered a solicitation of an offer or sale of any security. The reader assumes all risk when trading in securities and David Chapman advises consulting a licensed professional financial advisor before proceeding with any trade or idea presented in this newsletter. David Chapman may own shares in companies mentioned in this newsletter. We share our ideas and opinions for informational and educational purposes only and expect the reader to perform due diligence before considering a position in any security. That includes consulting with your own licensed professional financial advisor.