
It may have seemed like the crash of the century when the Tokyo Nikkei Dow (TKN) plunged a rather scary 12.4% last August 5. It took other markets in the EU and North America with it but not to that extent. Then came the bounce back as on August 6 the TKN rebounded 10.2%. So what's happening? Something called the yen carry trade. Add in overleveraging and we have a crisis. We attempt to explain.
Our chart of the week is double this past week. First, we have a look at the problems of insurance companies that are being battered by extreme weather events. Second, we look at Canada's job numbers that were either good news or bad news depending on how you look at it.
Markets were volatile this past week but at the end of the week, they ended up largely where they started. Pundits are declaring the spike in volatility is over and it's back to business as usual. Or is it? We are intrigued by some possible similarities with the 1968-1975 stock market. We were also intrigued by a chart we posted that shows how dominant the tech sector is and how under-owned and unloved the commodity sector is. Enghouse Systems Ltd, a technology company that provides vertical enterprise software solutions that reported increased revenue, expanded profits, higher cash flow, a greater dividend, and is held in the Enriched Capital Conservative Growth Strategy* is an example in Canada of how dominant the tech sector is compared to the commodity sector. The last time we saw that was in 1998-2000.
Interest rates backed up a bit this past week as some ISM numbers and the weekly claims numbers were stronger than expected. Gold eked out a gain during the volatile week but that was it for the precious metals that mostly finished the past week down. Oil rebounded largely on geopolitical concerns.
The heat wave has eased at least in the east. But remnants of Hurricane Debby hovered over us this past week. Have a great week!
DC
* Reference to the Enriched Capital Conservative Growth Strategy and its investments, celebrating a 5-year history of strong growth, is added by Margaret Samuel, President, CEO and Portfolio Manager of Enriched Investing Incorporated, who can be reached at 416-203-3028 or msamuel@enrichedinvesting.com
“If banking institutions are protected by the taxpayer and they are given free reign to speculate, I may not live long enough to see the crisis, but my soul is going to come back to haunt you.”
—Paul Volcker, American economist, 12th Chairman of the Federal Reserve 1979–1987, activist, poet, scientist, philosopher, Chair of the Economic Recovery Advisory Board 2010; 1927–2019
“Banking establishments are more dangerous than standing armies; and that the principle of spending money to be paid by posterity, under the name of funding, is buy swindling futurity on a large scale.”
—Thomas Jefferson, American statesman, planter, diplomat, lawyer, architect, philosopher, founding father and third president of the United States 1801–1809, primary author of the Declaration of Independence; 1743–1826
“When I have to depend upon hope in a trade, I get out of it.”
—Jesse Livermore, American stock trader, pioneer of day trading, the basis for the main character of Reminiscences of a Stock Operator by Edwin Lefèvre; 1877–1940
Tokyo Nikkei Dow (TKN) and Japanese Yen 2019–2024
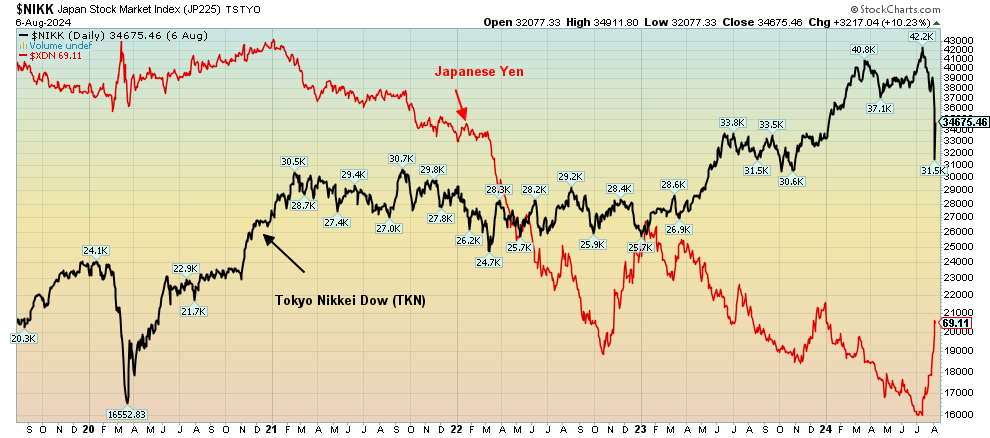
Source: www.stockcharts.com
The Tokyo Nikkei Dow (TKN) plunged earlier this week. On Monday, August 5, the TKN plunged 12.4%, the biggest drop since October 1987. Point-wise, it was 4,451 points, the biggest drop ever. It was the definition of a crash. That, of course, spilled over into North American markets, but thankfully the drop wasn’t as dramatic.
So, what happened? It was only recently, following a 34-year hiatus, that the TKN recovered its 1990 high. Yes, 34 years. And remember that’s in nominal terms. In inflation-adjusted terms the TKN is still nowhere near that high. That the TKN rebounded some 10%+ the next day was no consolation.
No, the crisis is not over. It may be only beginning. The excuse for the decline was that Japanese investors were worried that the U.S. economy may be in worse shape than they thought. What it disguises, of course, is something more. Something called the yen carry trade was being unwound and that resulted in all sorts of gyrations.
Japan has some of the lowest interest rates in the world. You could borrow at ridiculously low rates and buy the stock market and it was almost guaranteed to make one money. For years, the Bank of Japan (BOJ) held rates at sub-zero. This was a feeble attempt to revive the perennially moribund Japanese economy, particularly after the COVID pandemic of 2020–2021. Except for the initial burst after the pandemic, the Japanese economy resumed its ultra-low growth pattern. While not officially in a recession, Q1 saw negative 0.2% growth. Not so the stock market. It soared to new heights.
With Japan artificially maintaining an ultra-low-interest rate environment, even as others raised interest rates, it caused a couple of things. First, the Japanese yen fell even lower against other currencies, particularly the U.S. dollar. Second, huge international companies such as Toyota Motor, whose international earnings dwarf their domestic Japanese earnings, made record profits. When translated into Japanese yen, those profits were huge. That helped spark the TKN to record highs.
Then inflation and interest rates began to rise but the BOJ refused to adjust its central bank rate to reflect that Japan was seeing an increase in inflation, resulting in a rise in the 10-year bond (JGB) yields. None of that stopped what became known as the yen carry trade. The carry trade is such that one borrows in Japanese yen at ultra-low rates, then reinvests either in the stock market or, as many did, sells the yen for U.S. dollars and buys U.S. treasury securities at much higher yields or even buys the U.S. stock market. When the BOJ finally hiked rates, it didn’t take long for the sinking Japanese yen to rise dramatically, precipitating a mad scramble to unwind the yen carry trade. That in turn helped sink the stock market and, with the sudden rise of the Japanese yen, many traders were caught offside.
All this reminds us of a couple of events that occurred almost thirty years ago. First was the Asian contagion of 1997 when the collapse of the Thai Bhat sparked a crisis that quickly spread to Korea, Indonesia, and other South Asian countries. Thailand had a large external debt, largely denominated in U.S. dollars, and the collapse of the currency made it almost impossible to pay. The fear was that it would spark a global meltdown and liquidity crisis. The second was the Russian default of 1998 when the Russian ruble collapsed and there was fear that Russia would default on domestic and international debt. One company, Long Term Capital Management (LTCM) which was leveraged beyond reason collapsed, threatening to spark a global financial crisis. It took massive intervention from the Federal Reserve along with a consortium of money center banks to prevent a global meltdown.
This wasn’t even the first time that carry trades resulted in near meltdowns. In 1994, a collapse of the U.S. bond market almost sparked a global crisis and unwinding of carry trades as attempts were made to revive the sinking U.S. dollar. Once again, the Japanese yen was a key part of the crisis.
Japan, Bank Rate, 10-year Bond (JGB), Inflation Rate, GDP Growth Rate 2019–2024
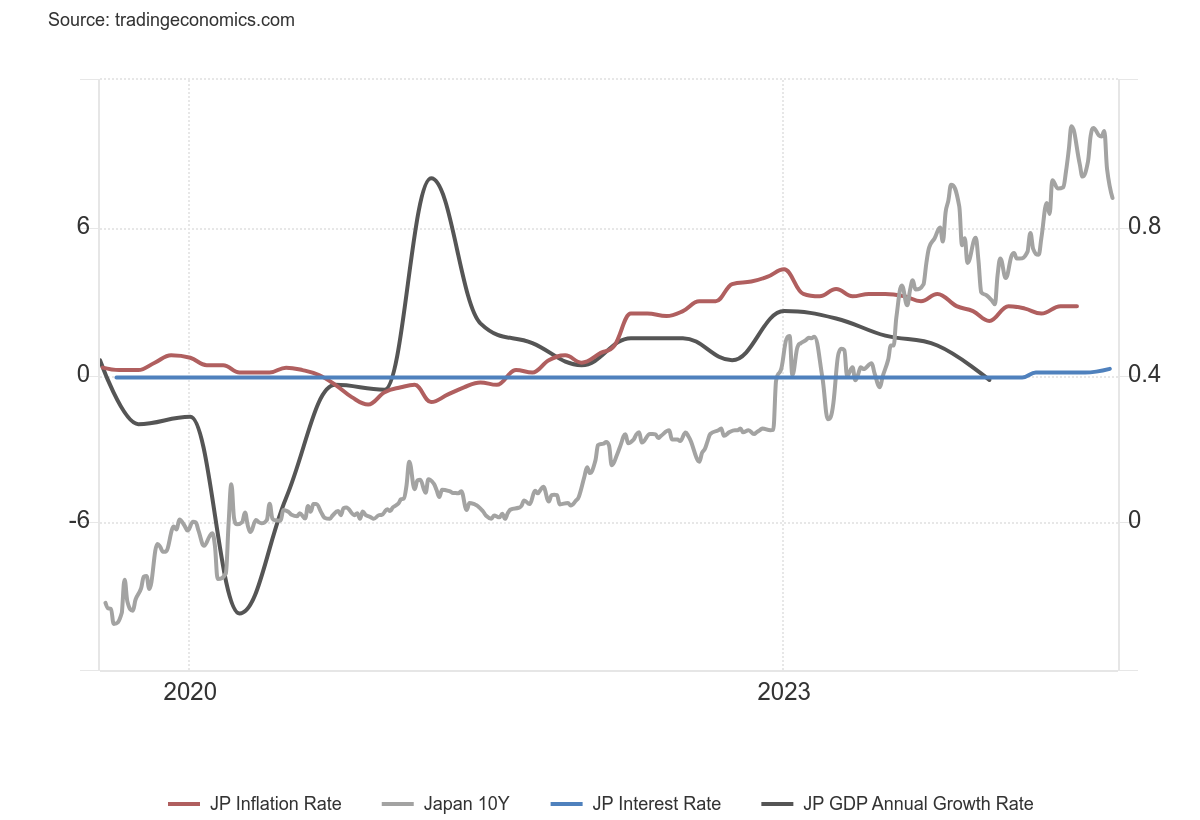
Source: www.tradingeconomics.com, www.cao.go.jp, www.soumu.go.jp, www.boj.or.jp
Now the fear is that the Japanese crisis could spark a global liquidity crisis. Maintaining low interest rates in Japan, even as the Fed and other central banks raised interest rates, sparked the yen carry trades. Investors over leveraged as well so when the selling came it exacerbated the decline. Why invest in the Japanese bond market when one can get higher yields in U.S. dollars or euros? The cheap yen also sparked foreign buying of the TKN as, once again, it was cheap to borrow in yen and reinvest almost anywhere. Then the BOJ started hiking interest rates. It wasn’t much to go from a bank rate of negative 0.1% to 0.25% but it was enough. Sparked by thoughts that the Fed will cut rates in September, there was a rush to the door to get out of the carry trades that would now swiftly go underwater.
All this fed back into the Japanese stock market and the panic was on. Japanese companies have been on life support for years. Many of them were called zombie companies—dead, bankrupt, but kept alive artificially by the BOJ. Japan is the most indebted nation in the world with a mind-boggling debt to GDP ratio of 264%, according to www.tradingeconomics.com. The Bank of Japan (BOJ) is also the most overleveraged central bank in the world. The BOJ’s balance sheet is some 127.5% of GDP. The Fed is only 25%. The Fed has a large influence on U.S. markets. The BOJ’s influence is even larger on the Japanese economy. Debt plus overleveraging is a dangerous combination. Japanese investors own a huge $10.6 trillion of foreign assets. What happens if the Japanese need to sell these to raise money back home?
The simple answer is yes and that in turn could spark a liquidity crisis.
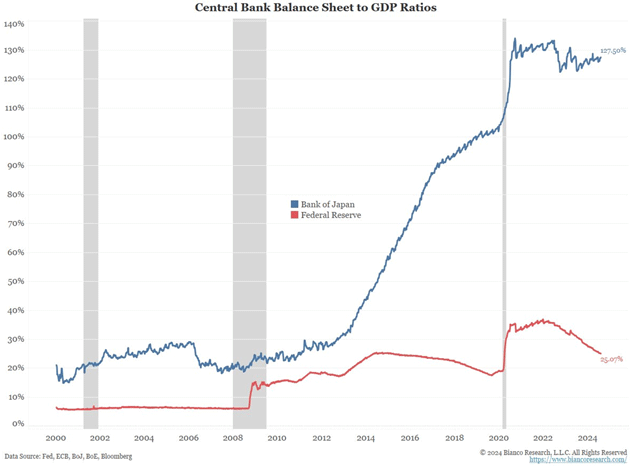
Source: www.biancoresearch.com, www.maudlineconomics.com, www.bloomberg.com, www.federalreserve.gov, www.boj.or.jp
Gold in Japanese Yen 2019–2024
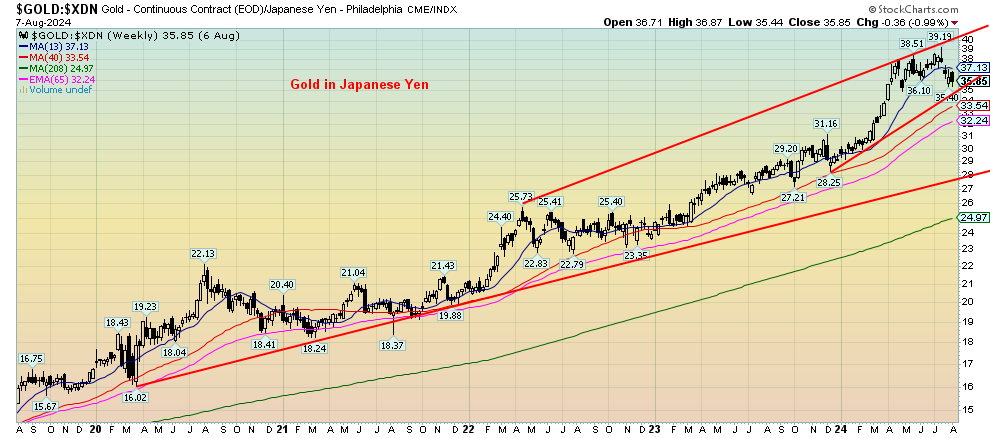
Source: www.stockcharts.com
One beneficiary has been gold in Japanese yen terms. Since the pandemic low in March 2020, gold in Japanese yen rose 145% to that recent top. It’s still up 123%. Gold in U.S. dollars is only up 70%. This is the strongest case for owning gold in a financial crisis and as protection against a depreciating currency. While the rise has also occurred in other major currencies such as the U.S. dollar, Australian dollar, Canadian dollar, euros, and pound sterling, none has been as dramatic as the rise in Japanese yen.
A liquidity crisis emanating out of Japan may just be getting underway. The strong U.S. dollar already has numerous countries experiencing financial trouble, raising the spectre of sovereign default. Many borrowed in U.S. dollars, but as their currencies depreciated, that U.S. debt has become considerably more expensive. However, nobody has more debt than Japan. And it seems that nobody is more overleveraged than those that participated in the yen carry trade.
Chart of the Week #1
Source: www.stockcharts.com
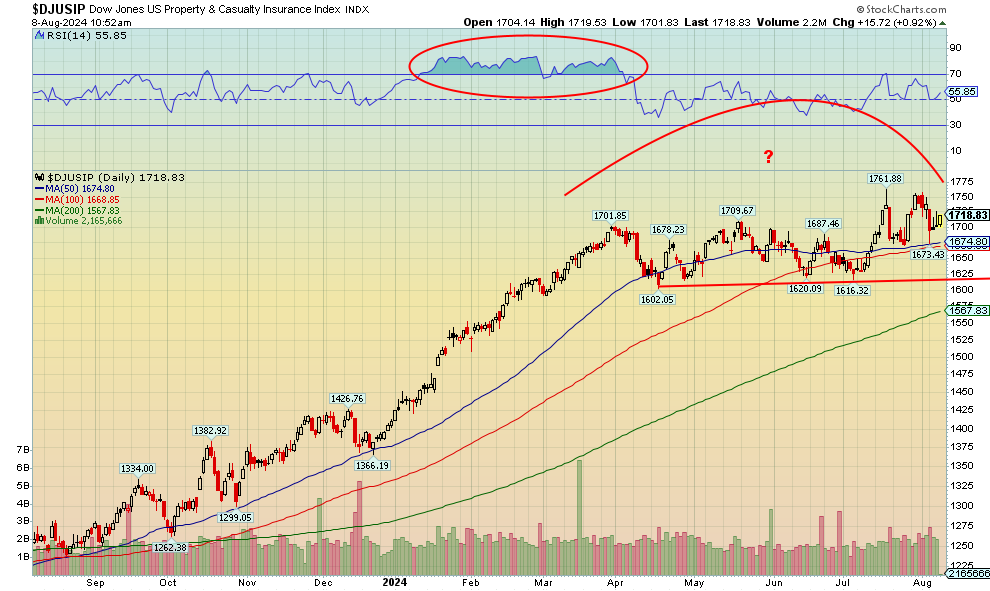
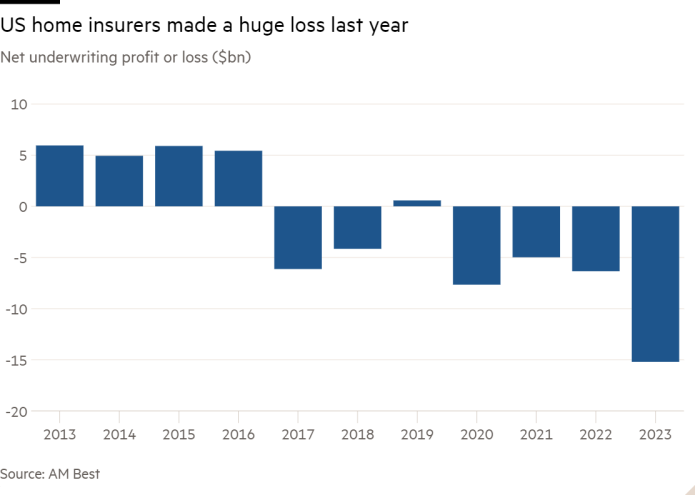
In looking at this chart of the Dow Jones US Property & Casualty Insurance Index, you’d never know that home insurers suffered their worst underwriting loss ever over the past year. Actually, they have suffered losses for six of the past seven years. The same story is playing out in Canada as well. Blame it on global warming, a phrase some dare not speak. But natural disasters that have become a regular occurrence are at the heart of the problems for the insurance industry. Fire, floods, hurricanes, and killer heat waves, then add in inflation and population growth and you have a toxic mix. And, no, it doesn’t necessarily have to be hurricanes as incidences of severe rainfall causing major flooding have also been on the rise.
For insurance companies, these reoccurring natural disasters only have two solutions. One is to raise premiums beyond what many can afford; the other is refuse to offer insurance of any kind in known danger zones. All of this is creating an affordability crisis for many homeowners, not just in disaster zones in the U.S. but in Canada as well. In the U.S., California, Texas, and Florida are the most vulnerable. In Canada, it’s Alberta and B.C. In 2023, insurers suffered a $15.2 billion loss, all according to rating agency AM Best.
It seems that as needs go up, prices go up. And it is not just the cost of insured damage for those rebuilding; the costs of rebuilding have also skyrocketed as labour shortages develop. It all falls on the homeowner.
Governments can only do so much. But sometimes strict regulatory rules hamper things as well.
And it is not as if this is just in North America, as the U.K. and the EU are also suffering under severe weather events. In places like parts of Africa, South Asia, and parts of Latin America, the regions just become uninhabitable largely due to droughts plus the killer heat waves, adding to the migration woes.
Source: www.ambest.com, www.ft.com
Canada has numerous companies offering property and casualty insurance including the major banks, plus companies like Aviva, Intact Financial, Co-Operators, and Desjardins.
With the increase in natural disasters, there might be an investing opportunity in property and casualty insurance. On the other hand, that may be a sector to avoid. The chart of the Dow Jones U.S. Property and Casualty Insurance Index looks very iffy, potentially forming a huge top. Some others have already broken down. But the disasters keep on coming.
Chart of the Week #2
Source: www.tradingeconomics.com, www.statcan.gc.ca
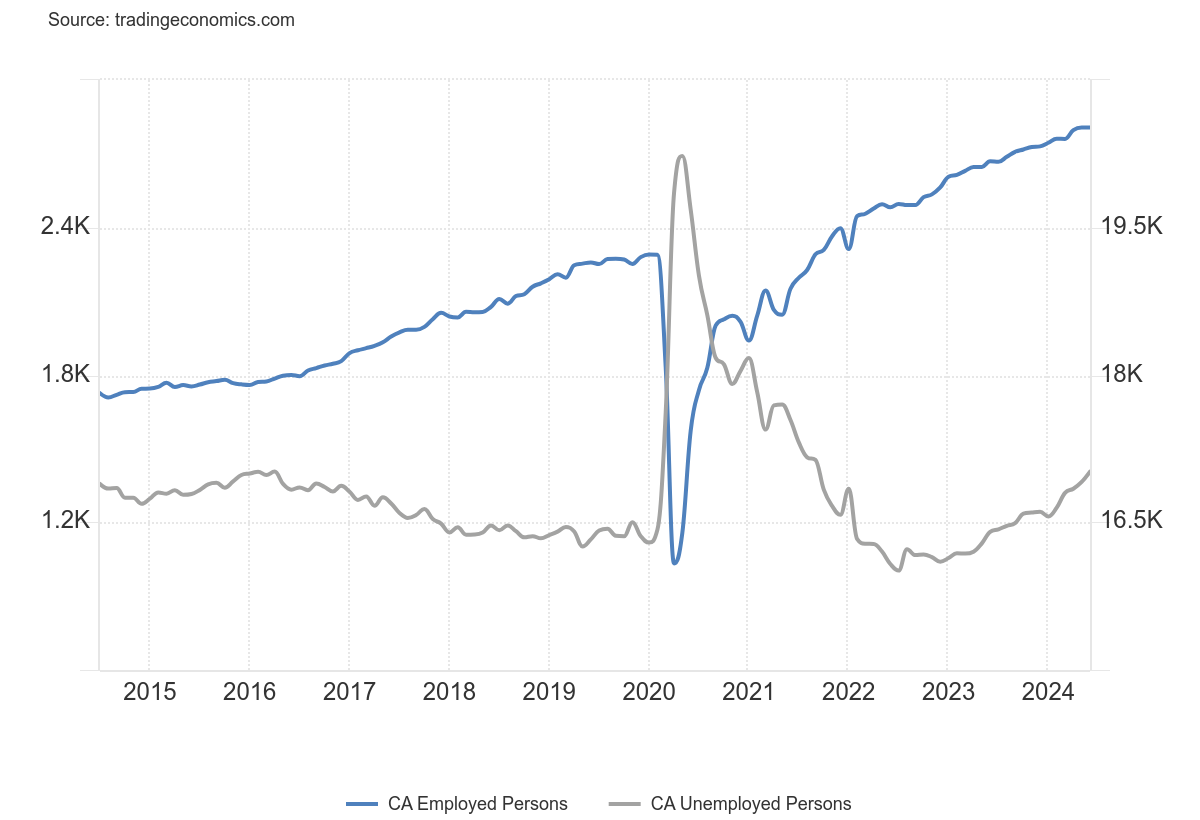
Canada’s latest job report is slightly confusing. First, they reported that the economy lost 2,800 jobs in July. They had expected a gain of 22,500. In June it was a decline of 1,400 jobs. We suppose that was the bad news. The good news is that full-time employment gained 61,600 but part-time employment fell 64,400. If Canada’s job market is softening, it has an odd way of showing it. The number of employed persons actually fell 1,400 while the number of unemployed persons rose 420. The unemployment rate remained unchanged at 6.4%, below the expected 6.5%. But the R8 unemployment rate, the highest reported by Statistics Canada which includes discouraged searchers, waiting groups, and a portion of involuntary part-timers, rose to 9.5% from 8.3%. That’s the highest reported since January 2022.
The labour force participation rate fell to 65.0% from 65.3%, suggesting that fewer people were seeking work. It was the lowest labour force participation rate in three years. So, a combination of fewer people working coupled with a big increase in full-time employment and fewer part-timers resulted in a net loss of jobs. But many would undoubtedly take that trade-off anytime, even if overall jobs fell. The big increase for jobs was in the key 25–54 age group, which is also positive, even as jobs fell for those over 54 and for those under 25. (https://www150.statcan.gc.ca/n1/daily-quotidien/240809/dq240809a-eng.htm). What the job numbers show is that younger people (students) are having a harder time. But not shown is that it is also impacting recent immigrants. One reason the unemployment rate was steady was that fewer people were actually looking for work. That’s reflected in the labour force participation rate.
That Canada’s job market is softening is not a surprise, given that interest rates were hiked to bring down the rate of inflation and also cool off the market. Given recent softening in the U.S. as well, it is no surprise it’s spilling over into Canada as well. Despite all this, the BofC is still expressing concern about the softening job market.
Some are predicting that the BofC will cut rates three more times this year in September, October, and December.
Markets & Trends
|
|
|
|
% Gains (Losses) Trends |
|
||||
|
|
Close Dec 31/23 |
Close Aug 9, 2024 |
Week |
YTD |
Daily (Short Term) |
Weekly (Intermediate) |
Monthly (Long Term) |
|
|
Stock Market Indices |
|
|
|
|
|
|
|
|
|
S&P 500 |
4,769.83 |
5,344.16 |
flat |
12.0% |
down |
up |
up |
|
|
Dow Jones Industrials |
37,689.54 |
39,497.34 |
(0.6)% |
4.8% |
neutral |
up |
up |
|
|
Dow Jones Transport |
15,898.85 |
15,334.53 |
(0.3)% |
(3.6)% |
neutral |
up |
up |
|
|
NASDAQ |
15,011.35 |
16,745.30 |
(0.2)% |
11.6% |
down |
up (weak) |
up |
|
|
S&P/TSX Composite |
20,958.54 |
22,311.30 |
0.4% |
6.5% |
neutral |
up |
up |
|
|
S&P/TSX Venture (CDNX) |
552.90 |
537.59 |
(3.2)% |
(2.8)% |
down |
down |
down |
|
|
S&P 600 (small) |
1,318.26 |
1,336.33 |
(1.0)% |
1.4% |
neutral |
up |
up |
|
|
MSCI World |
2,260.96 |
2,285.94 |
(1.1)% |
1.1% |
down |
neutral |
up |
|
|
Bitcoin |
41,987.29 |
60,692.92 |
(3.1)% |
44.6% |
down (weak) |
neutral |
up |
|
|
|
|
|
|
|
|
|
|
|
|
Gold Mining Stock Indices |
|
|
|
|
|
|
|
|
|
Gold Bugs Index (HUI) |
243.31 |
287.18 |
(2.1)% |
18.0% |
up |
up |
up |
|
|
TSX Gold Index (TGD) |
284.56 |
341.07 |
(3.0)% |
19.9% |
up |
up |
up |
|
|
|
|
|
|
|
|
|
|
|
|
% |
|
|
|
|
|
|
|
|
|
U.S. 10-Year Treasury Bond yield |
3.87% |
3.94% |
3.7% |
1.8% |
|
|
|
|
|
Cdn. 10-Year Bond CGB yield |
3.11% |
3.14% |
4.0% |
1.0% |
|
|
|
|
|
Recession Watch Spreads |
|
|
|
|
|
|
|
|
|
U.S. 2-year 10-year Treasury spread |
(0.38)% |
(0.12)% |
flat |
68.4% |
|
|
|
|
|
Cdn 2-year 10-year CGB spread |
(0.78)% |
(0.23)% |
(21.1)% |
70.5% |
|
|
|
|
|
|
|
|
|
|
|
|
|
|
|
Currencies |
|
|
|
|
|
|
|
|
|
US$ Index |
101.03 |
103.15 |
(0.1)% |
2.1% |
down |
down |
neutral |
|
|
Canadian $ |
75.60 |
72.90 |
1.0% |
(3.6)% |
neutral |
down |
down |
|
|
Euro |
110.36 |
109.16 |
flat |
(1.1)% |
up |
up (weak) |
neutral |
|
|
Swiss Franc |
118.84 |
115.58 |
(0.7)% |
(2.7)% |
up |
up |
up |
|
|
British Pound |
127.31 |
127.57 |
(0.4)% |
0.2% |
neutral |
up |
neutral |
|
|
Japanese Yen |
70.91 |
68.18 |
flat |
(3.9)% |
up |
up (weak) |
down |
|
|
|
|
|
|
|
|
|
|
|
|
|
|
|
|
|
|
|
|
|
|
Precious Metals |
|
|
|
|
|
|
|
|
|
Gold |
2,071.80 |
2,473.40 |
0.2% |
19.4% |
up |
up |
up |
|
|
Silver |
24.09 |
27.59 |
(2.8)% |
14.5% |
down |
up (weak) |
up |
|
|
Platinum |
1,023.20 |
929.90 |
(3.9)% |
(9.1)% |
down |
down (weak) |
down (weak) |
|
|
|
|
|
|
|
|
|
|
|
|
Base Metals |
|
|
|
|
|
|
|
|
|
Palladium |
1,140.20 |
896.40 |
1.6% |
(21.4)% |
down |
down |
down |
|
|
Copper |
3.89 |
3.99 |
(2.7)% |
2.6% |
down |
down (weak) |
neutral |
|
|
|
|
|
|
|
|
|
|
|
|
Energy |
|
|
|
|
|
|
|
|
|
WTI Oil |
71.70 |
76.84 |
4.5% |
7.1% |
down |
down |
down (weak) |
|
|
Nat Gas |
2.56 |
2.14 |
8.6% |
(16.4)% |
down |
down (weak) |
down |
|
Source: www.stockcharts.com
Note: For an explanation of the trends, see the glossary at the end of this article.
New highs/lows refer to new 52-week highs/lows and, in some cases, all-time highs.
- * New All-Time Highs
Source: www.stockcharts.com
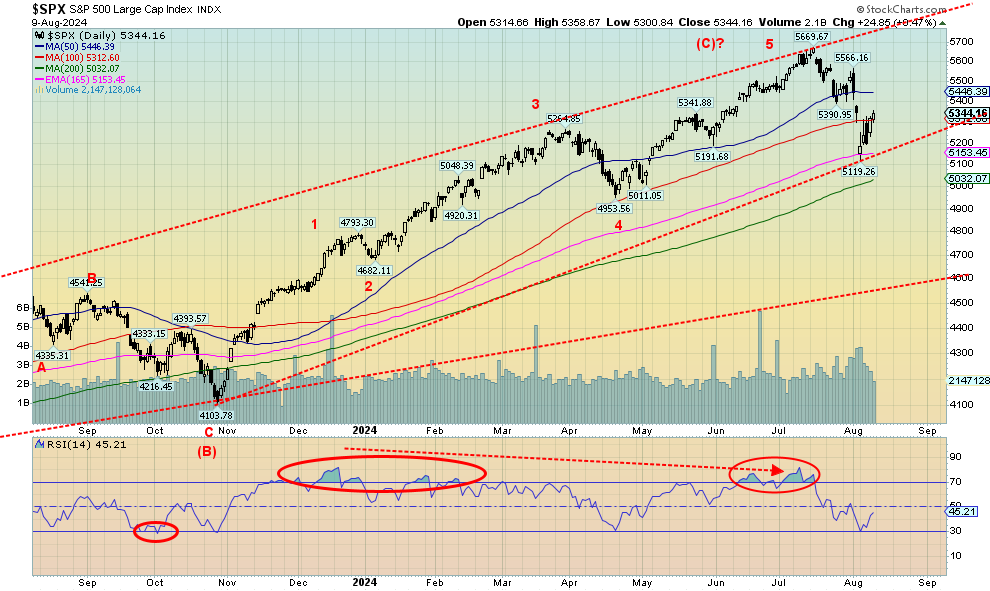
We’ve been asked, are we entering a bear market? The straight answer is no, at least not yet. A correction is normally a drop of 10% or more, while a bear market is normally defined as a drop of 20% or more. By that definition the last bear market was the 2022 market that saw the S&P 500 lose 27.5%. What was interesting about that decline is that we did not see an accompanying recession, even as the economy did cool somewhat. You don’t see that very often. It reminded us a bit of the 1968–1970 bear that saw the S&P 500 fall 37%. The economy did have a recession in 1969–1970 as GDP fell a rather mild 0.6% and unemployment peaked at 6.1%. After that decline, the S&P 500 rose 77%, led by the famous Nifty Fifty rally into January 1973.
Fast forward to today. This time the S&P 500 rallied 62% from the October 2022 low to a peak (so far) in July 2024. Instead of the Nifty Fifty we had the Magnificent Seven. What followed after the peak in January 1973 was a 48% decline for the S&P 500 into October 1974. We also had the 1973–1975 recession that saw the economy contract 3.2% and unemployment peak at 9.0%. Inflation was also an issue back then as inflation topped out at around 12% in November 1974. So far, inflation topped out around 9% in June 2022. Inflation has been falling ever since and we still haven’t had a recession. Nor a bear market. The total decline for the S&P 500 was only 9.7% this time, just shy of an official correction.
So, no, we can’t say we are in a bear market, even as one may be coming. The recent low was 5,119 and we note a low back in April at 4,953. If those two levels fall, then for sure we’d have to consider that a top is in.
It was the week of the Japanese meltdown. But the bounce-back was strong and the S&P 500 ended up roughly flat on the week. The Dow Jones Industrials (DJI) fell 0.6%, the Dow Jones Transportations (DJT) was down 0.3%, while the NASDAQ fell only 0.2%. Hit a little harder was the S&P 400 (Mid), down 0.4%, while the S&P 600 (Small) lost 1.0%. In Canada, the TSX was actually up 0.4% but the TSX Venture Exchange was hit, down 3.2%.
In the EU, it was generally positive as the London FTSE lost about 0.1%, the EuroNext gained 0.7%, the Paris CAC 40 was up 0.3%, and the German DAX gained 0.4%. Asia wasn’t as lucky as China’s Shanghai Index (SSEC) fell 1.5%, and despite the Japanese meltdown the Tokyo Nikkei Dow (TKN) bounced back and was down only 2.5% on the week. Hong Kong’s Hang Seng (HSI) gained 1.0%. Japan’s big drop day was Friday, August 2 and Monday, August 5 when the TKN fell altogether 18%. The TKN then rebounded over 10% on August 6.
So far, the bounce-back for the S&P 500 has only taken it to the 100-day MA. Following a meltdown such as we saw, it is not unusual to see a strong bounce-back. Call it a sucker’s rally. Once this rebound tops, the real bear could get underway. Oh, before that we may get a test of the recent lows before we rally again into late August/September. The word will be the decline is over, buy the dip.
The 165-day EMA acted as support and we did stay above the 200-day MA near 5,030. Hence, our thoughts that new lows and a break of 4,953 would signal to us a bigger drop was coming. Many believe the panic of the past week is over. Given the similarities so far between now and 1968–1975, we suspect that the big drop is on its way. A 48% drop à la 1974 would take us back to 2,900. That ought to get people’s attention. History doesn’t repeat itself, but it can rhyme.
Source: www.stockcharts.com
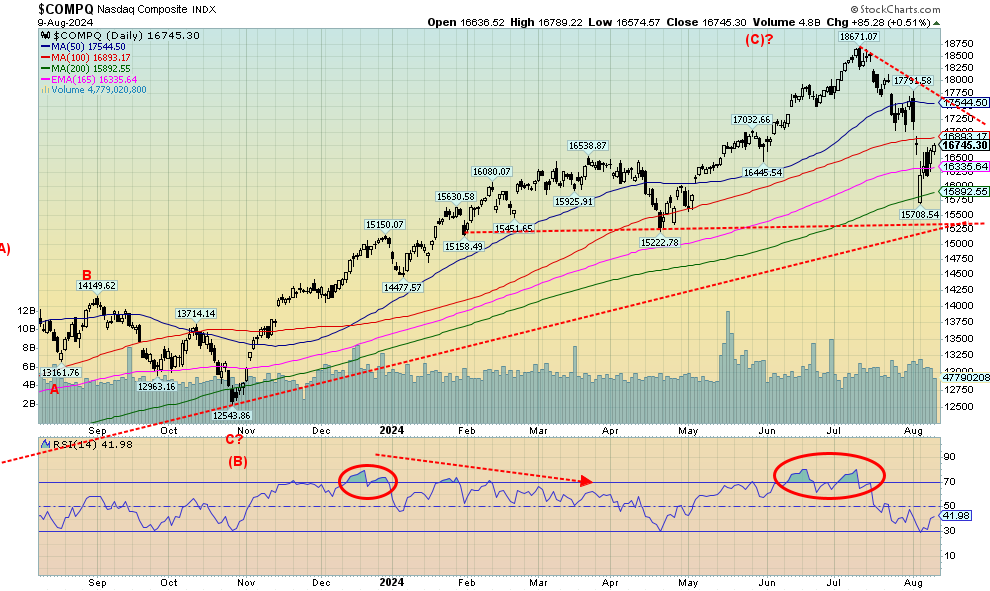
The NASDAQ was beaten up along with everyone else this past week following the Japanese meltdown. The NASDAQ did bounce back nicely but still closed the week off 0.2%. It was somewhat buoyed by the NY FANG Index that actually gained 0.5%. It was led by Meta, whose results sent it soaring 6.1%. At the other end, Tesla fell 3.7%. Musk is poorer, Zuckerberg richer. The NASDAQ fell all the way to the 200-day MA, which did what it should and acted as initial good support. The bounce only took the NASDAQ back towards the 100-day MA. We’d have to get back above 17,800 for us to believe a low is in. We’d have to get back above 18,000 to suggest new highs ahead. The zone between 15,250 and 15,900 should act as support, but if we were to break down under 15,250, then a more serious decline could be underway.
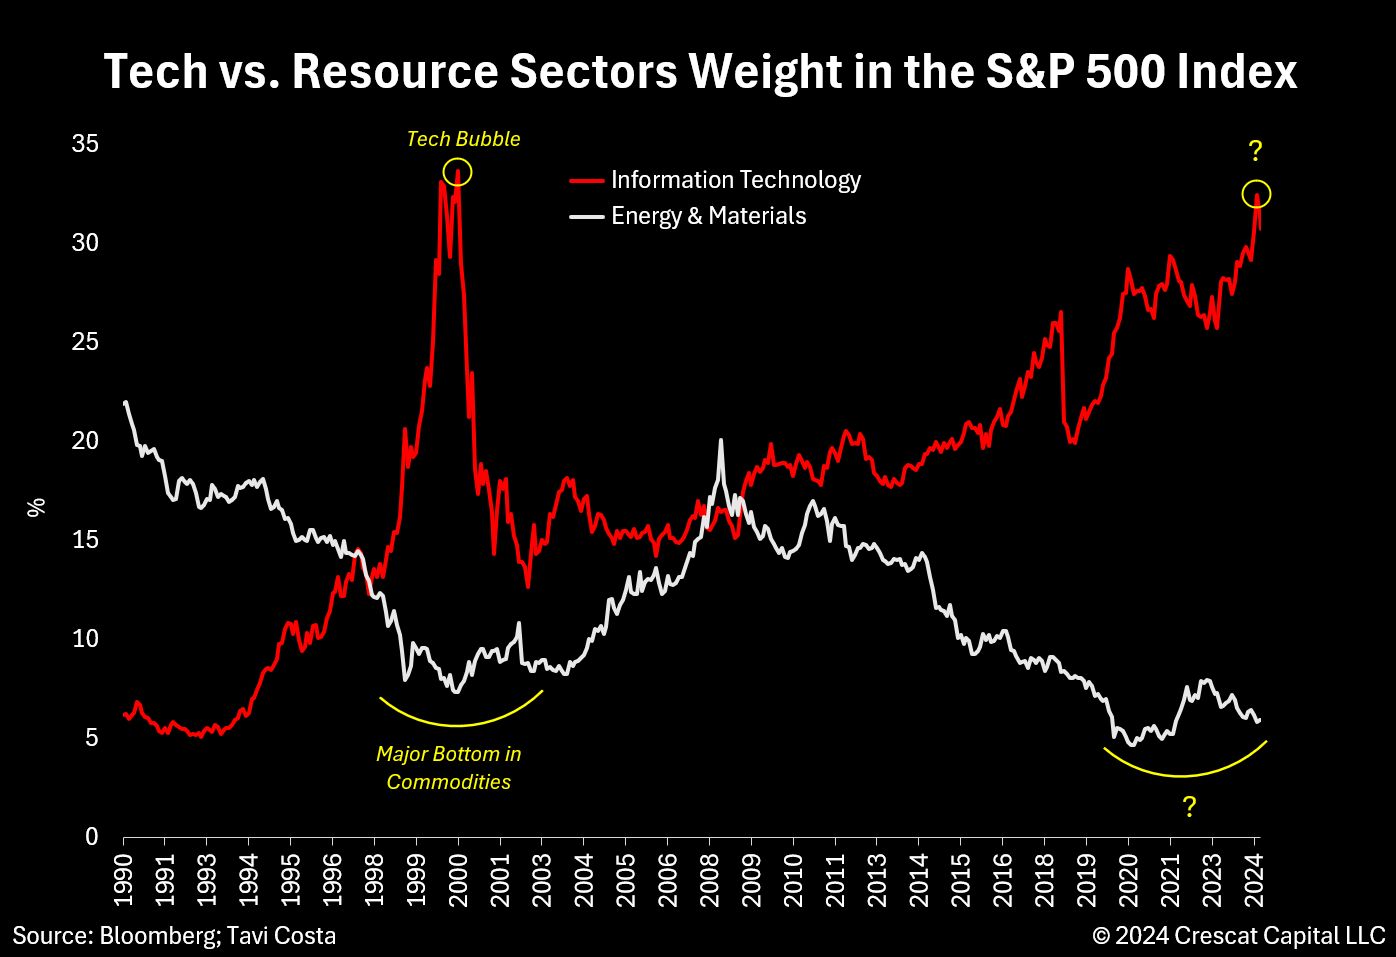
Source: www.bloomberg.com, www.crescat.net Courtesy of Tavi Costa
We found this interesting chart courtesy of Tavi Costa of Crescat Capital www.crescat.net. Costa is noting that the markets may be shifting. As was the case 1998-2000 technology stocks dominated. It was the dot.com/high tech bubble. On the other hand, commodities were being ignored, unwanted and unloved. Flash forward to today and once again thanks to the Magnificent Seven technology stocks are dominate. Commodities? Who cares it seems. Yet as we have noted elsewhere that iPhone contains apparently some 46 different minerals including gold and silver. Are we on the cusp of another great shift? The tech stocks were trashed 2000-2002. Meanwhile commodities started a rally that didn’t top until 2011.
Source: www.stockcharts.com
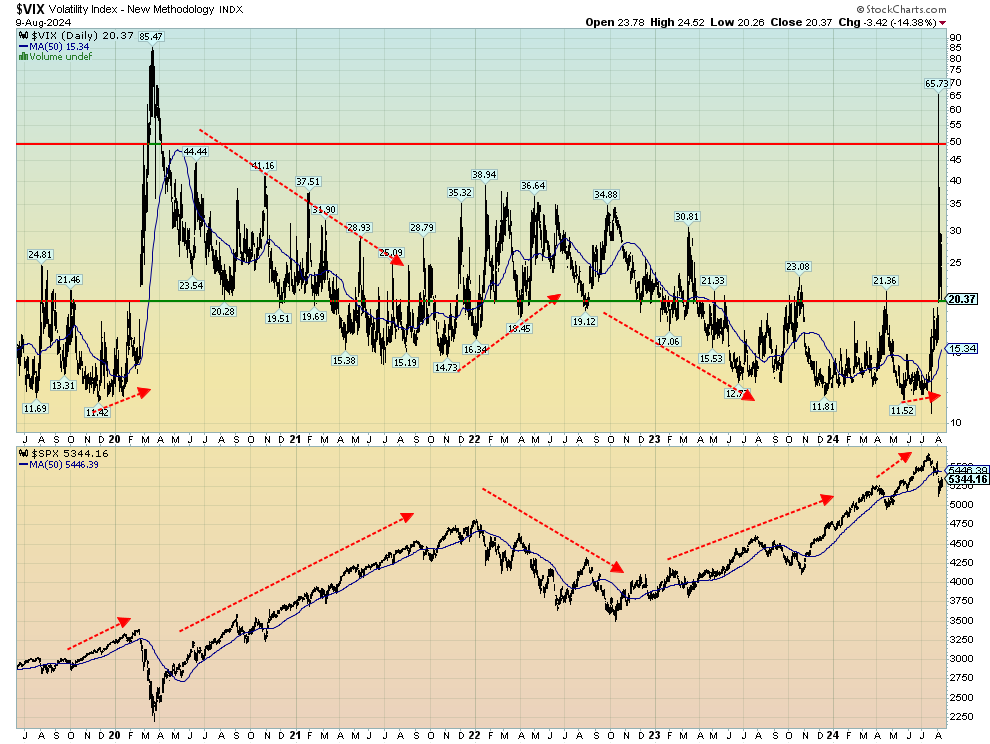
When we see the VIX Volatility Index soar above 50 as it did this past week with the Japanese meltdown, we know we are usually at or near a low for the stock market. Only three times in the past 25 years has the VIX soared above 50: this past week, during the pandemic crash of 2020, and during the financial crisis of 2008. Considering that the decline for the S&P 500 wasn’t really that dramatic, particularly since it was not on the scale of either 2008 or 2020, it was surprising to see the VIX hit a high of 65. We now wait for the VIX to get back under 20 to suggest that we may be approaching a low. Except highs in the VIX are usually spikes whereas lows for the VIX are usually dragged-out affairs that could see the index continue to move higher. Note the slight divergence at the recent highs where the S&P 500 continued higher even as the VIX was now making higher lows. The same thing happened back in late 2019 before the pandemic panic arrived. Normally the VIX and the S&P 500 move inversely to each other. Divergences at tops or bottoms usually signal a trend change coming. Except at bottoms, they tend to be spikes.
Source: www.stockcharts.com
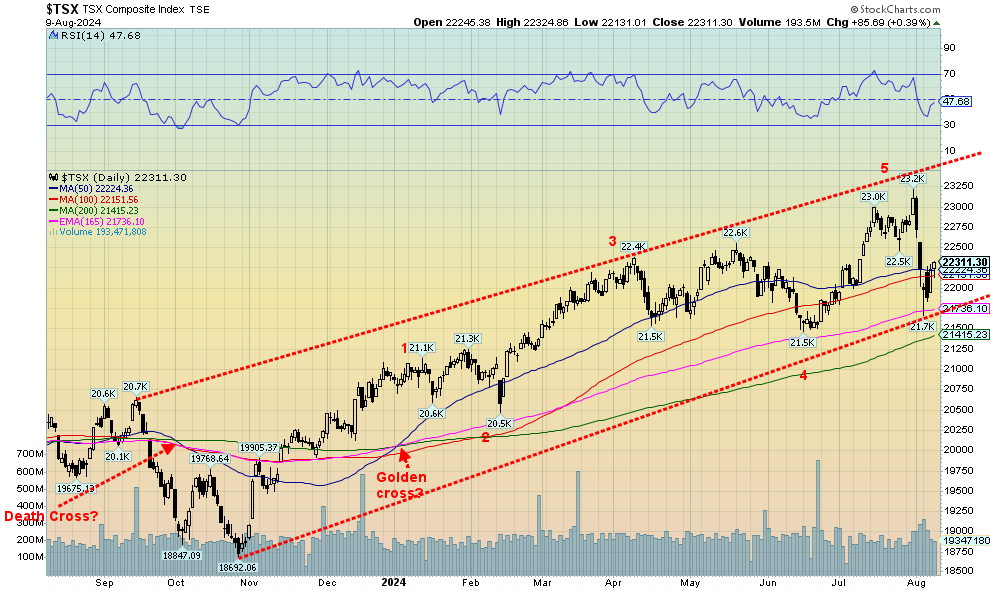
Despite the TSX suffering with everyone else in the global meltdown sparked by Japan, the TSX actually gained 0.4% this past week. Granted, all it did was take us back to the 50-day MA and possible resistance. Not so lucky was the TSX Venture Exchange (CDNX) which continues to be miserable, falling 3.2% and now down 2.8% in 2024. The CDNX is down about 14% from its May 2024 high. We don’t even want to think about how much it is down from its all-time high set way back in 2007. For the curious, the CDNX is down 84% from the 2007 high. Misery is the CDNX. For that reason alone, we believe that if the CDNX would get going it could see some of the best gains. The CDNX is over 50% junior mining companies most of which remain moribund and in a deep funk, unnoticed and unloved. Yet, as we crack while Apple soars, overlooked is the fact that a typical iPhone contains 46 different metals dominated by gold and silver. Buy the metals, sell the iPhone (stock).
Only three of the 14 sub-indices posted gains this past week while one was flat. Leading the gainers was Information Technology (TKK), up 5.9%. Energy was up 3.4%. Leading the way down was Materials (TMT), off 3.3%. Golds (TGD) fell 3.0% while Metals & Mining (TGM) was down 2.3%. Not a good week, but thanks to TKK the TSX was up marginally. The TSX found support at the 165-day EMA. Below lies the 200-day MA at 21,415. A break of that level would take out that June low and suggest lower prices ahead. Resistance is here at the 50-day MA, but we need to regain 22,500 to suggest higher and get above 22,850 to suggest new highs ahead. This could be an A wave down from that recent high. The B wave might now be underway with the C wave down to follow.
U.S. 10-year Treasury Note, Canada 10-year Bond CGB
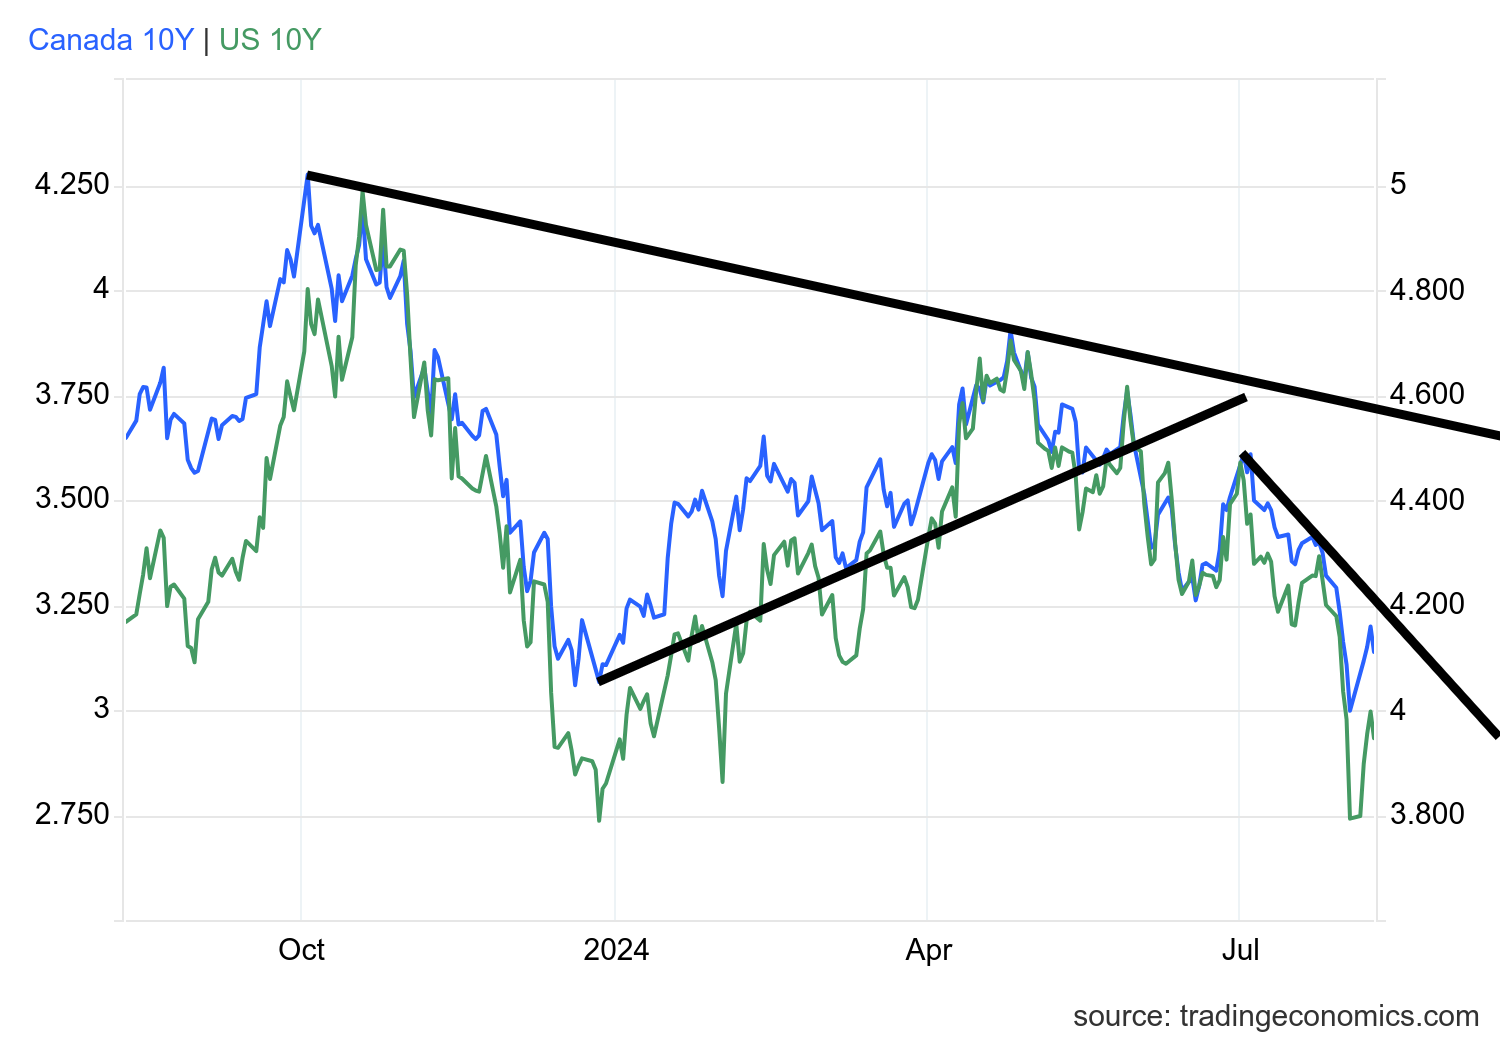
Source: www.tradingeconomics.com, www.home.treasury.gov, www.bankofcanada.ca
U.S. interest rates rose this past week as some slightly better economic numbers buoyed the market. Initial jobless claims surprised, coming in at 233,000, below the expected 245,000 and below the previous week’s 255,000. Despite the poor jobs report on August 2, the better than expected weekly jobless claims surprised. Earlier in the week, ISM numbers came in better than expected as well, which helped take interest rates back up. Still, the downtrend remains in place as we’d have to break back above 4.20% to suggest higher yields ahead. On the week, the U.S. 10-year treasury note rose to 3.94% from 3.80% the previous week. Canada’s 10-year Government of Canada bond (CGB) also jumped, up to 3.14% from 3.02%. The 2–10 spreads were fairly stable as the U.S. remained unchanged at negative 12 bp, although Canada widened a bit to -23 bp from -19bp.
The market has softened its stance that the Fed will cut 50 bp at the September meeting, lowering expectations now to only a 25 bp cut. This week should see some reaction in the market. Tuesday brings us PPI with expectations of a 3% gain year over year (y-o-y). Wednesday brings us the CPI with expectations also of
3% y-o-y. Both would be in line with the June number. But it keeps the Fed onside for a possible 25 bp cut. Also, out this week are retail sales and the preliminary Michigan Consumer Sentiment Index. We also get some manufacturing indices in the NY Empire State Index and the Philly Fed. There will definitely be a few numbers this coming week that could spark fireworks.
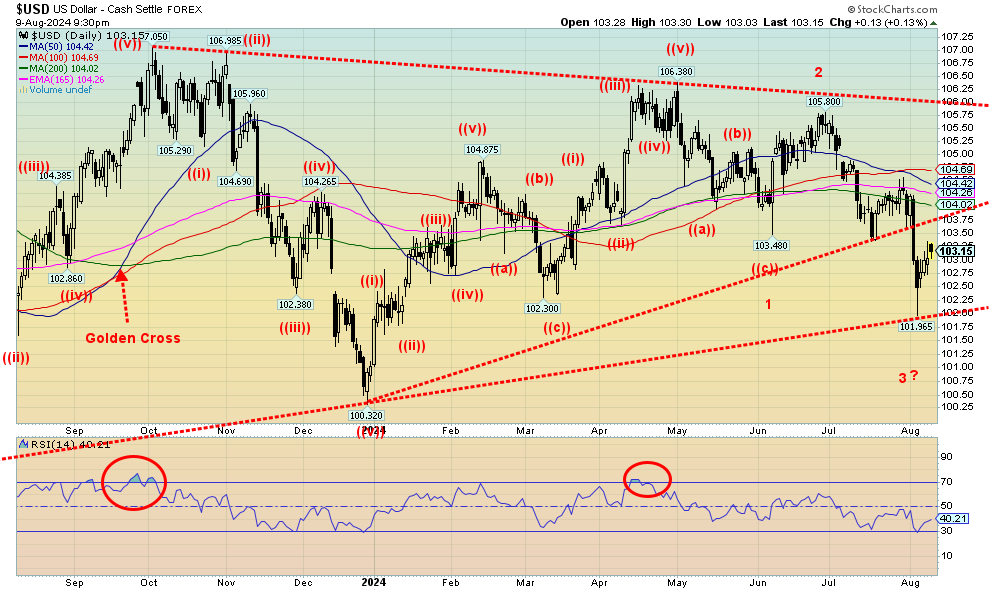
Source: www.stockcharts.com
The unwinding of the yen carry trade has negatively impacted the US$ Index. What happens is that U.S. securities are sold to purchase yen and deal with loans in Japan. The result: dollar down, yen up. The yen had its big move last week and this week was steady with little or no gain or loss. The US$ Index was down only about 0.1%. The euro was flat, the Swiss franc fell 0.7%, while the pound sterling was down 0.4%. A big winner was the Cdn$, up almost 1.0%. As noted, the big fall for the US$ Index was last Friday, August 2. The Japanese meltdown came on August 5. The US$ Index broke support near 103.75 and plunged to next good support near 102. Since then, the US$ Index has rebounded, but overhead resistance is at 103.75. We’d also need to break back over 104.75 to suggest to us that a low is in. We’d have to get back above 105.40 to suggest new highs ahead. That is, we believe, unlikely as the U.S. economy is showing signs of slowing and there is continued talk of the Fed cutting interest rates. As well, we have a wobbly stock market. None of that is positive for the US$ Index.
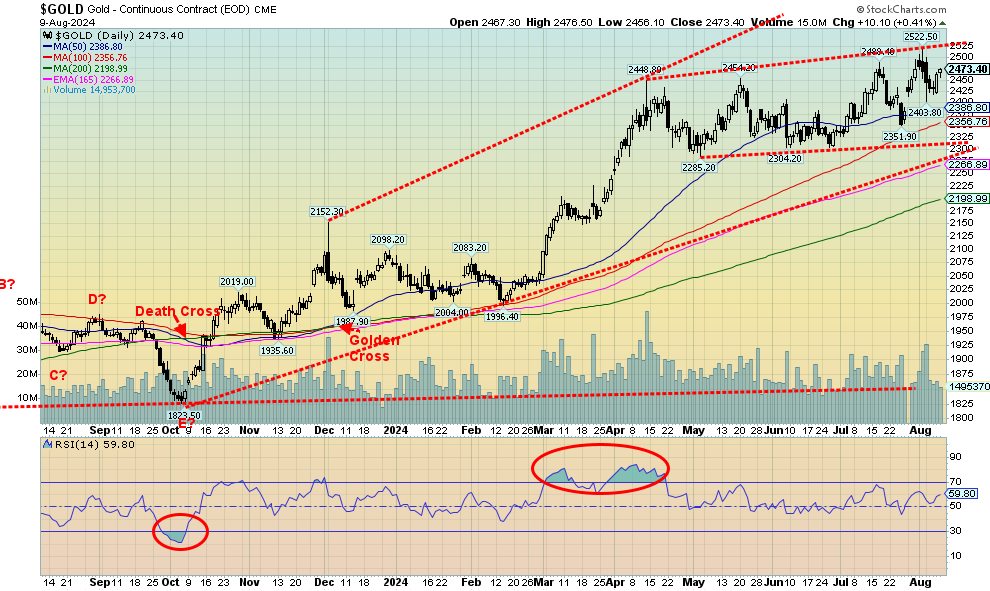
Source: www.stockcharts.com
For the second week in a row, gold prices rose, albeit a small 0.2%. This came in the face of the Japanese meltdown that spilled over into North American markets. However, for the rest of the precious metals market, it wasn’t such a positive week. Silver fell 2.8%, platinum remains moribund, down 3.9% this past week, and as for the near precious metals, palladium did catch a bid up 1.6% but copper remains in a hole, losing 2.7% this past week. The gold stocks didn’t fare much better with the Gold Bugs Index (HUI) down 2.1% and the TSX Gold Index (TGD) off 3.0%. Gold is being buoyed by thoughts of a Fed rate cut. The potential for an economic slowdown, even a recession, also bolstered gold. Gold has become the number one metal of choice as a safe haven particularly in Asia. Gold is up 19.4% thus far in 2024, outpacing both the S&P 500 and the tech-laden NASDAQ. Yet gold remains undervalued and under-owned, particularly in North America. Asians are much more likely to purchase gold. Gold also responded to a lower 10-year treasury note on Friday as the metal was up some $10.
The pattern that gold is forming is taking on the look of a possible ascending triangle. A breakout to new highs above $2,525 could target up to almost $2,700. The main reason to own gold is as a safe haven in times of geopolitical uncertainty and a low interest rate environment, and as a hedge against currency depreciation. Gold, the metal, is preferred over gold stocks which, while leveraged to the price of gold, have liability. Witness the recent collapse of Victoria Gold when its heap leach pad failed and the contamination spread into local waters, killing fish and threatening drinking supplies.
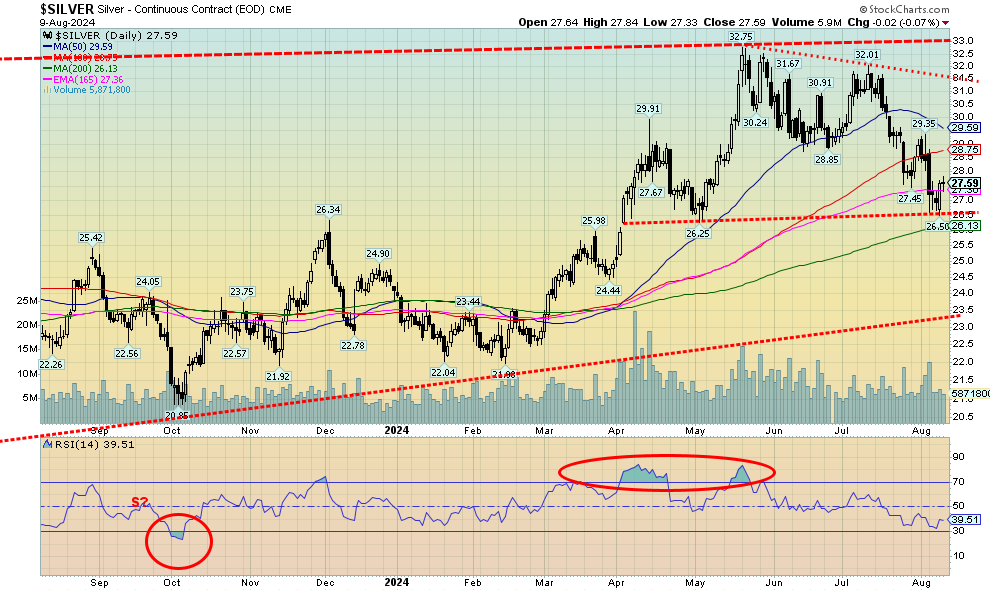
Source: www.stockcharts.com
Silver continues to underperform gold. Silver fell this past week by 2.8% but remains up 14.5% for 2024. However, gold is up 19.4% in 2024. We’re also up 32% from the October 2023 low. But gold is up almost 36% from a comparable low. Gold has made ongoing new all-time highs while silver is almost 45% under its all-time high. It all seems odd in the face of huge demand for silver and ongoing supply problems. The structural deficit has been going on for four years, yet silver remains repressed. We did find support above $26, a level we considered quite important to hold if we are to move higher. Support ranges from $26 to $26.50. The low so far is $26.50. But there is considerable to work to be done if silver is to resume a leadership role. A move first above $30 would be important, but silver needs to break above $31.30 to suggest new highs above the May high of $32.75. The gold/silver ratio remains in favour of gold, even if the ratio is overall falling, albeit slowly.
Source: www.stockcharts.com
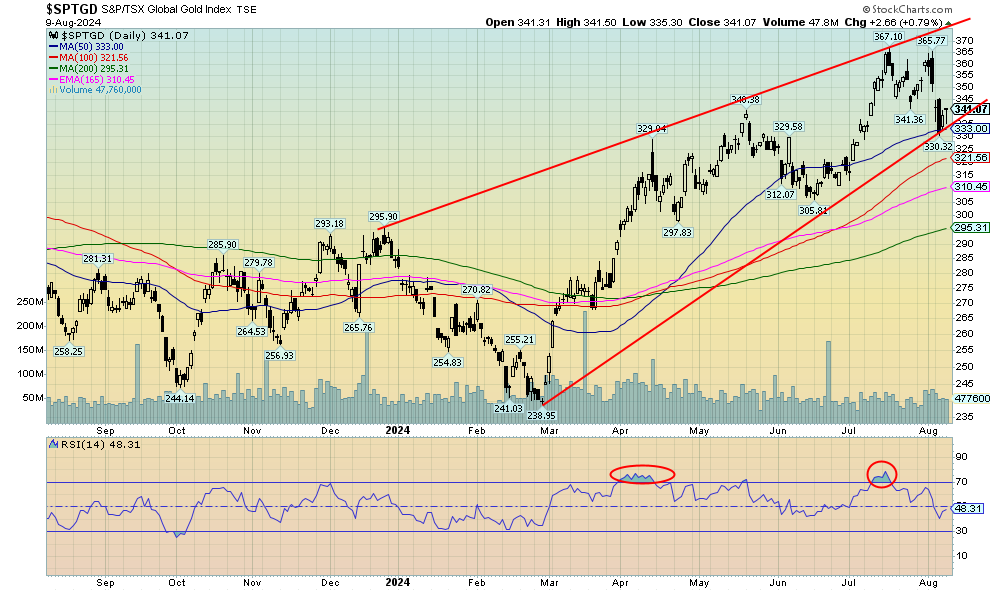
It was not an overly pleasant week for the gold stocks. With the Japanese meltdown spilling over into North America, gold stocks were hit as hard as any other stock. On the week, the TSX Gold Index (TGD) fell 3.0% while the Gold Bugs Index (HUI) dropped 2.1%. As we have often noted, when the stocks suffer a cold the gold stocks get pneumonia, even if the best-performing asset is gold itself. The drop this past week pushed the TGD down to its 50-day MA, but so far it has held. What is needed is upside follow-through this coming week. Regaining 350 would be positive, but we need to regain back above 365 to suggest new highs ahead. However, what is needed is that if any further downside develops it would be important to hold 330. A drop under that level could swiftly send us to 310 or even 300. The 200-day MA is currently at 295. So far, this has the look of a classic ABC-type correction from that July high of 367. The TGD fell just over 10% from the July high. 10%-plus corrections are not unusual for the TGD, even in a bull market. We are reminded that during the 2009–2011 bull run, the TGD had six corrections of 10% or more, including at least one where the index fell 25%. But the TGD rose over 200% from the October 2008 low to the September 2011 high. So far, the TGD is up over 50% from the February 2024 low. However, the index is still down roughly 25% from that 2011 high. That’s 13 years and counting since the last major high. We’ve often cited how cheap the gold stocks are in relation to gold. That hasn’t changed. We’ve never seen such a long period when the gold stocks have remained undervalued vis-à-vis gold itself.
Source: www.stockcharts.com
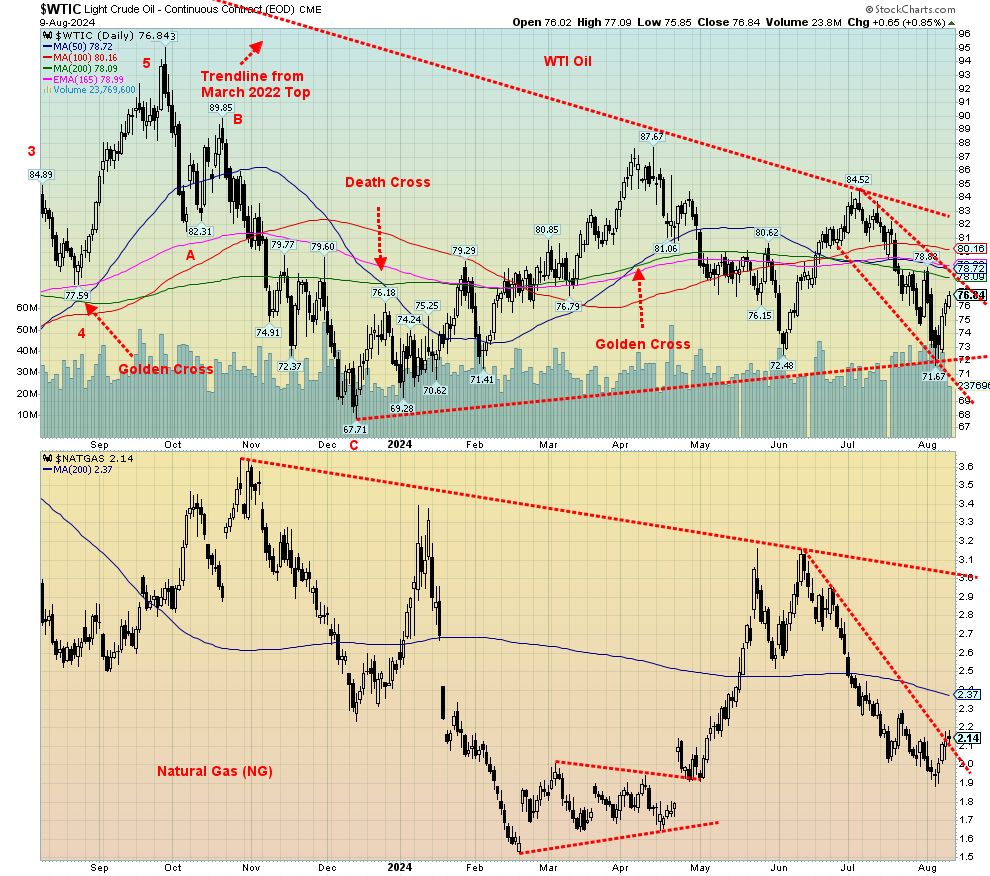
An uptick in demand optimism, coupled with potential geopolitical tensions, helped oil prices break a four-week losing streak. WTI oil gained over $3 this past week or 4.5%. Brent crude also rose up 3.7%. Not to be left out, natural gas (NG) also ended a losing streak, gaining 8.6%. NG had been falling regularly for some nine weeks. All this came about despite a further NG storage buildup. Continued heat waves helped push demand. EU NG jumped 9.3%, largely because of the Ukrainian attack into Russia’s Kursk region and the possible disruption of a key gas transit station. Russia still sends NG through Ukraine to the benefit of some central European countries. Neither side has incentive to disrupt this flow, even if they are at war. The energy stocks also followed through to the upside as the ARCA Oil & Gas Index (XOI) rose 2.2% while the TSX Energy Index (TEN) was up 3.4%.
Technically, WTI oil bounced off of a key support zone near $72. We had considered that important support and felt that a breakdown under that level could set oil prices to fall to new lows. For the moment at least, the pressure is off. WTI oil needs to regain $78 and break once again over $80. Major resistance is $82/$83. NG may have broken that steep downtrend, but it needs to regain back above $2.40 to suggest to us higher levels. Major resistance is up to $3. This past week was encouraging for the energy bulls, but follow-through is required to convince us that we are actually headed higher once again. Geopolitical concerns may play a big role.
Copyright David Chapman 2024
GLOSSARY
Trends
Daily – Short-term trend (For swing traders)
Weekly – Intermediate-term trend (For long-term trend followers)
Monthly – Long-term secular trend (For long-term trend followers)
Up – The trend is up.
Down – The trend is down
Neutral – Indicators are mostly neutral. A trend change might be in the offing.
Weak – The trend is still up or down but it is weakening. It is also a sign that the trend might change.
Topping – Indicators are suggesting that while the trend remains up there are considerable signs that suggest that the market is topping.
Bottoming – Indicators are suggesting that while the trend is down there are considerable signs that suggest that the market is bottoming.
Disclaimer
David Chapman is not a registered advisory service and is not an exempt market dealer (EMD) nor a licensed financial advisor. He does not and cannot give individualised market advice. David Chapman has worked in the financial industry for over 40 years including large financial corporations, banks, and investment dealers. The information in this newsletter is intended only for informational and educational purposes. It should not be construed as an offer, a solicitation of an offer or sale of any security. Every effort is made to provide accurate and complete information. However, we cannot guarantee that there will be no errors. We make no claims, promises or guarantees about the accuracy, completeness, or adequacy of the contents of this commentary and expressly disclaim liability for errors and omissions in the contents of this commentary. David Chapman will always use his best efforts to ensure the accuracy and timeliness of all information. The reader assumes all risk when trading in securities and David Chapman advises consulting a licensed professional financial advisor or portfolio manager such as Enriched Investing Incorporated before proceeding with any trade or idea presented in this newsletter. David Chapman may own shares in companies mentioned in this newsletter. Before making an investment, prospective investors should review each security’s offering documents which summarize the objectives, fees, expenses and associated risks. David Chapman shares his ideas and opinions for informational and educational purposes only and expects the reader to perform due diligence before considering a position in any security. That includes consulting with your own licensed professional financial advisor such as Enriched Investing Incorporated. Performance is not guaranteed, values change frequently, and past performance may not be repeated.
About the author


Website: https://www.enrichedinvesting.com
Disclaimer: David Chapman is not a registered advisory service and is not an exempt market dealer (EMD) nor a licensed financial advisor. We do not and cannot give individualised market advice. David Chapman has worked in the financial industry for over 40 years including large financial corporations, banks, and investment dealers. The information in this newsletter is intended only for informational and educational purposes. It should not be considered a solicitation of an offer or sale of any security. The reader assumes all risk when trading in securities and David Chapman advises consulting a licensed professional financial advisor before proceeding with any trade or idea presented in this newsletter. David Chapman may own shares in companies mentioned in this newsletter. We share our ideas and opinions for informational and educational purposes only and expect the reader to perform due diligence before considering a position in any security. That includes consulting with your own licensed professional financial advisor.