
“Everything has its limit—iron ore cannot be educated into gold.”
—Mark Twain, pen name of Samuel Langhorne Clemons, American writer, humourist, entrepreneur, publisher, lecturer, key novels The Adventures of Tom Sawyer (1876), Adventures of Huckleberry Finn (1884); 1835–1910
“The gold standard did not collapse. Governments abolished it in order to pave the way for inflation. The whole grim apparatus of oppression and coercion, policemen, customs guards, penal courts, prisons, in some countries even executioners, had to be put into action in order to destroy the gold standard.”
—Ludwig Von Mises, Austrian School economist, historian, logician, sociologist, lecturer on classical liberalism; 1881–1973
“At the end fiat money returns to its inner value—zero.”
—Voltaire, nom-de-plume of Francois-Marie Arouet, French enlightment writer, historian, philosopher, famous for wit and criticism of Christianity, writer of over 20,000 letters and 2000 books and pamphlets, magnus opus Candide (1759); 1694–1778
Things are not looking up. Inflation is raging, thanks to the war in Ukraine and sanctions on Russia. Central banks in the West are hiking interest rates: the Bank of Canada (BofC), the Federal Reserve (Fed), the European Central Bank (ECB), and the Bank of England (BOE). The only exception is the Bank of Japan (BOJ) where they seem content to keep a lid on the key bank rate, thanks mostly to low inflation, last at 2.6% vs. 7.6% in Canada, 8.5% in the U.S., 9.1% in the eurozone, and 10.1% in the U.K. The result is that interest rates are going higher. The BofC is in front, hiking the key bank rate to 3.25%. The Fed is at 2.25%, but is highly expected to hike its rate to 3.00% at the September 21 FOMC. The ECB quickly followed the BofC and hiked 75 bp as well to 1.25% from 0.50%, the highest level since 2008. The BOE, currently at 1.75%, is also expected to hike its rate. No matter what they do, interest rates remain well below the rate of inflation. In 1981, former Fed Chair Paul Volcker hiked rates above the rate of inflation to bring down inflation. It worked. It also sparked a steep recession; the proverbial hard landing. Soft landings are a central bank’s dream.
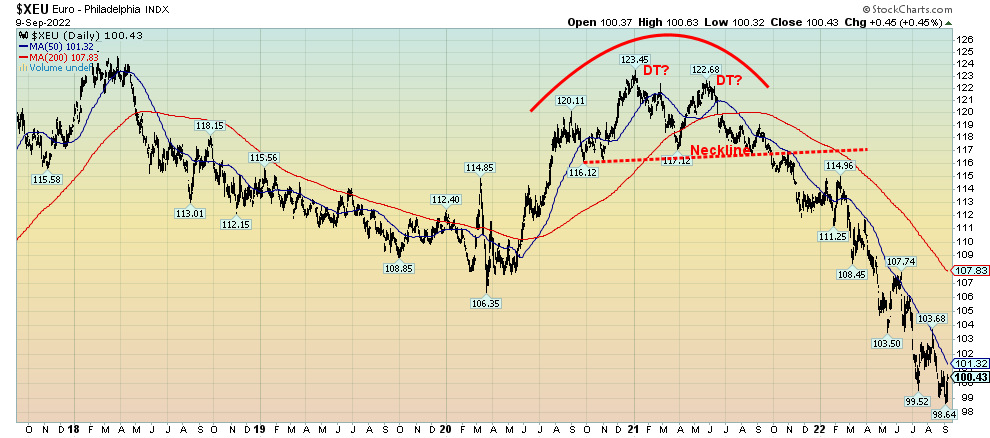
The ECB is facing an impossible situation. The eurozone has higher inflation, a plunging euro (now under par and down 19% since a peak in May 2021), an energy crisis that is not going away, and the odds of a recession or worse rising rapidly if they are already not in one. Inflation is being driven by the energy crisis as Russia cuts off the zone from Russian natural gas (NG) and oil. EU NG at the Dutch Hub has surged 160% since May. Numerous eurozone industries are highly dependent on Russian gas and are being forced to cut production. The eurozone is being forced to find new supplies on the fly. Meanwhile, EU governments are providing multiple billion-dollar bail-out packages for business and consumers to prevent closures and bankruptcies. Support for the war in Ukraine is wavering.
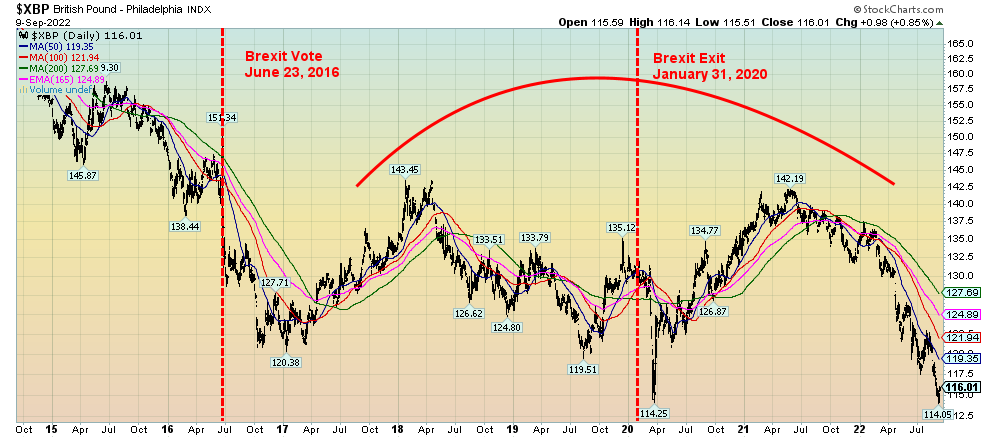
The U.K.’s problems loom even larger as the U.K. is most likely already in a recession and consumers and business are facing daunting energy bills. The new prime minister is also facing strikes, a crumbling infrastructure, and public services under strain. The U.K.’s inflation rate is also the highest in the G7 (with Germany at 7.9%, France at 5.8%, and Italy at 8.4%). The U.K. pound sterling has fallen sharply since Brexit occurred on January 31, 2020. Things could be worse. All of this is against the backdrop of the death of Queen Elizabeth II sending the nation in national mourning. If the euro and the pound are having a tough time the Japanese yen is worse. The yen has fallen 30% from a peak in early 2021. While the eurozone and the U.K. may try, they can’t bail out everybody. It could be a nasty winter.
Things could be worse. Pakistan is buried in water as at least a third of the country has become a huge lake. Between 30–50 million people are at risk and millions of homes have been washed out. That’s upwards of a quarter of the population. Disease and a looming humanitarian crisis are likely to follow. Taken together, including the problems in the eurozone and the U.K, the problems in the U.S. and Canada seem puny and manageable by comparison.
The rally that began in June 2022 ran into a wall in August. Funny how that works. The S&P 500, the Dow Jones Industrials (DJI), and the NASDAQ all hit the wall at or near the 200-day MA. Now all three have fallen 10–13% from the high and are once again trading under the 50-day MA. It could be worse. The tech stocks, represented by the NY FANG Index, are down about 14% from their recent high and Bitcoin, the granddaddy of the cryptos, is down 20% from its recent high. If anyone thought that cryptos were the answer to high inflation and a hedge against the market, they ought to think again. Bitcoin is down almost 60% in 2022, and over 70% from its November 2021 all-time high. As well, the market cap of all cryptos has fallen under $1 trillion after peaking at $2.8 trillion, also in November 2021. Fortunes have already been wiped out.
The Sinking Pound Sterling
Source: www.stockcharts.com
The Sinking Euro
Source: www.stockcharts.com
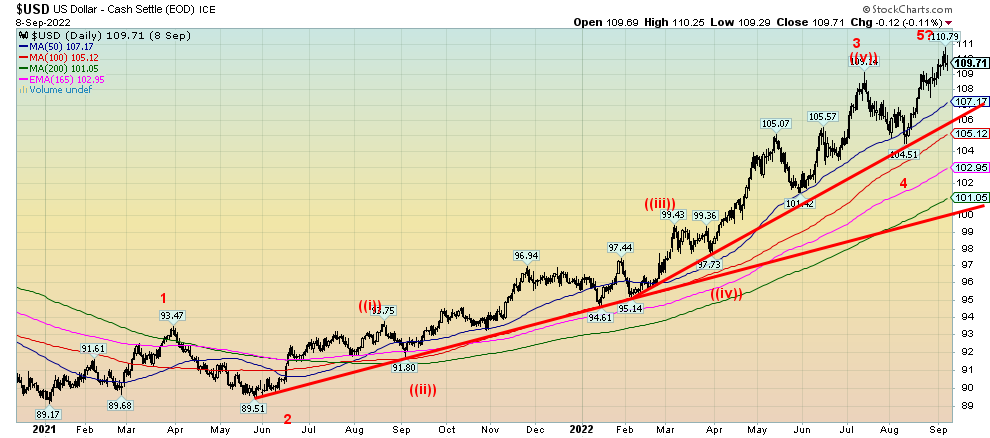
The Soaring US$ Index
Source: www.stockcharts.com
The U.S. dollar is the world’s reserve currency. A soaring U.S. dollar may be good for the U.S. (but not its exports) but it is potential nightmare for everyone else. A tightening Fed means all central banks have to follow or their currency could sink into oblivion (see the Japanese yen). Issuance of U.S. dollar-denominated debt by sovereign countries and foreign corporations is estimated at over $12 trillion. The actual number is probably a lot higher. Some 70% of Emerging Market (EM) sovereign debt is denominated in U.S. dollars. Much of this debt is at risk. All these debts become a bigger burden because of a rising U.S. dollar and interest rates.
Countries like Pakistan, Sri Lanka, Ukraine, Argentina, and more are most likely on the cusp of sovereign debt default. Corporations too, especially in China and other parts of Asia, are heavily weighed down by U.S. dollar debt while their revenue sources are in the currency of their home country. A rising U.S. dollar is also bad for U.S. exports, even as the U.S. trade deficit has narrowed in recent months. With the U.S. hiking interest rates sharply, much of this debt, especially floating rate debt, becomes more expensive. It also engenders capital flight from EMs to the U.S., thus depreciating their currencies further and pushing the value of the U.S. dollar higher.
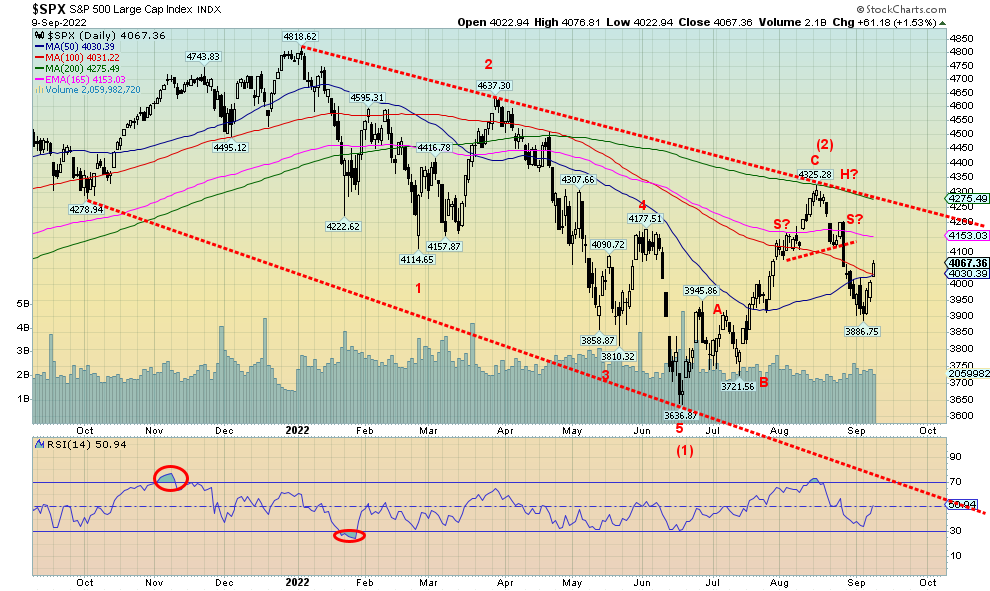
The S&P 500 is headed lower
Source: www.stockcharts.com
The S&P 500 has broken down from what appears as a small head and shoulders top pattern. Mostly it hit its small objective near the low of 3,887. But a break of that level could lead to a decline to the next target at 3,700. Below that level new lows are probable. Notice how the S&P 500 failed at the 200-day MA just as it did back in March (or just above that level). We are also making lower highs and lower lows, the classic definition of a downtrend. We have broken under the 50-day MA once again, which signals to us that we are most likely headed lower.
Since the end of the gold standard in August 1971, gold has multiplied almost 4,200%. In the same timeframe, the CPI is up 626%. Before that and dating from the birth of the Federal Reserve in 1913, gold rose only 110% as it was primarily fixed in price, first at US$20.67 and then at US$35. The CPI rose 311% during the same period. For the record, the DJI was up almost 1,000% from 1913 to August 1971 and since then the DJI is up roughly 3,400%. All of these are nominal gains, not inflation-adjusted gains. The gold standard came to an end as the U.S. was rapidly losing its gold reserves that had fallen from over 20,000 metric tonnes in 1950 to just over 8,000 metric tonnes in 1971. The U.S. became concerned about losing all of its gold as U.S. dollars were convertible at a rate of $35/ounce. Demands were being placed on the U.S. to convert dollars to gold from other central banks due to the huge amounts of U.S. dollars sloshing around the world as a result of the Vietnam War and prior to the Marshal Plan. As well, central banks wanted to free up the banking system to create more dollars and, by extension, more inflation.
Gold and CPI Rising Together
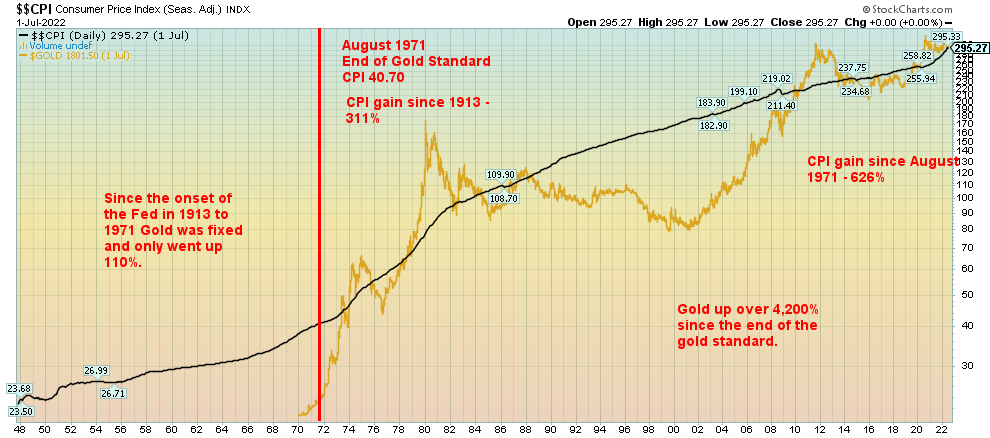
Source: www.stockcharts.com
Today, gold languishes, spooked by a higher U.S. dollar and rising interest rates. A breakdown under $1,675 could spark a sharp sell-off for gold, not dissimilar to what happened in 2013. Potential targets could be as low as $1,250, based on the possible double top in August 2020 and March 2022. Triple bottoms are rare.
However, there are two camps out there predicting that gold will soon soar to new all-time highs—or that gold could break down in a momentous wash-out. Which one will it be?
Gold has been struggling. But sentiment is low and the commercial COT is at its best level since 2018/2019, before a sharp upward movement that eventually took gold to that double top in August 2020 near $2,090 and then again in March 2022 near $2,080. But unless a rally can successfully take us through $1,900 and then $2,000, the odds would then shift once again to the downside. First things first. Gold must successfully break out over $1,740/$1780/$1820 to confirm a low.
Whither Gold? Up or Down?
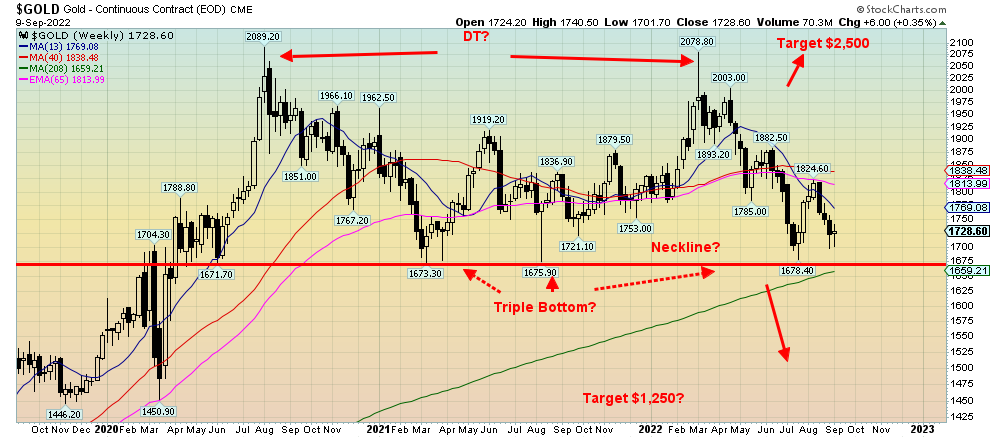
Source: www.stockcharts.com
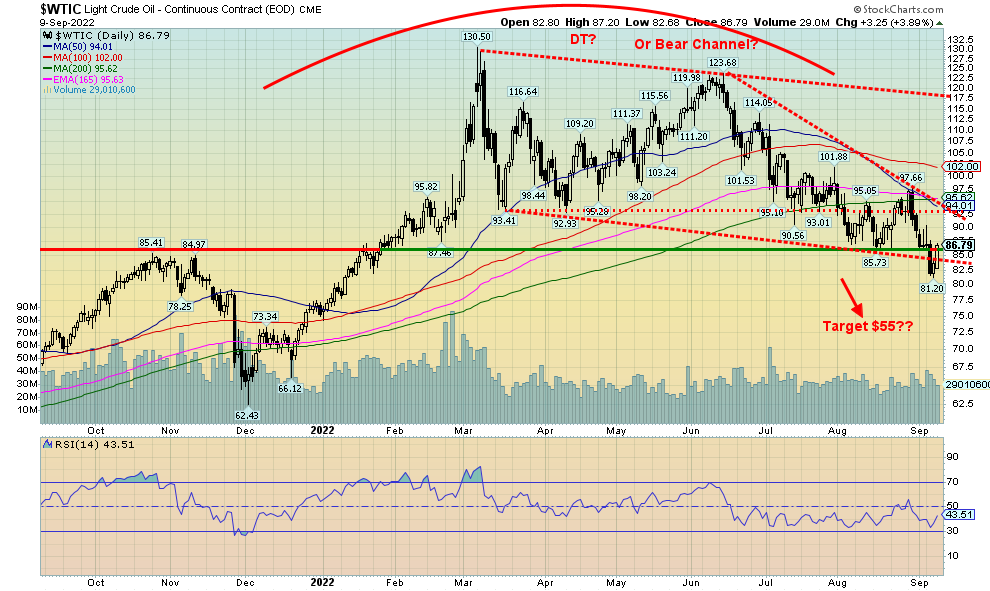
Have oil prices broken down? We have mused about this in the past. The musing was about whether oil prices had put in a double top at $130.50 in March and $123.68 in June. The breakdown was around $93. However, oil broke under that level and went marginally lower, appearing instead to be forming a bear channel. But now WTI oil has broken under $85 and appears to be breaking the bear channel. It raises the specter of a larger drop. Initial targets could be $75, but ultimate targets could be down to $55. The collapse in oil prices is being driven primarily by demand destruction as the world slides into recession. China, in particular because of its lockdowns, is clearly slowing, putting their shadow banking system and real estate sector on notice of a collapse.
Oil prices are also falling because of caps being put on Russian oil as well, and the same could be coming for natural gas. But the Saudis and OPEC have announced a 100,000 barrels/day cut in production, and ultimately Russia could counter price caps by cutting back on their production as well. Russia has already announced that
the Nord Stream 1 to the EU is being shut down, putting the EU on notice that they will no longer receive natural gas (NG). Russia could also cut back on oil shipments in retaliation for sanctions and price caps. The physical war is between Russia and the Ukraine, but the economic war is between Russia and the West (EU, U.S.). The West is paying dearly for its economic war with Russia which acts as a proxy for a real war.
We are now living in a unique period where markets play out as they did in the past. Today’s bubbles—stocks, bonds, memes, cryptos, NFTs, SPACs, and housing—are similar to other bubbles in history. But now the bubbles have burst. A war, sanctions, rising inflation, rising interest rates, and a pandemic have all conspired to bring things back to earth. And, lest we forget, commodities and oil have also gone up, primarily because of war and sanctions along with supply disruptions. What are seeing right now is the corrective phase of the commodity boom. It seems everyone has seen their bubble phase. Was gold also in a bubble when it peaked twice near $2,090? Well, maybe a mini-one, but the real bubble for gold will come when confidence in governments breaks down. And that could come sooner than we think.
Oil headed lower? Or will this fizzle out?
Source: www.stockcharts.com
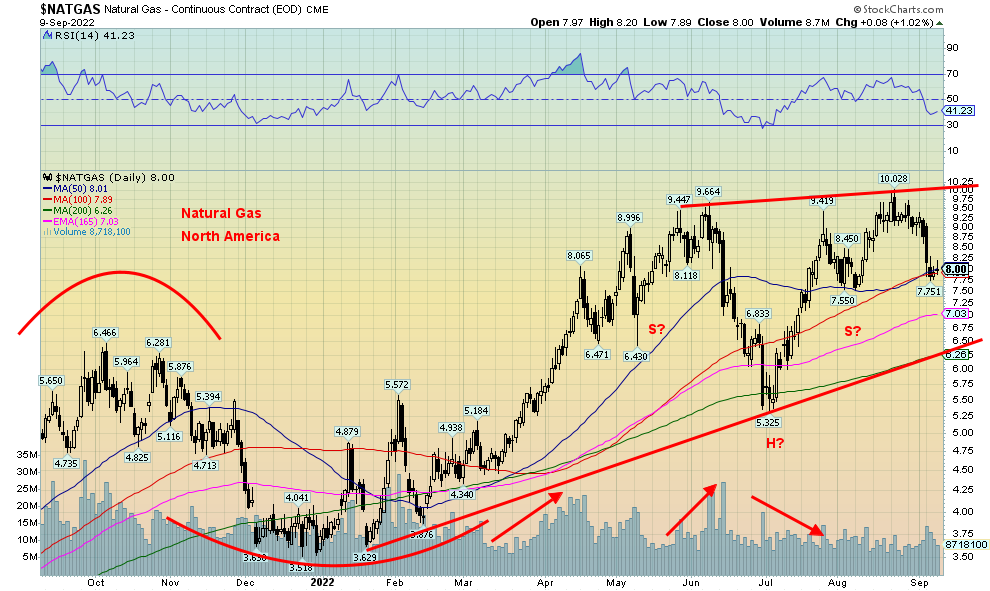
Natural Gas still looks quite bullish! Is that a Head & Shoulders Bottom Forming?
Source: www.stockcharts.com
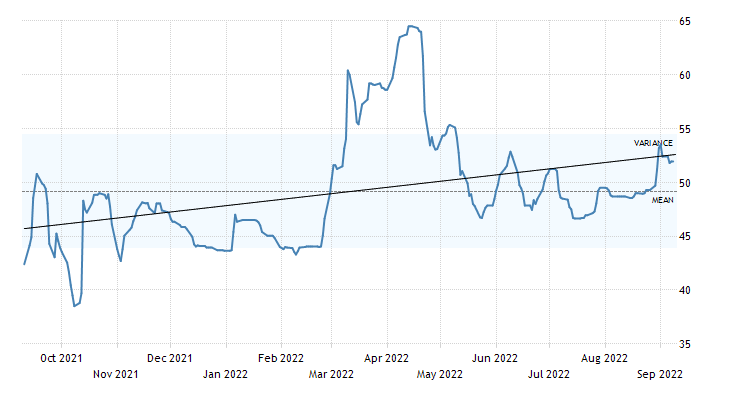
We shouldn’t leave without noting uranium prices. Uranium prices have been on the rise up 22.5% over the past year. With energy supplies uncertain the larger economies – Germany, France, Japan etc. are ramping up alternative energy sources. Nuclear plants are suddenly in vogue again after years of shunning nuclear energy as a result of the Fukushima Plant meltdown in 2010 in Japan. The result of that was that nuclear plants were shuttered and no new ones were built. That’s all changed. It’s an historical pivot for sure. With uranium at roughly $52/pound it remains well below the $140/pound that was seen in 2007 at the height of the previous commodity boom. We may be only part way there. There is a need for uranium for enrichment. No surprise that uranium stocks have been doing well.
In 2021 45% of uranium supplies came from Kazakhstan who to no surprise remains friendly with Russia. Next is Namibia with 12%, then Canada with 10%. Rounding out the top ten producers is Australia, Uzbekistan, Russia, Niger, China, India and Ukraine. Ukraine has been heavily dependent on nuclear power but they hold only 2% of global reserves. Russia holds 8% ranked #4 in the world. Besides Russia the other four countries to round out the top 5 reserves are Australia, Kazakhstan, Canada, and, Namibia.
Uranium Prices are on the Rise
Source: www.tradingeconomics.com
We outlined in our August 29, 2022 issue of The Scoop how bear markets unfold. An A wave down signals the start of a bear market, a B wave up is the sucker’s rally where everyone thinks the bear is over, and the C wave is the most devastating one that wipes everyone out. We believe we are now in the early stages of the C wave down. Will it be historic like 1929–1932, 1937–1938, 1973–1974, 2000–2002, and 2007–2009, or the Tokyo Nikkei Dow (TKN) of 1990? Or will it fizzle out? Each one is similar but each one is different. How governments respond is unpredictable. Central banks are independent of governments and it is their job to quell inflation. But in doing so they could spark a recession. Central banks can’t deal with bubbles bursting, or war and sanctions. However, they do stand by to provide liquidity to markets in order to prevent a collapse. But, as we saw in 2020, 2008, 2002, 1998, and 1987, the liquidity crisis came after the crash. Each crash required more and more liquidity just to stand still. Do they have the wherewithal to deal with another crash that could threaten the global banking system? So far, the banks are holding up because they are better capitalized following the 2008 meltdown. But are the bullets running out?
We’ll see.
Copyright David Chapman, 2022
Markets & Trends
|
|
|
|
% Gains (Losses) Trends
|
|
||||
|
|
Close Dec 31/21 |
Close Sep 9/22 |
Week |
YTD |
Daily (Short Term) |
Weekly (Intermediate) |
Monthly (Long Term) |
|
|
Stock Market Indices |
|
|
|
|
|
|
|
|
|
`S&P 500 |
4,766.18 |
4,067.36 |
3.7% |
(14.7)% |
neutral |
down |
up (weak) |
|
|
Dow Jones Industrials |
36,333.30 |
32,151.71 |
2.7% |
(11.5)% |
down (weak) |
down |
neutral |
|
|
Dow Jones Transports |
16,478.26 |
14,060.90 |
2.4% |
(14.7)% |
down (weak) |
down |
up (weak) |
|
|
NASDAQ |
15,644.97 |
12,112.31 |
6.6% |
(22.6)% |
down (weak) |
down |
neutral |
|
|
S&P/TSX Composite |
21,222.84 |
19,773.34 |
2.6% |
(6.8)% |
up (weak) |
down |
up (weak) |
|
|
S&P/TSX Venture (CDNX) |
939.18 |
645.57 |
2.1% |
(31.3)% |
neutral |
down |
down (weak) |
|
|
S&P 600 |
1,401.71 |
1,193.69 |
2.7% |
(14.8)% |
down |
down |
neutral |
|
|
MSCI World Index |
2,354.17 |
1,843.21 |
0.7% |
(21.7)% |
down |
down |
down |
|
|
NYSE Bitcoin Index |
47,907.71 |
20,363.38 |
(4.4)% |
(57.5)% |
down |
down |
down (weak) |
|
|
|
|
|
|
|
|
|
|
|
|
Gold Mining Stock Indices |
|
|
|
|
|
|
|
|
|
Gold Bugs Index (HUI) |
258.87 |
198.83 |
6.2% |
(23.2)% |
down |
down |
down |
|
|
TSX Gold Index (TGD) |
292.16 |
235.40 |
4.4% |
(19.4)% |
down (weak) |
down |
down |
|
|
|
|
|
|
|
|
|
|
|
|
% |
|
|
|
|
|
|
|
|
|
U.S. 10-Year Treasury Bond yield |
1.52% |
3.32% |
4.1% |
118.4% |
|
|
|
|
|
Cdn. 10-Year Bond CGB yield |
1.43% |
3.13% |
1.0% |
118.9% |
|
|
|
|
|
Recession Watch Spreads |
|
|
|
|
|
|
|
|
|
U.S. 2-year 10-year Treasury spread |
0.79% |
(0.24)% |
(14.3)% |
(130.4)% |
|
|
|
|
|
Cdn 2-year 10-year CGB spread |
0.48% |
(0.31)% |
35.4% |
(164.6)% |
|
|
|
|
|
|
|
|
|
|
|
|
|
|
|
Currencies |
|
|
|
|
|
|
|
|
|
US$ Index |
95.59 |
109.51 (new highs) |
0.7% |
14.6% |
up |
up |
up |
|
|
Canadian $ |
.7905 |
.7673 |
0.8% |
(2.9)% |
down |
down |
down (weak) |
|
|
Euro |
113.74 |
100.45 |
0.9% |
(11.7)% |
down |
down |
down |
|
|
Swiss Franc |
109.77 |
104.11 |
2.2% |
(5.2)% |
neutral |
down |
down (weak) |
|
|
British Pound |
135.45 |
115.93 (new lows) |
0.7% |
(14.4)% |
down |
down |
down |
|
|
Japanese Yen |
86.85 |
70.09 (new lows) |
(1.7)% |
(19.3)% |
down |
down |
down |
|
|
|
|
|
|
|
|
|
|
|
|
|
|
|
|
|
|
|
|
|
|
Precious Metals |
|
|
|
|
|
|
|
|
|
Gold |
1,828.60 |
1,728.60 |
0.4% |
(5.5)% |
down |
down |
neutral |
|
|
Silver |
23.35 |
18.77 |
5.0% |
(19.6)% |
down (weak) |
down |
down |
|
|
Platinum |
966.20 |
876.90 |
7.2% |
(9.2)% |
neutral |
down |
down |
|
|
|
|
|
|
|
|
|
|
|
|
Base Metals |
|
|
|
|
|
|
|
|
|
Palladium |
1,912.10 |
2,177.60 |
7.5% |
13.9% |
up |
neutral |
down (weak) |
|
|
Copper |
4.46 |
3.57 |
4.7% |
(20.0)% |
up (weak) |
down |
neutral |
|
|
|
|
|
|
|
|
|
|
|
|
Energy |
|
|
|
|
|
|
|
|
|
WTI Oil |
75.21 |
86.79 |
(0.1)% |
15.4% |
down |
down (weak) |
up |
|
|
Nat Gas |
3.73 |
8.00 |
(9.0)% |
114.5% |
down |
up |
up |
|
Source: www.stockcharts.com
Note: For an explanation of the trends, see the glossary at the end of this article.
New highs/lows refer to new 52-week highs/lows and, in some cases, all-time highs.
|
GLOSSARY Trends Daily – Short-term trend (For swing traders) Weekly – Intermediate-term trend (For long-term trend followers) Monthly – Long-term secular trend (For long-term trend followers) Up – The trend is up. Down – The trend is down Neutral – Indicators are mostly neutral. A trend change might be in the offing. Weak – The trend is still up or down but it is weakening. It is also a sign that the trend might change. Topping – Indicators are suggesting that while the trend remains up there are considerable signs that suggest that the market is topping. Bottoming – Indicators are suggesting that while the trend is down there are considerable signs that suggest that the market is bottoming. |
Disclaimer
David Chapman is not a registered advisory service and is not an exempt market dealer (EMD) nor a licensed financial advisor. He does not and cannot give individualised market advice. David Chapman has worked in the financial industry for over 40 years including large financial corporations, banks, and investment dealers. The information in this newsletter is intended only for informational and educational purposes. It should not be construed as an offer, a solicitation of an offer or sale of any security. Every effort is made to provide accurate and complete information. However, we cannot guarantee that there will be no errors. We make no claims, promises or guarantees about the accuracy, completeness, or adequacy of the contents of this commentary and expressly disclaim liability for errors and omissions in the contents of this commentary. David Chapman will always use his best efforts to ensure the accuracy and timeliness of all information. The reader assumes all risk when trading in securities and David Chapman advises consulting a licensed professional financial advisor or portfolio manager such as Enriched Investing Incorporated before proceeding with any trade or idea presented in this newsletter. David Chapman may own shares in companies mentioned in this newsletter. Before making an investment, prospective investors should review each security’s offering documents which summarize the objectives, fees, expenses and associated risks. David Chapman shares his ideas and opinions for informational and educational purposes only and expects the reader to perform due diligence before considering a position in any security. That includes consulting with your own licensed professional financial advisor such as Enriched Investing Incorporated. Performance is not guaranteed, values change frequently, and past performance may not be repeated.
About the author


Website: https://www.enrichedinvesting.com
Disclaimer: David Chapman is not a registered advisory service and is not an exempt market dealer (EMD) nor a licensed financial advisor. We do not and cannot give individualised market advice. David Chapman has worked in the financial industry for over 40 years including large financial corporations, banks, and investment dealers. The information in this newsletter is intended only for informational and educational purposes. It should not be considered a solicitation of an offer or sale of any security. The reader assumes all risk when trading in securities and David Chapman advises consulting a licensed professional financial advisor before proceeding with any trade or idea presented in this newsletter. David Chapman may own shares in companies mentioned in this newsletter. We share our ideas and opinions for informational and educational purposes only and expect the reader to perform due diligence before considering a position in any security. That includes consulting with your own licensed professional financial advisor.