
The year is winding down. It has been a most interesting one. What will 2026 bring us? 2025 was a year of chaos. Except in markets that mostly just kept going higher. The record-setting year was mostly led by the MAG7 +, as 10 stocks make up 40% of the S&P 500. The metals soared as well, with both gold and silver surpassing the highs of 1980 and 2011. The gold stocks followed. Chaos is music to the ears of gold and silver. For example, with an increased realized gold price, Lundin Gold Inc. reported expanded revenues, higher net income, and greater free cash flow, pays a dividend, and is held in the Enriched Capital Conservative Growth Strategy.*
This is the final issue of the year (maybe), our forecast 2for 026. 2025 was a year of chaos. Expect more chaos. The current incumbent in the White House is helping to bring it to all of us. As we wind down the record-setting year, the wars are still with us. They could even threaten to expand. But the MAG7+ are showing signs of exhaustion and appear to be rolling over. Will 2026 bring us a down year? The vulnerabilities are there. Debt, sticky inflation, and an overvalued market. We are in a period where cycles are pointed down for the next few years, possibly into the 2030s. Unless we get a serious black swan event, i.e., the wars spread, a significant sovereign default, a banking and debt crisis, maybe we'll just muddle along. That would be the best. The biggest fear is a crash. As we say, what goes up comes down even faster. It's the law of physics according to Newton. Muddling along? A plane landing, a building being demolished, a grinding bear market.
All periods of huge wealth inequality have, in the past, ended badly. Today, we have one of the most unequal economies in modern history. One man alone is worth more than all but 21 global economies. Is that normal? The top 10% own 70% of the wealth. The bottom 50% have 2-3%. In more modern times, wealth concentration today is on the scale of the Gilded Age and the Roaring Twenties. Both ended in economic depressions and global wars. The end of one period of massive inequality saw some of the elite lose their heads. A roaring stock market fuels inequality.
We bring this week a look at how 2026 might unfold. What are the risks? Identifying the risks helps one prepare for how to manage them. We even have a chart of the week. The stock markets may have been making all-time highs in 2025, but in terms of money supply, the current market lags the 1999/2000 dot.com high.
This week brings us (hopefully) the October and November jobs reports. If it comes out as expected, we'll provide a short update/analysis. This past week brought us interest rate decisions. Canada stood pat, the U.S. cut 25 bp as expected.
Otherwise, have a great holiday season and New Year's, and we'll be back January 5, 2026.
DC
* Reference to the Enriched Capital Conservative Growth Strategy and its investments, celebrating a 7 ½ -year history of strong growth, is added by Margaret Samuel, President, CEO, and Portfolio Manager of Enriched Investing Incorporated, who can be reached at 416-203-3028 or msamuel@enrichedinvesting.com
“The most reliable way to forecast the future is to try to understand the present.”
—John Naisbitt, American author, public speaker, academic at Harvard U, Cornell U, specialized in futures studies, author of Megatrends: Ten New Directions Transforming our Lives (1982); 1929–2021
“No one can escape the iron rule that once you make a forecast, you know you're going to be wrong; you just don't know when and in which direction!”
—Edgar Fiedler, American economist, served as Assistant Secretary of the Treasury for Economic Policy (1971–1975), member of the Conference Board, Professor at the Columbia Graduate School of Business, 1929–2003
“All economic forecasts are subject to considerable uncertainty. There is always a wide range of plausible outcomes for important economic variables, including the federal funds rate.”
—Jerome Powell, American investment banker, lawyer, 16th Chairman of the Federal Reserve, 2018–present, former partner of the Carlyle Group; b. 1953
Forecast 2025
Stocks
Last year at this time, we mused that the technology boom of AI, 5G, electric vehicles, wearable technology, cloud computing, and more could help the stock market continue its winning ways, and there could even be a melt-up. We can’t say we have been disappointed. The S&P 500 is on target for a gain of about 17%. That’s decent, but not a melt-up. Is that to come? After all, the Fed is cutting interest rates, money supply (M1) is growing again, and the Fed’s balance sheet is leveling out as it pulls out of quantitative tightening (QT). All that is music to the ears of the stock market.
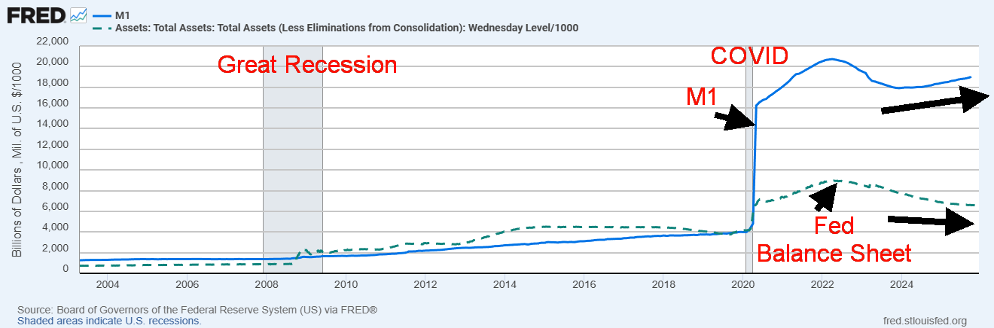
Source: www.stlouisfed.org
If the stock market is going up, then all must be good. ^NOT. It has been a chaotic year, thanks to the presidency of Donald Trump, who says one thing one moment and then changes his tune – like 50% tariffs on everyone, but then maybe not.
Instead, it makes for chaos. But does the stock market care? Apparently not. Inequality in the U.S., which was always wide, has widened even more since the onset of COVID. It is estimated today that 0.1% hold 13.8% of all wealth. The top 10% hold 67.2% of all wealth in the U.S. The bottom 50%? Meh. They hold 2.5% of the wealth. And who invests in the stock market? The 10%. The middle, representing 40% of the population, holds 30.3% of the wealth. Through 401Ks (RRSPs, TFSAs in Canada), they also have holdings in the stock market (source: www.statista.com).
What’s different today is that household debt was low during the 1920s boom, but today it is at record heights. There was minimal, if any, social safety net during the 1920’s and employment protection was low to nil. But essentials were low then.
The gap between the richest and poorest has never been wider in the U.S. One man, Elon Musk (Tesla, SpaceX), has a net worth of $491 billion (www.forbes.com), effectively making him the size of Sweden, the world’s 21st largest economy. Others surpassing the $200 billion net worth mark include Larry Page (Google), Jeff Bezos (Amazon), Larry Ellison (Oracle), Sergey Brin (Google), and Mark Zuckerberg (Meta). Note that of the six, five are heads of MAG7 companies. Steve Ballmer (Microsoft), Bill Gates (Microsoft), and Jensen Huang (Nvidia) are worth well over $100 billion. The final MAG7 stock is Apple, headed by Tim Cook. By comparison, Cook is a poor man ($2.6 billion). The MAG7 represents 35% of the S&P 500. In 2015, it was only 12%.
Extremes for the ultra-wealthy continue, with a prime example being the Halloween party of Donald Trump that was worthy of The Great Gatsby (1920s). Rather than all of this being a source of strength, it is a sign of potential vulnerability. If the MAG7 falters, the entire stock market will falter as well. The following chart suggests that the MAG7 is faltering. Amazon is barely up on the year at 2.2%. The gap between Google, which has the best return at 60.8%, vs. the number 2 performer Nvidia, up 28.1%, is considerable, suggesting that the MAG7 could be rolling over. We have no confirmation of a breakdown, but the signs are not positive.
SPDR S&P 500 plus MAG7 Performance 2025
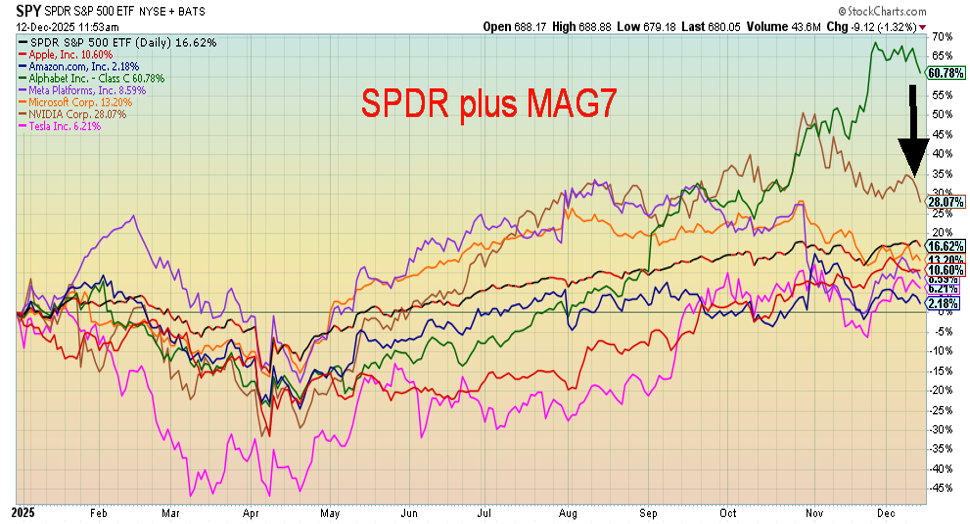
Source: www.stockcharts.com
The only blemish on the year was the swift 21.3% decline of the S&P 500 in April 2025, following Trump’s “Liberation Day” tariffs. That was barely into an official bear market. When some of the tariffs started to be unwound, or they backed off, markets recovered. After that, it has been straight up, at least until October when a consolidation got underway. Will the consolidation break out to new highs? Or will it falter and break down? The Dow Jones Industrials (DJI) made new all-time highs. But, so far, the S&P 500 and the NASDAQ have not, a divergence. So far, markets appear to be faltering. Will Santa come to town? Or if Santa should fail to call, the bears may come to Broad and Wall.
Normally, we’d look at 2026 and note that on balance it could be an up year, maybe. After all, according to the decennial cycle, years ending in 6 have been up 11 times since 1836 and down 8 times. 2026 is also the second year of the presidential cycle. Of the four-year presidential cycle, the first two years are normally the weakest. 2025 has not exactly been weak, but it hasn’t been gangbusters, either. The record of years ending in 5 shows that, including 2025, it has been up 16 times since 1835 and down only four times. It is the best year of the decennial cycle, which includes 1915 when the DJI was up an astounding 81.7%, the best year ever.
10-Year Stock Market Cycle
Annual % Change in the Dow Jones Industrials Average*
Year of Decade
|
Decades |
1st |
2nd |
3rd |
4th |
5th |
6th |
7th |
8th |
9th |
10th |
|
1831–40 |
|
|
-0.9 |
13.0 |
3.1 |
-11.7 |
-11.5 |
1.6 |
-12.3 |
5.5 |
|
1841–50 |
-13.3 |
-18.1 |
45.0 |
15.5 |
8.1 |
-14.5 |
1.2 |
-3.6 |
flat |
18.7 |
|
1851–60 |
-3.2 |
19.6 |
-12.7 |
-30.2 |
1.5 |
4.4 |
-31.0 |
14.3 |
-10.7 |
14.0 |
|
1861–70 |
-1.8 |
55.4 |
38.0 |
6.4 |
-8.5 |
3.6 |
1.6 |
10.8 |
1.7 |
5.6 |
|
1871–80 |
7.3 |
6.8 |
-12.7 |
2.8 |
-4.1 |
-17.9 |
-9.4 |
6.1 |
43.0 |
18.7 |
|
1881–90 |
3.0 |
-2.9 |
-6.5 |
-18.8 |
20.1 |
12.4 |
-8.4 |
4.8 |
5.5 |
-14.1 |
|
1891–00 |
17.6 |
-6.6 |
-24.6 |
-0.6 |
2.3 |
-1.7 |
21.3 |
22.5 |
9.2 |
7.0 |
|
1901–10 |
-8.7 |
-0.4 |
-23.6 |
41.7 |
38.2 |
-1.9 |
-37.7 |
46.6 |
15.0 |
-17.9 |
|
1911–20 |
0.4 |
7.6 |
-10.3 |
-5.4 |
81.7 |
-4.2 |
-21.7 |
10.5 |
30.5 |
-32.9 |
|
1921–30 |
12.7 |
21.7 |
-3.3 |
26.2 |
30.0 |
0.3 |
28.8 |
48.2 |
-17.2 |
-33.8 |
|
1931–40 |
-52.7 |
-23.1 |
66.7 |
4.1 |
38.5 |
24.8 |
-32.8 |
28.1 |
-2.9 |
-12.7 |
|
1941–50 |
-15.4 |
7.6 |
13.8 |
12.1 |
26.6 |
-8.1 |
2.2 |
-2.1 |
12.9 |
17.6 |
|
1951–60 |
14.4 |
8.4 |
-3.8 |
44.0 |
20.8 |
2.3 |
-12.8 |
34.0 |
16.4 |
-9.3 |
|
1961–70 |
18.7 |
-10.8 |
17.0 |
14.6 |
10.9 |
-18.9 |
15.2 |
4.3 |
-15.2 |
4.8 |
|
1971–80 |
6.1 |
14.6 |
-16.6 |
-27.6 |
38.3 |
17.9 |
-17.3 |
-3.1 |
4.2 |
14.9 |
|
1981–90 |
-9.2 |
19.6 |
20.3 |
-3.7 |
27.7 |
22.6 |
2.3 |
11.8 |
27.0 |
-4.3 |
|
1991–00 |
20.3 |
4.2 |
13.7 |
2.1 |
33.5 |
26.0 |
22.6 |
16.1 |
25.2 |
-6.2 |
|
2001–10 |
-7.1 |
-16.8 |
25.3 |
3.1 |
-0.6 |
16.3 |
6.4 |
-33.8 |
18.8 |
11.0 |
|
2011–20 |
5.5 |
7.3 |
26.5 |
7.5 |
-2.2 |
13.4 |
25.1 |
-5.6 |
22.3 |
7.2 |
|
2021–30 |
18.7 |
-8.8 |
13.7 |
12.9 |
13.9* |
|
|
|
|
|
|
|
11 up 8 dn |
11 up 8 dn |
10 up 10 dn |
14 up 6 dn |
16 up 4 dn |
11 up 8 dn |
10 up 9 dn |
14 up 5 dn |
13 up 5 dn 1 flat |
11 up 8 dn |
Source: www.stocktradersalmanac.com
* to date
Behind the scenes, there are signs of weakness. Initial jobless claims jumped this past week, above expectations. This past week, we broke a downtrend with 236,000 claims above the expected 220,000. We await the November and apparently October job numbers, supposedly being reported next Tuesday, December 16. The Chicago PMI, the most-watched PMI, has not been above 50% since November 2023. Under 50% suggests recessionary conditions. Retail sales remain good, but overall, they have been faltering for the past few years.
Initial Jobless Claims, Retail Sales, Chicago PMI 2022–2025
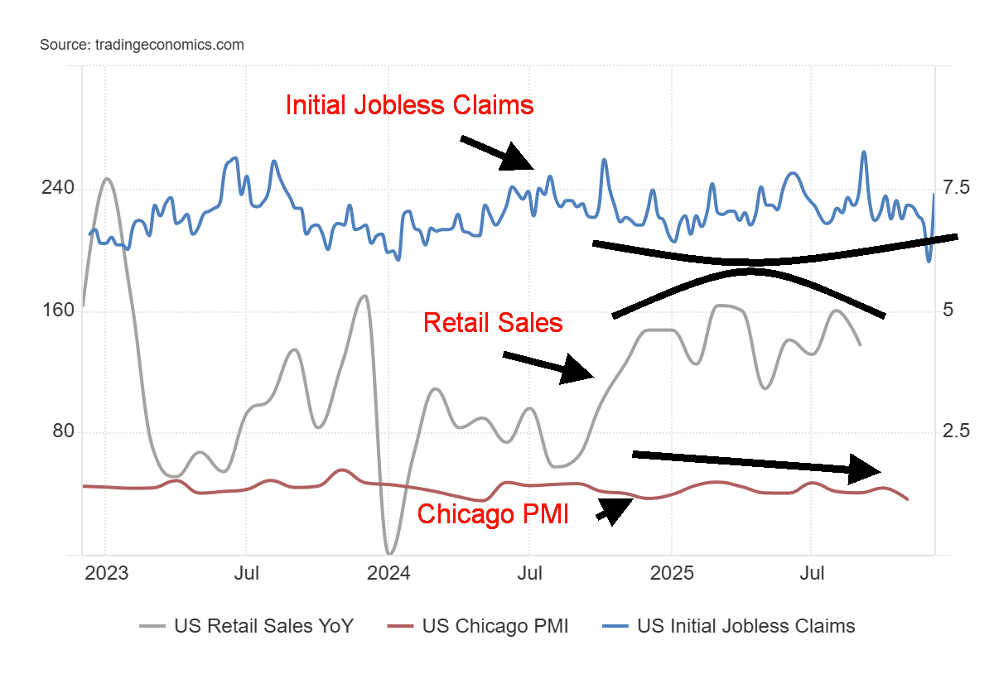
Source: www.tradingeconomics.com, www.dol.gov, www.ismworld.org, www.census.gov
We have noted previously that consumer confidence is down at levels seen at the bottom of the Great Recession (2007–2009) and the early 1980s recession (1980–1982). If things are so good, why is the consumer so pessimistic? The housing market has been faltering as housing starts and sales are both falling. Corporations are facing debt problems, particularly in commercial real estate, and some regional banks are teetering. And maybe most telling of all is that Trump’s approval rating is falling as economic conditions sink (along with his stock DJT, down 69% in 2025).
We note that other economies are faltering. GDP growth rates in the G7 are mostly weak. Canada leads with a GDP growth of +1.3% through the first three quarters. France follows, up 0.4%, the U.K. is up 0.4%, while Italy is up a small 0.1%, Germany is flat, and Japan is teetering, up 0.1%. The U.S.? We are still awaiting Q3 GDP following the shutdown. Q2 was up 3.8% following a decline of 0.6% in Q1. Earlier estimates for U.S. Q3 GDP were growth of 3.2% but more recent data suggest 1.3%. If that’s correct, through the first three quarters U.S. GDP growth rate would be 1.5%. It’s hinted that we’ll get the numbers on December 23.
On the surface, things look good (the stock market has been going up), but underneath, there is growing rot. When will it culminate in a drop for the stock market? 2026?
What are the main risks going forward? The three main ones for the markets are: debt, inflation, and asset valuation. Yes, there are other risks such as geopolitical instability (Russia/Ukraine; Israel and everyone else in the Middle East), domestic instability (deep political divide in the U.S., rising fascism in Europe), and climate change where increasing storms, rising sea levels, droughts, wildfires, and extreme heat can cause economic disruption, rising insurance costs, higher compliance costs, and mass evacuations, disrupting thousands. We also note the risks from AI taking over jobs, the increasing energy demands of AI, growing social tensions, potential energy risks (Venezuela?), falling demographics, and cyberattacks. Will the stock market take notice?
U.S. Federal Debt, U.S. Debt/GDP 2000–2025
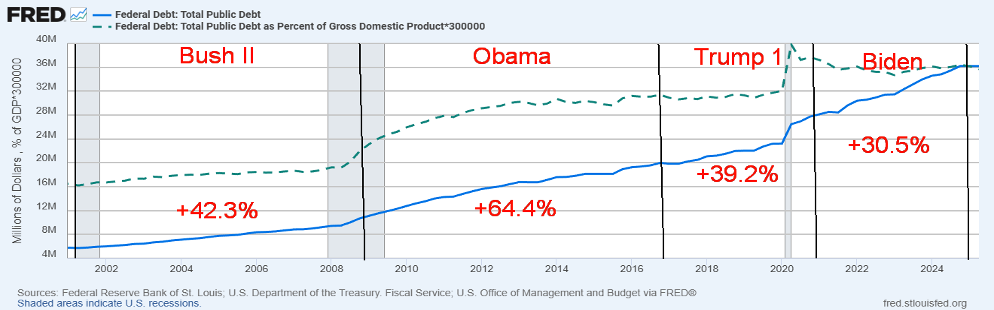
Source: www.stlouisfed.org, www.investopedia.com
U.S. debt, the highest government debt in the world, representing some 11% of all global debt, has gone up by some $33 trillion since 2000. That means that 86% of all the debt ever created in the U.S. has occurred over the past 25 years. Today, it stands at $38.5 trillion and is rising $1.7 trillion to $2.0 trillion annually because of deficits. Since 2000, the debt has gone up for all presidents. Obama suffered under the 2008 financial collapse and Great Recession (2009–2017), while Biden (2021–2025) took over from the COVID recession. The debt/GDP ratio is currently 121.6% vs. 56.1% in 2000. The U.S. debt is a significant risk. Not because of any expectation of default, but because its sheer size and requirements push others out of the market. Rising debt is also fuel for the stock market.
Inflation is not coming down – at least, not as much as expected or desired. Political instability, low interest rates, rising money supply, and deficits, along with things like climate change, all contribute to inflation. Yes, inflation is down from the heights of 2022, but it is still sticky, causing a dilemma and dissension amongst FOMC members. Trump wants lower interest rates and may get them with the appointment of a new Fed chairman in 2026. Under current conditions, lower interest rates would be more fuel for the inflation fire, and yes, the stock market as well.
Inflation Rate vs. Fed Interest Rate 2015–2025
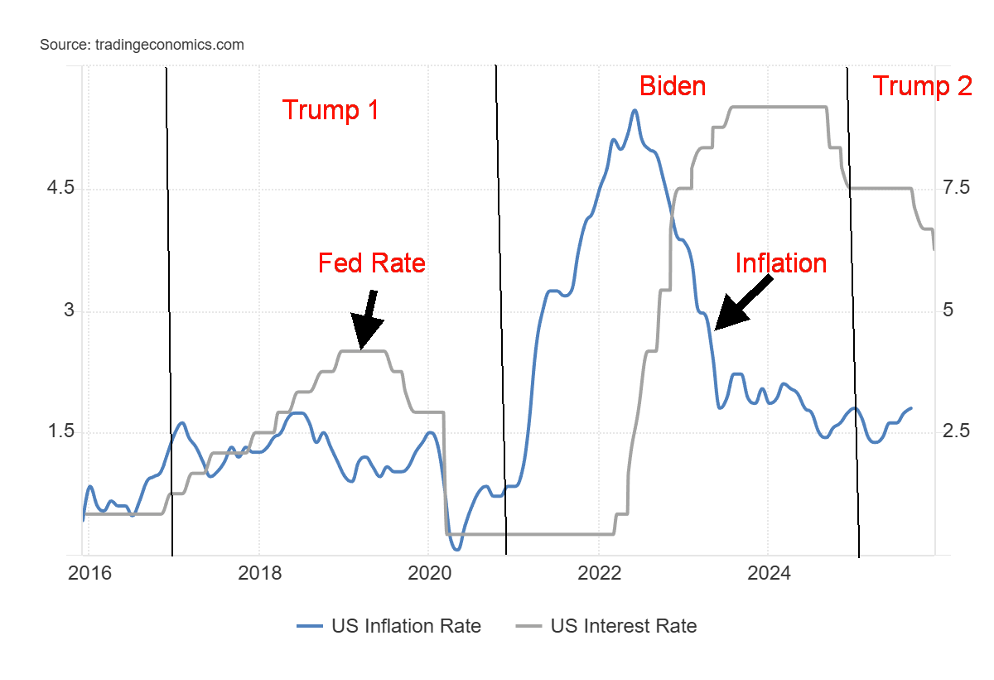
Source: www.tradingeconomics.com, www.bls.gov, www.federalreserve.gov
Then there is stock market valuation. By numerous measurements, the stock market is overvalued. We highlight three below. First, the Shiller PE ratio. The Shiller PE ratio became overvalued at the 1929 peak and very overvalued at the 2000 dot.com peak. And now – the AI peak? Yes, it could go higher as we are still under the 2000 peak. But does one want to chase an overvalued market?
The second indicator we note is the Wilshire 5000/GDP ratio, also known as the Buffett indicator. At almost 225% it has far surpassed the dot.com peak of 2000. Again, it doesn’t tell us a top is in, but it is a stark warning that buying here could prove dangerous. The Dow/GDP and S&P 500/GDP show the same story. Our third valuation index is the Dow/Gold ratio, a fascinating 225-year chart that shows the Dow/Gold ratio rolling over in favour of gold. We show all three charts next.
Shiller PE Ratio 1870–2025
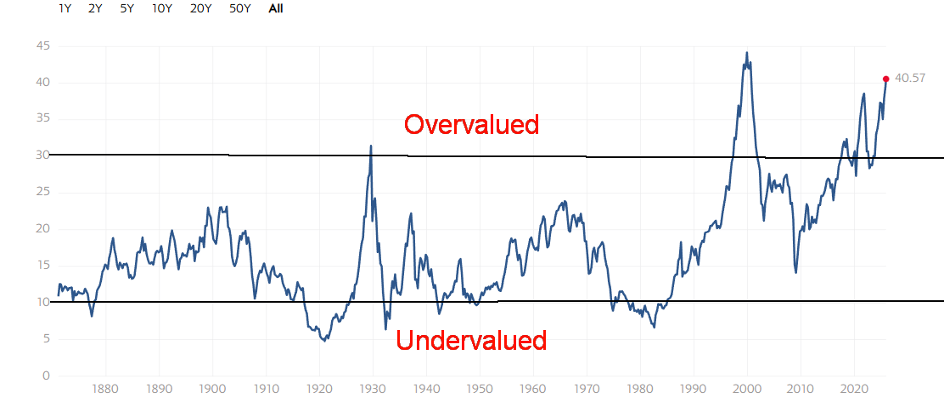
Source: www.multpl.com
Wilshire 5000/GDP Buffett Indicator 1996-2025
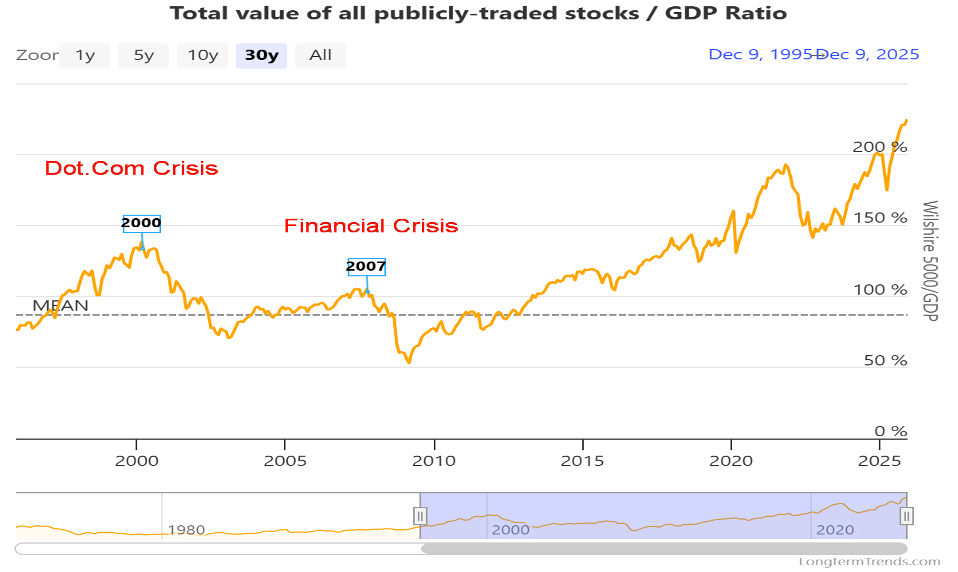
Source: www.longermtrends.com
Dow/Gold Ratio 1800–2025
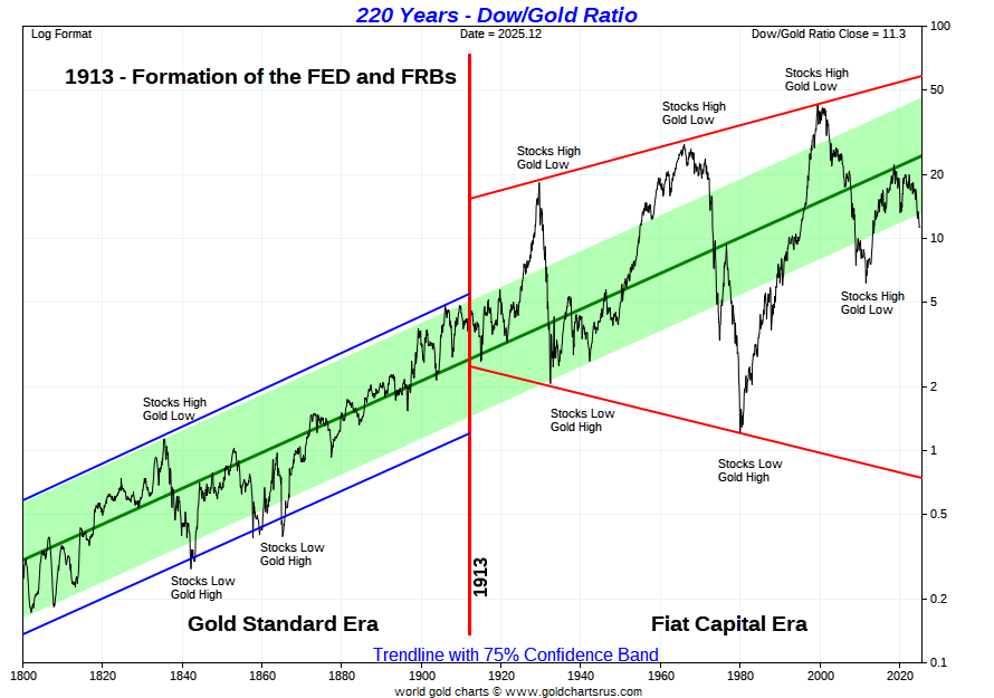
Source: www.goldchartsrus.com
We have also noted cycles in the past. Where we are in the cycle can provide a clue as to how one should be positioned. Ray Merriman’s longest cycle is 72 years (www.mmacycles.com). That last occurred in 2009, which was 77 years from the Great Depression July 1932 low. Merriman has mused on a 90-year cycle, but if that’s true, since 1800, only two have occurred: in 1843 and 1932. Using those as are start point, we do note on long-term charts there was an important low in 1761 (82 years from 1843) and 1672 (89 years from 1761). If that’s correct, then we are in the window for a potential 90-year low. It is centred on 2022 but could range 15 years on either side. It’s a very long-term cycle. The 72-year cycle is also long with few observations, dating back to 1600.
More probable is the 18-year cycle, again last in 2009. We are also in the window for that cycle. Shorter cycles like the 9-year and 6-year also find us in the window for those lows. However, we can’t say we are falling into those lows until we get sell signals in the stock market, followed by a bear market decline of 20% or more.
Cycles are good for the overall picture, but they say little about the day-to-day, month-to-month, or year-to-year performance of markets. What’s key is that they are a warning, so proceed with caution. Note these cycles are for the stock market only. Commodities, bonds, etc., have their own cycles.
Dow Jones Industrials 1900–2025
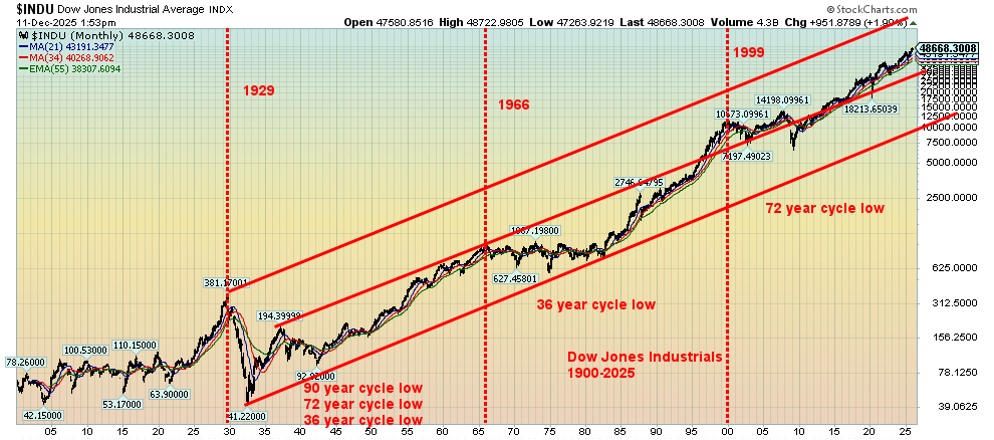
Long-Term Cycles for U.S. Stocks
|
Cycle |
Start/Progress |
Next Due |
|
90-year |
July 1932 / 93 years |
2022 +/- 15 years |
|
72-year |
March 2009 / 16 years |
2081 +/- 12 years |
|
36-year |
March 2009 / 16 years |
2045 +/- 6 years |
|
18-year |
March 2009 / 16 years |
2027 +/- 3 years |
|
9-year |
March 2020 / 5 years |
2029 +/- 2 years |
|
6-year |
October 2022 / 3 years |
2028 +/- 1 year |
Source: www.mmacycles.com
Chart of the week
An interesting fact we found is that the S&P 500 in terms of money supply (M2) remains under its peak seen in 1999. This, we suspect, is little known. But it explains one thing: pump up the money supply, and stocks will rise. Or, in this case, the S&P 500 is rising, but in terms of money supply, it still lags earlier periods.
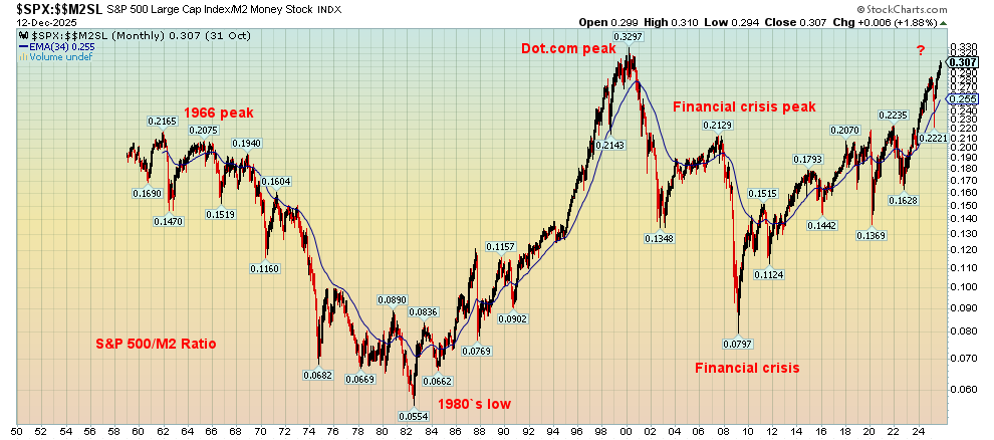
Source: www.stockcharts.com
Bonds
Next, we turn our attention to bonds. Bonds, at least over the past 45 years, have shown predictable cycles. Major lows occur roughly every 18 years while shorter periods are 6-year lows and in between 2- or 3-year lows. The last 18-year cycle we note was in 2018. So, we are now supposed to be on the up cycle. But not so fast. Bonds broke down in 2022, breaking a 41-year uptrend. That’s significant as it tells us that the long period of low interest rates is over. Anybody expecting a return to those days is, we suspect, dreaming. A low was seen in 2023 and, given it was within the range of a potential 6-year cycle low (range 5–7 years), it may well have been that low. We have been bouncing since, but now appear to be turning down (price) and up (yield) once again.
A 2-year low takes us into 2026, but a 3-year low takes us into 2027. Since we have turned down (price) and up (yield), we would be cautious on bonds as we go into 2026. The great bull market for bonds (1981–2022) appears to be over. That does fit with the potential for ongoing high inflation or even rising inflation. We note the pressure to lower interest rates. But the Fed cut its quarter point as expected on December 10. Since then, bond yields have gone up, not down: the opposite of what one would expect. Going forward, bonds should be generally poor performers. We have noted that investors (i.e., portfolio managers) have been shortening terms.
U.S. 30-Year Bonds 1978-2025
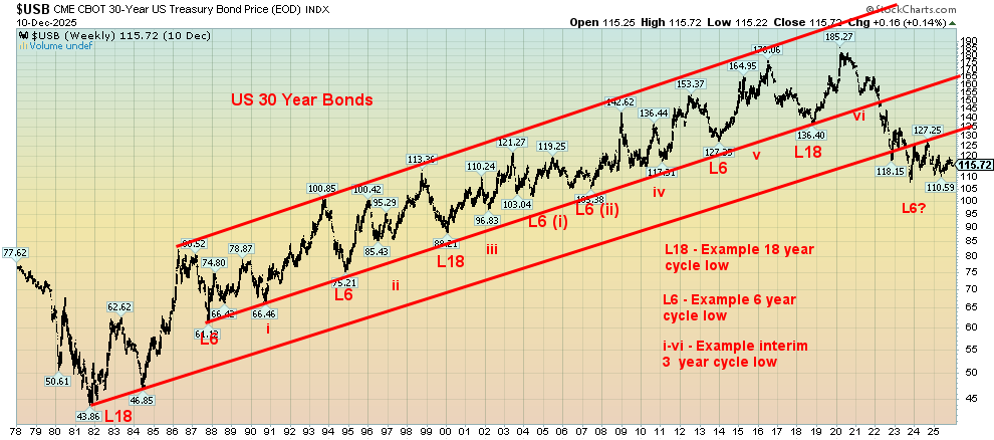
Source: www.stockcharts.com
Gold and Precious Metals
It’s been a golden year. And more recently, we’ve heard regular singing of “silver bells, silver bells.” Gold is the canary in the coal mine. It has been a source of wealth, money, and currency for at least 3,000 years. The world has at times been on a gold standard, and the dominant form of money was gold coins. Think of the Roman solidus (gold coin) that was introduced under the Emperor Constantine the Great, serving the latter part of the Roman Empire and through the Byzantine Empire from roughly 270 AD to 1450 AD, or 12 centuries. Gold standards existed in various forms after that; a gold standard only existed in various forms from 1819, with a classic period from 1880 to 1914. WW1 changed everything, and after that, the gold standard sputtered.
Gold is money, and in times of economic uncertainty, geopolitical and domestic political uncertainty, and massive debt, the go-to asset is gold. It’s real; Bitcoin is virtual. All others – paper money, currencies, stocks, and bonds are just that – fiat paper. Gold is up about 62% in 2025, its best year since 1979. Bitcoin is down over 3%. Gold has no liability. It can’t be destroyed.
Gold’s decennial cycle is not great for clues, as gold has only been free trading since 1971. One could start with 1968, when the London Gold Pool collapsed. Three years later, in August 1971, President Richard Nixon took us off the gold standard. Years ending in 6 show 3 up and 2 down. So, not great clues.
Our best-known cycle is Merriman’s 7.8-year cycle (www.mmacycles.com). This was last seen in 2022 and, if it’s correct, we are in the up cycle of the current 7.8-year cycle. Lows can occur roughly every 31 months, and we are due for one now or into early 2026. To date, we haven’t confirmed a low, last seen in October 2025 at $3,915. While we are up roughly $365 from that low, we can’t confirm a low until we at least make new all-time highs above $4,381.
10-Year Gold Cycle
Annual % Change in Gold
Year of Decade
|
Decades |
1st |
2nd |
3rd |
4th |
5th |
6th |
7th |
8th |
9th |
10th |
|
1961–70 |
|
|
|
|
|
|
-0.5 |
10.7 |
6.2 |
-8.9 |
|
1971–80 |
16.5 |
48.9 |
75.6 |
60.6 |
-23.3 |
-3.8 |
23.4 |
36.5 |
134.8 |
10.9 |
|
1981–90 |
-32.5 |
12.7 |
-14.4 |
-20.0 |
6.9 |
23.1 |
20.1 |
-15.7 |
-1.8 |
-1.6 |
|
1991–00 |
-10.6 |
-5.9 |
17.6 |
-1.9 |
1.0 |
-4.9 |
-21.5 |
-0.2 |
0.1 |
-6.0 |
|
2001–10 |
2.6 |
24.8 |
flat |
25.6 |
18.2 |
22.8 |
31.4 |
5.8 |
23.9 |
29.8 |
|
= |
10.2 |
7.0 |
-28.2 |
-1.5 |
-10.4 |
8.6 |
13.7 |
-2.1 |
18.9 |
24.4 |
|
2021–30 |
-3.5 |
-0.1 |
13.5 |
27.2 |
62.1* |
|
|
|
|
|
|
|
3 up 3 dn |
4 up 2 dn |
3 up 2 dn 1 flat |
3 up 3 dn |
4 up 2 dn |
3 up 2 dn |
4 up 2 dn |
3 up 3 dn |
5 up 1 dn |
3 up 3 dn |
* To date
Source: www.stocktradersalmanac.com
If gold has been spectacular in 2025, silver has been more so, up roughly 112% in 2025. No wonder some are singing “silver bells, silver bells.” Silver, like gold, may have formed its cycle low in late October 2025 at $45.55. Since then, silver has soared to new all-time highs, finally taking out the nominal high of 1980 and 2011 near $50. The problem with silver soaring to new all-time highs is that gold has not yet made new all-time highs, although the stock indices (Gold Bugs Index (HUI), TSX Gold Index (TGD)) did make slight new all-time highs.
Both gold, silver, and the gold stocks usually enjoy a positive seasonality period that can last into February/March. Are we on that cycle? We could be, but that needs to be confirmed. Nonetheless, we expect the precious metals sector (gold, silver, platinum, near PMs palladium, copper) to enjoy another up year in 2026. Will it be as good as 2025? That is to be determined.
Our long-term chart of gold on the next page shows one of the most compelling cup and handle patterns we have ever seen. Initial targets were around $3,600, now surpassed. The next target is $4,620, which could be hit in Q1 2026. As we said, it has been a golden year, and our expectations for 2026 are that we could have another one. Oh yes, and silver bells too.
Gold 1970–2025
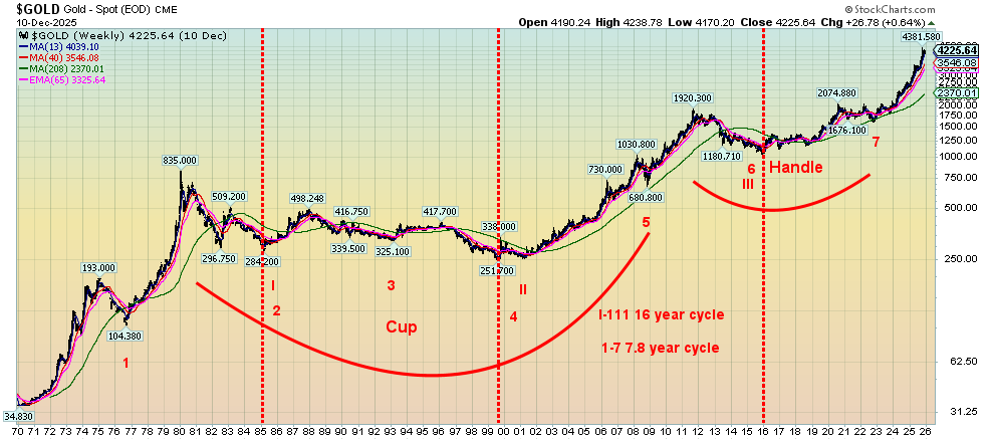
Source: www.stockcharts.com
Long-Term Cycles for Gold
|
Cycle |
Start / Progress |
Next Due |
|
16-year |
December 2015 / 10 years |
2031 +/- 2 years |
|
7.8-year (94 months) |
November 2022 / 25 months |
October 2029–July 2031 |
|
31.33-months |
November 2022 / 25 months |
November 2024–January 2026 |
|
10.5-months |
November 2024 / 12 months |
Due now (possibly October 2025?) |
Source: www.mmacycles.com
Oil
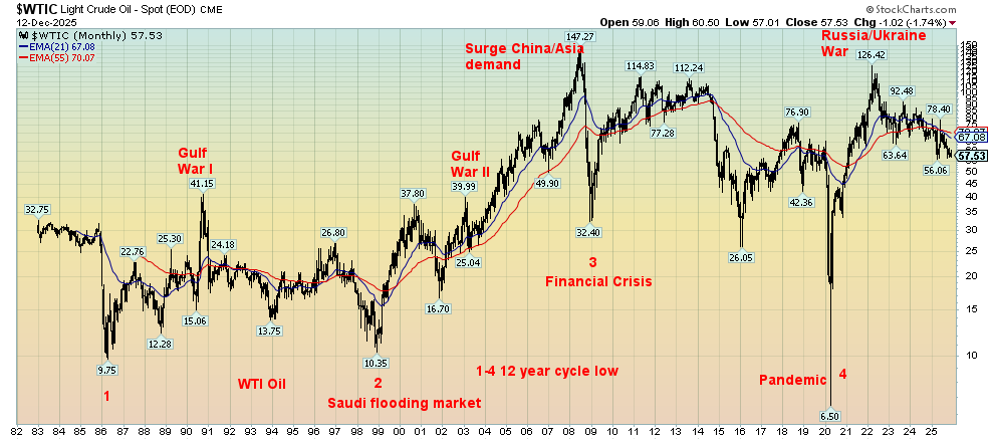
WTI Oil 1982–2025
Source: www.stockcharts.com
Are you enjoying your cheap gasoline? Gas is readily available here in my hometown of Toronto, Ontario, Canada, at roughly $1.25–$1.30/liter. That would translate into 23₵–24₵/liter back in 1975. Well, it was a bit cheaper then, at around 14₵/liter. Nonetheless, gas has been as cheap as it has been since the Russian invasion of Ukraine in 2022. Today, WTI oil closed on Friday at $57.50. In 1975, that would be $9.50. In December 1975, WTI oil was trading around $11.15. Oil is cheap today by comparison.
But will it stay that way? Certainly, there is some potential outside pressure. First, the Russia/Ukraine war is still a regional war, but there are signs that the EU/NATO might get involved. That could send oil prices higher with the threat that other players could become involved. The Persian Gulf/Straits of Hormuz remain a tension zone, and threats by the U.S. to attack Venezuela (which holds the world’s largest oil reserves) could also send oil prices higher.
Merriman’s longest cycle, which he notes is highly visible, is the 12-year cycle. Lows were seen in 1986, 1998 (12 years), 2008 (10 years), and 2020 (12 years). The next one is not due until 2032 +/- 2 years. In between, oil appears to have a 4-year cycle. We note lows in 1986, 1990, 1994, 1998, 2001/2002, 2006, 2010, 2015, 2020, and 2025 (to date). That means the next one isn’t due until 2029 +/- 1 year. The low was in April 2025, a little on the late side for the 4-year low but within range. All that suggests there is a chance oil prices could rise in 2026 if geopolitical events take place. Oil is very sensitive to geopolitical events, particularly war in oil-producing regions. The Straits of Hormuz (Persian Gulf) may be the most important chokepoint in the world, given that 20% of LNG and 25% of the world’s oil flow through there annually.
Conclusions
What we have gleaned points to a number of conclusions as to how 2026 might unfold:
Financial
- Debt. There is way too much of it globally and a real risk of a sovereign debt crisis. We have noted Japan, given the unwinding of the yen carry trade. We have read concerns about IMF bailouts for the U.K. and France, even as we think the likelihood is extremely low. Nonetheless, it emphasizes the problems that both the U.K. and France are going through, and by extension, the EU. The U.S., despite having the world’s largest debt, has the backing of the Fed. 2026 will see a new Fed Chairman at the helm, one who will be particularly dovish as the president seeks lower interest rates (sharply?). Outside of the large players noted above, there are problems in the U.S. with commercial real estate, households, and regional banks. The EU, in general, has problems, and Japan is loaded with them. Smaller players, if they collapsed, are a problem as well, but not to the same extent as the G7 countries.
- Rising interest rates. While the Fed controls the short end of the yield curve and a dovish Fed Chairman appears to be on his way in, the Fed does not control the long end of the market. As we have noted, long interest rates are rising, not falling. Sticky inflation that threatens to rise again is the main culprit, but an economy that continues to grow and still-strong corporate profits could also put upward pressure on long interest rates.
- An implosion in AI stocks. Such an event would spread to the rest of the market, taking even gold down with it if it resulted in a crash. Given overbought conditions, overvaluation, and the demands going forward for AI companies, these are some of the reasons to be concerned about the market. AI tech firms have also been involved in a circular flow of investments that are artificially inflating the value of their stocks.
- An implosion in the cryptocurrency universe. Bitcoin may be down only 3.3% in 2025, but it is down almost 30% from its all-time high. We are reading about a potential threat to stablecoins, which, if correct, could spill over into the U.S. treasury market.
Political
- Russia/Ukraine war. While there are ongoing attempts to resolve the Russia/Ukraine war, there are also signs that they will fail. Pressure is being heaped on the EU/NATO to get involved. If that happened, that is a dangerous threat that could turn a regional war into a world war.
- A deeply divided America. The polarized politics of the U.S. could turn into something more violent than they already are. We could also see a constitutional crisis, given the potential for paralysis of the courts and Congress, and President Trump’s ongoing attempts to weaken the constitution.
If either of the above occurred, that could have a negative impact on markets. Stocks down, gold up.
The AI bubble is showing signs of breaking. Will it turn into a serious burst, a crash? Nothing goes up forever.
2026 could prove to be a dangerous year. Be cautious about stocks, own gold and silver, and shorten bond duration. Copper could be a big winner in 2026, given the demand for copper (AI) and growing shortages. Stock sectors that could fare well include defense, natural resources/materials, and agriculture.
Copyright David Chapman 2025
Markets & Trends
|
|
|
|
% Gains (Losses) Trends |
|
||||
|
|
Close Dec 31/24 |
Close Dec 12/25 |
Week |
YTD |
Daily (Short Term) |
Weekly (Intermediate) |
Monthly (Long Term) |
|
|
|
|
|
|
|
|
|
||
|
S&P 500 |
5,881.63 |
6,827.41 |
(0.6)% |
16.1% |
up |
up |
up |
|
|
Dow Jones Industrials |
42,544.22 |
48,458.05 (new highs) * |
1.1% |
13.9% |
up |
up |
up |
|
|
Dow Jones Transport |
15,894.75 |
17,504.57 (new highs) |
1.9% |
10.1% |
up |
up |
up |
|
|
NASDAQ |
19,310.79 |
23,195.17 |
(1.6)% |
20.1% |
up |
up |
up |
|
|
S&P/TSX Composite |
24,796.40 |
31,527.39 (new highs) * |
0.7% |
27.5% |
up |
up |
up |
|
|
S&P/TSX Venture (CDNX) |
597.87 |
954.61 |
1.6% |
59.7% |
up |
up |
up |
|
|
S&P 600 (small) |
1,408.17 |
1,509.74 (new highs) |
2.0% |
7.2% |
up |
up |
up |
|
|
ACWX MSCI World x US |
51.43 |
67.16 |
0.3% |
30.6% |
up |
up |
up |
|
|
Bitcoin |
93,467.13 |
90,321.02 |
0.9% |
(3.4)% |
down (weak) |
down |
up |
|
|
|
|
|
|
|
|
|
|
|
|
Gold Mining Stock Indices |
|
|
|
|
|
|
|
|
|
Gold Bugs Index (HUI) |
275.58 |
700.76 (new highs) * |
5.6% |
154.3% |
up |
up |
up |
|
|
TSX Gold Index (TGD) |
336.87 |
812.07 (new highs) * |
5.0% |
141.1% |
up |
up |
up |
|
|
|
|
|
|
|
|
|
|
|
|
% |
|
|
|
|
|
|
|
|
|
U.S. 10-Year Treasury Bond yield |
4.58% |
4.18% |
1.0% |
(8.7)% |
|
|
|
|
|
Cdn. 10-Year Bond CGB yield |
3.25% |
3.44% |
0.6% |
5.9% |
|
|
|
|
|
Recession Watch Spreads |
|
|
|
|
|
|
|
|
|
U.S. 2-year 10-year Treasury spread |
0.33% |
0.65% |
14.0% |
97.0% |
|
|
|
|
|
Cdn 2-year 10-year CGB spread |
0.30% |
0.83% |
6.4% |
176.7% |
|
|
|
|
|
|
|
|
|
|
|
|
|
|
|
Currencies |
|
|
|
|
|
|
|
|
|
US$ Index |
108.44 |
98.37 |
(0.6)% |
(9.3)% |
down |
down (weak) |
down |
|
|
Canadian $ |
69.49 |
0.7261 |
0.4% |
4.5% |
up |
up (weak) |
down (weak) |
|
|
Euro |
103.54 |
117.37 |
0.8% |
13.4% |
up |
up |
up |
|
|
Swiss Franc |
110.16 |
125.83 |
1.2% |
14.2% |
up |
up |
up |
|
|
British Pound |
125.11 |
133.71 |
0.3% |
6.9% |
up |
neutral |
up |
|
|
Japanese Yen |
63.57 |
64.16 |
(0.4)% |
0.9% |
down |
down |
down |
|
|
|
|
|
|
|
|
|
|
|
|
|
|
|
|
|
|
|
|
|
|
Precious Metals |
|
|
|
|
|
|
|
|
|
Gold |
2,641.00 |
4,299.71 |
2.9% |
62.3% |
up |
up |
up |
|
|
Silver |
29.24 |
61.97 (new highs) * |
6.2% |
111.9% |
up |
up |
up |
|
|
Platinum |
910.50 |
1,757.50 (new highs) |
6.6% |
93.0% |
up |
up |
up |
|
|
|
|
|
|
|
|
|
|
|
|
Base Metals |
|
|
|
|
|
|
|
|
|
Palladium |
909.80 |
1,512.00 |
2.8% |
66.2% |
up |
up |
up |
|
|
Copper |
4.03 |
5.29 |
(1.5)% |
31.3% |
up |
up |
up |
|
|
|
|
|
|
|
|
|
|
|
|
Energy |
|
|
|
|
|
|
|
|
|
WTI Oil |
71.72 |
57.49 |
(4.4)% |
(19.8)% |
down |
down |
down |
|
|
Nat Gas |
3.63 |
4.10 |
(22.6)% |
13.0% |
down (weak) |
up |
up |
|
Source: www.stockcharts.com
* New All-Time Highs
Note: For an explanation of the trends, see the glossary at the end of this article.
New highs/lows refer to new 52-week highs/lows and, in some cases, all-time highs.
GLOSSARY
Trends
Daily – Short-term trend (For swing traders)
Weekly – Intermediate-term trend (For long-term trend followers)
Monthly – Long-term secular trend (For long-term trend followers)
Up – The trend is up.
Down – The trend is down
Neutral – Indicators are mostly neutral. A trend change might be in the offing.
Weak – The trend is still up or down but it is weakening. It is also a sign that the trend might change.
Disclaimer David Chapman is not a registered advisory service and is not an exempt market dealer (EMD) nor a licensed financial advisor. He does not and cannot give individualised market advice. David Chapman has worked in the financial industry for over 40 years including large financial corporations, banks, and investment dealers. The information in this newsletter is intended only for informational and educational purposes. It should not be construed as an offer, a solicitation of an offer or sale of any security. Every effort is made to provide accurate and complete information. However, we cannot guarantee that there will be no errors. We make no claims, promises or guarantees about the accuracy, completeness, or adequacy of the contents of this commentary and expressly disclaim liability for errors and omissions in the contents of this commentary. David Chapman will always use his best efforts to ensure the accuracy and timeliness of all information. The reader assumes all risk when trading in securities and David Chapman advises consulting a licensed professional financial advisor or portfolio manager such as Enriched Investing Incorporated before proceeding with any trade or idea presented in this newsletter. David Chapman may own shares in companies mentioned in this newsletter. Before making an investment, prospective investors should review each security’s offering documents which summarize the objectives, fees, expenses and associated risks. David Chapman shares his ideas and opinions for informational and educational purposes only and expects the reader to perform due diligence before considering a position in any security. That includes consulting with your own licensed professional financial advisor such as Enriched Investing Incorporated. Performance is not guaranteed, values change frequently, and past performance may not be repeated.
About the author


Website: https://www.enrichedinvesting.com
Disclaimer: David Chapman is not a registered advisory service and is not an exempt market dealer (EMD) nor a licensed financial advisor. We do not and cannot give individualised market advice. David Chapman has worked in the financial industry for over 40 years including large financial corporations, banks, and investment dealers. The information in this newsletter is intended only for informational and educational purposes. It should not be considered a solicitation of an offer or sale of any security. The reader assumes all risk when trading in securities and David Chapman advises consulting a licensed professional financial advisor before proceeding with any trade or idea presented in this newsletter. David Chapman may own shares in companies mentioned in this newsletter. We share our ideas and opinions for informational and educational purposes only and expect the reader to perform due diligence before considering a position in any security. That includes consulting with your own licensed professional financial advisor.