
Four things stand out from this past week besides the chaos on the streets of the U.S. particularly Minnesota. First silver soared past $100 and gold approached $5,000 as safe haven demand heightened against the backdrop of the chaos on the streets and President Trump's volatility over Greenland. Second the Japanese 10-year bond (JGBs) soared threatening the Japanese bond market and Japan who have the highest debt to GDP in the G7 and one of the highest in the world. Third, natural gas prices soared due to the ice storms and extreme cold weather in the U.S. Heating costs have soared. For example, Peyto Exploration & Development Corp., which pays a dividend and is one of Canada’s largest natural gas producers, reported strong funds from operations, low cash costs, and increased earnings, as well as a strong operating margin and reduced net debt, and is held in the Enriched Capital Conservative Growth Strategy.* Finally the U.S. dollar had its worst week in 8 months as investors fretted about Greenland and domestic U.S. chaos and violence.
Volatility is a measurement of risk in a stock or market index. High volatility, high risk but also a measurement of fear. Low volatility, low risk but also a measurement of greed or complacency. And so it is with the stock market. This past week volatility picked up a bit as President Trump bounced between threats to tariff the EU and invade Greenland only to turn around and back off on the same. The last time the VIX Volatility Index really spiked was during the Liberation Day tariffs. Trump had threatened tariffs on nearly everyone then he softened it sharply when the stock market tanked, bond yields jumped and gold soared. A rising stock market is music to Trump's ears. A falling one gets him to change his mind.
The stock market wobbled this past week in reaction to Trump's declarations over Greenland but didn't break. Q3 GDP was stronger than expected. Sentiment improved. Gold and silver soared with gold now just short of $5,000 while silver leaped over $100. Both continue to make all-time highs. Gold/Silver remain the canary in the coal mine signalling fear. Bond yields wobbled but at the end were unchanged. But long interest rates are not coming down. U.S. debt remains astronomical. Credit agencies are nervous. Fed Chair Jerome Powell remains under criminal investigation, but he hasn't caved in to Trump's demands.
Rare earths are a big topic these days. They are the subject of our chart of the week as we lay out who holds the biggest reserves and produces the most. China leads the pack. Some rare earths are also critical minerals for industry. And the U.S. needs them.
The U.S. economy is still humming along but the evidence shows it is largely being kept up by the top 20%. Meanwhile chaos continues on the streets of America especially in Minneapolis. The K economy?
This week brings key interest rate decisions. Both the Bank of Canada (BofC) and the Fed are expected to leave the key bank rate unchanged. Trump will not be pleased.
The weather is miserable. Drive carefully. Better, stay home.
Still, try and have a great week.
DC
* Reference to the Enriched Capital Conservative Growth Strategy and its investments, celebrating a 7.92 -year history of 147.47% growth (annual 12.13%), is added by Margaret Samuel, President, CEO and Portfolio Manager of Enriched Investing Incorporated, who can be reached at 416-203-3028 or msamuel@enrichedinvesting.com This information should not be construed as an offer, or a solicitation of an offer or sale of any security. Past performance does not guarantee future returns.
“As for it being different this time, it is different every time. The question is in what way, and to what extent.”
—Tom McClellan, market analyst and technician, founder and editor of The McClellan Market Report
“Pretending to know everything closes the door to finding out what’s really there.”
—Neil deGrasse Tyson, American astrophysicist, author, science communicator, wrote Death by Black Hole (2007), Astrophysics for People in a Hurry (2017); b. 1958
“The bigger a man’s head gets, the easier it is to fill his shoes.”
—anonymous
It’s like the world has gone mad. President Trump announces the U.S. will invade Greenland and get what he wants one way or the other. Then he puts tariffs on EU countries that defy him. Stock markets tank, gold soars. The next day, he won’t invade Greenland and the tariffs are removed. Stock markets soar. Gold tanks. Volatility – you have to love it. The EU called Trump’s bluff.
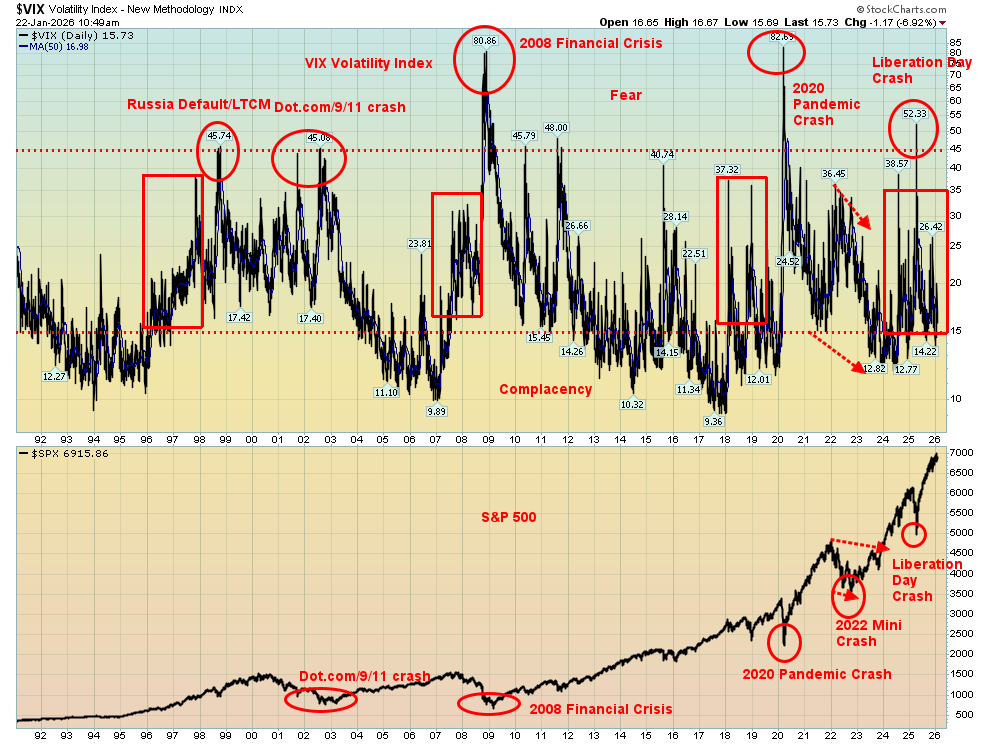
The VIX Volatility Index leaps up and down according to the whims of the stock market. The VIX moves inversely to the market. When stock markets fall, the VIX rises. When stock markets rise, the VIX falls. And so it has been with Trump’s announcements as to whether he’s going to invade or not invade. He’s going to tariff or he’s not going to tariff. He claims he has the framework of a deal with NATO. Except Greenland is Danish territory not NATO territory.
Right now, the VIX is at a level above complacency but nowhere near fear. The last time the VIX moved into fear territory was during the so-called “Liberation Day” mini-crash back in April 2025. That’s when Trump announced a raft of tariffs against the rest of the world. The S&P 500 fell a fast 21%+ from February to Apil 2025 with the biggest down move coming after April 2, 2025, when Trump made the official announcement. A quick bear market. Except it ended almost as quickly as it started when Trump reversed course on a lot of the tariffs. If the stock market tanks, Trump reverses course. Buy the fear. No wonder he’s called the TACO man (Trump always chickens out). It’s clear he does not like tanking stock markets or sharply rising bond yields.
The VIX soared to 52.33 during the Liberation Day mini-crash. Naturally, it didn’t last long, later falling as low as 14.22, in complacency territory. Nor was Liberation Day the worst ever for the VIX. That belongs to the 2020 pandemic crisis when the VIX hit a record high of 82.65. After the central banks launched an unprecedented quantitative easing (QE) program plus lowering interest rates to zero, and governments unleashed income support programs, the VIX fell rapidly again as investors leaped back into the stock markets.
While the programs helped save the markets, the massive injection of liquidity into the financial system helped unleash an inflationary rise in assets: i.e., stocks and housing. It also helped unleash the inflation that emerged in 2022, requiring the central banks to reverse course, ending QE and hiking interest rates. There were, of course, other factors impacting inflation such as supply chain disruptions and the outbreak of war between Russia and Ukraine.
All this is against a backdrop of too much debt. Rising interest rates are a threat to governments who are overburdened with far too much debt. It’s an estimated as a $350 trillion problem. For the U.S. it is a bigger problem, given they have the largest debt in the world, not only the U.S. treasury debt but also corporate and consumer debt. Hence, the desire of Trump to lower interest rates, sharply bumping him up against the Federal Reserve. Now, to help push the Fed in Trump’s direction, he has unleashed an unprecedented criminal investigation into the Fed and its chair Jerome Powell.
In a lesser noticed investigation, they also unleashed an investigation into Lisa Cook, a Fed governor, on mortgage fraud. The Supreme Court is signalling the case will be thrown out. The attempt to get rid of Cook was to help Trump appoint another loyalist to the Board of Governors. Powell’s term is up in May, although it looks like he will stay on as a Fed governor for two years as he is allowed to.
All of these are unprecedented attacks on the independence of the Federal Reserve. The Fed’s independence is paramount. The potential politicization of the Fed could trigger a sharp bond and U.S. dollar sell-off. The rating agencies are also looking at this nervously from the sidelines with some hints that the U.S. credit rating could be downgraded. The current credit rating for the U.S. from S&P is AA+ after being downgraded from AAA in 2011, when the U.S. sharply raised the debt limit. It has remained that way ever since. Other rating agencies followed the S&P over the years. The use of the U.S. dollar as the world’s reserve currency has fallen over the years from 62% in 2010 to around 56% today. History shows that all reserve currencies eventually fail: consider the Roman denarius, the Roman and Byzantine gold solidus, the Venetian lira, the Portugese escudo, the Spanish real, the Dutch guilder, the French franc, and the British pound sterling. All were once the world’s reserve currency.
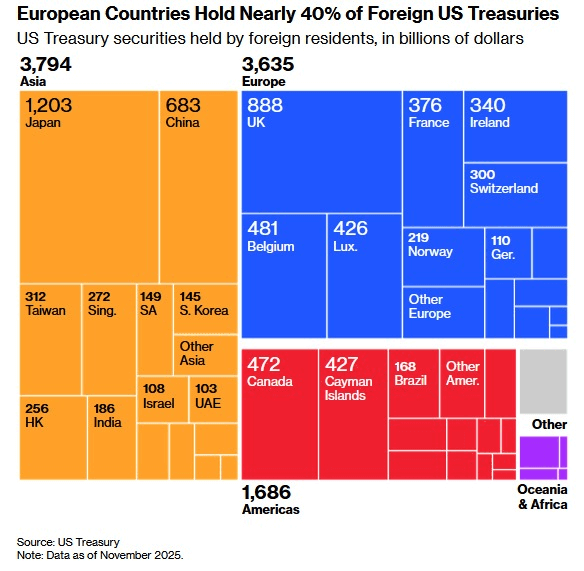
As to a bond sell-off, a Danish pension fund announced they were going to dump their $100 million portfolio of U.S. treasuries. They didn’t say that Greenland is the reason why. Denmark is not listed as a major holder of U.S. treasuries. Foreign holders hold an estimated $9,355.4 billion of U.S. debt (vs. total debt of $38.6 trillion), led by Japan with $1,202.6 billion of U.S. debt. Number two is the U.K. with $888.5 billion, followed by number three, China, with $682.6 billion. For China, that is a drop of $84.3 billion in the past year. China’s holdings used to exceed $1 trillion, as they were the largest foreign holder of U.S. treasuries. The U.S.’s ongoing disputes with China have led to the Chinese sell-off. The slack has been picked up by Japan, the U.K., and others. Top EU countries hold $3.1 trillion of U.S. treasuries. The U.S.’s debt needs are enormous as they expect to add an estimated $1.7 trillion in 2026 alone.
Even as Trump wants to lower interest rates, we are reminded that the Fed only controls the short end of the yield curve. The long end of the yield curve is under the purview of the bond market. Already the U.S. 10-year Treasury note has gone up 10 bp in 2026 from 4.17% to a recent peak of 4.27%. Bond dealers are savvy. If they see a president trying to game the market, sellers will swiftly appear. The president cannot control the bond market. The Fed cut rates four times in 2024 and three times in 2025. In September 2024 the 10-year was 3.7% when the Fed first cut. In September 2025 when the next cutting wave came, it was 4.06%. Today it is 4.23%. The Fed cutting rates is no panacea for the bond market buying it.
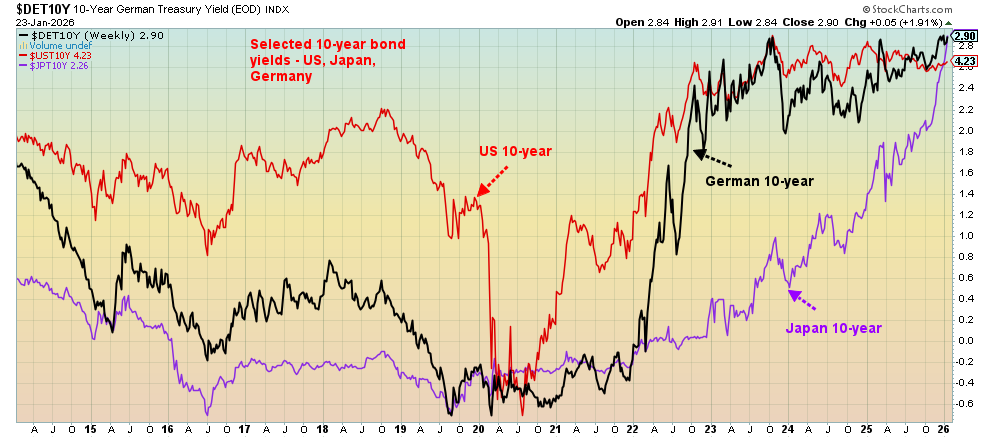
Japan has an even bigger problem. Its outstanding government debt is around $11.1 trillion. But it is 252% of GDP, the highest in the G7 and almost the highest in the world – a big problem. The Japanese 10-year bond, known as JGBs, has gone from negative 0.281% in late 2019 to 2.29% today, an incredible increase of 800%+. It is straining the Japanese bond market as, following years of suppressing interest rates, the huge rise is putting the Japanese bond market at risk and in turn jeopardizing the Japanese government. Could a default occur as some speculate?
The focus is on the politics, but the real dangers may lie in the global bond market.
Source: www.home.treasury.gov
Source: www.stockcharts.com
Source: www.stockcharts.com
Chart of the Week
Rare Earth Reserves and Production
|
Country |
Reserves (metric tons) |
Rare earth production 2024 (metric tons) |
|
🇨🇳 China |
44.0M |
270,000 |
|
🇧🇷 Brazil |
21.0M |
20 |
|
🇮🇳 India |
6.9M |
2,900 |
|
🇦🇺 Australia |
5.7M |
13,000 |
|
🇷🇺 Russia |
3.8M |
2,500 |
|
🇻🇳 Vietnam |
3.5M |
300 |
|
🇺🇸 United States |
1.9M |
45,000 |
|
🇬🇱 Greenland |
1.5M |
0 |
|
🇹🇿 Tanzania |
890K |
0 |
|
🇿🇦 South Africa |
860K |
0 |
|
🇨🇦 Canada |
830K |
0 |
|
🇹🇭 Thailand |
4.5K |
13,000 |
|
🇲🇲 Myanmar |
0 |
31,000 |
|
🇲🇬 Madagascar |
0 |
2,000 |
|
🇲🇾 Malaysia |
0 |
130 |
|
🇳🇬 Nigeria |
0 |
13,000 |
|
🌍 Other |
0 |
1,100 |
|
🌐 World total (rounded) |
>90,000,000 |
390,000 |
Source: www.visualcapitalist.com
Greenland, a huge chunk of snow, ice, and mountains, is the largest non-continental island in the world. It is sparsely populated with roughly 57,000 people, mainly Inuit, with most living in the capital city of Nuuk on the coast in the south. It is an autonomous territory of the Kingdom of Denmark. Greenland has become a source of fascination for President Trump, who has expressed intentions to purchase or steal the territory to become a part of the U.S.A. So, what’s the deal? To exploit the territory’s potential for rare earths or to protect it from seizure by Russia or China? Or both?
Trump’s fascination with Greenland has become a hot topic with the EU and Canada (and probably others), who have denounced his threats of taking Greenland either by purchase or force. Trump retaliated by imposing more tariffs on the EU and Canada, thus setting off the potential for another trade war. Greenland was the prime topic at the recent World Economic Forum (WEF) in Davos, Switzerland. The result was stock markets roiled and gold soared. Then Trump, the TACO man, came back and the next day reversed course, saying he had the framework of a deal with NATO and would back off on the EU tariffs. Except for one problem: NATO is not a country, nor does it control Greenland. That belongs to Greenlanders and the Kingdom of Denmark. Irrespective, the stock market ignored the nuance and soared and gold sold off.
Rare earths have become a hot topic of conversation. They have a wide and diverse variety of applications, including electrical and electronic components, glass, and magnetic materials. You’ll find them in your iPad, your car (especially EVs), catalytic converters, medical imaging, batteries, your microwave, and many other products. Rare earths are an essential in the defence industry. There are roughly 17 different types of rare earths, but all are indistinguishable as silvery-lustrous, soft, heavy metals. China has the largest, rare-earth reserves in the world and is also the largest producer. China’s reserves are over double the next largest, Brazil, and China produces almost six times more than the number two producer, the U.S.
Nonetheless, rare earths remain critical to the U.S. Given the disputes between China and the U.S., China has put export controls on its rare earths, thus negatively impacting supply chains, especially for defense, EVs, and electronics. China has not only the world’s largest reserves and production, but they are also the world’s largest importer and consumer of rare earths. Japan is number two while the U.S. is a more distant number four. Nonetheless, rare earths remain critical for the U.S., especially for defense. Hence, the desire to obtain more sources. Greenland has rare earths, but only roughly 3.5% of China’s reserves. Greenland does not produce any rare earths. Most of it is untapped.
The big question for the markets is: will the U.S. manage to buy Greenland or will they invade? Trump tends to change his mind with the wind. He did that during his speech at the WEF in Davos. Nonetheless, the U.S. has been rebuffed by Denmark, the EU, and Canada to purchase Greenland, who have noted that an invasion would mean the end of NATO. As noted, stock markets have reacted negatively while gold and silver have once again soared because of increased risk. The risk for investors is that the U.S. ends its request for Greenland by any method, thus triggering a buy for the stock market and a sell for the precious metals.
Note: critical minerals are a broad category of strategically important elements (like lithium, cobalt, nickel, and copper) that are vital for the economy and clean energy. Rare earth elements or REEs (like neodymium and dysprosium) are a specific group of 17 chemically similar elements that are a subset of critical minerals, essential for high-tech magnets in EVs and turbines. The main difference is scope: all REEs are critical, but not all critical minerals are REEs. Critical minerals are defined by supply risk and economic importance, whereas REEs are a distinct chemical group known for complex separation and unique magnetic/optical properties.
Markets and Trends
|
|
|
|
% Gains (Losses) Trends |
|
||||
|
|
Close Dec 31/25 |
Close Jan 23/26 |
Week |
YTD |
Daily (Short Term) |
Weekly (Intermediate) |
Monthly (Long Term) |
|
|
|
|
|
|
|
|
|
||
|
S&P 500 |
6,845.50 |
6,915.61 |
(0.4)% |
1.0% |
up |
up |
up |
|
|
Dow Jones Industrials |
48,063.29 |
49,098.71 |
(0.5)% |
2.2% |
up |
up |
up |
|
|
Dow Jones Transport |
17,357.19 |
18,199.63 (new highs) * |
(0.3)% |
4.9% |
up |
up |
up |
|
|
NASDAQ |
23,241.99 |
23,501.24 |
(0.1)% |
1.1% |
up |
up |
up |
|
|
S&P/TSX Composite |
31,712.76 |
33,144.98 (new highs) * |
0.3% |
4.5% |
up |
up |
up |
|
|
S&P/TSX Venture (CDNX) |
987.74 |
1,154.15 (new highs) |
5.8% |
16.9% |
up |
up |
up |
|
|
S&P 600 (small) |
1,467.76 |
1,563.30 (new highs) * |
(0.4)% |
6.5% |
up |
up |
up |
|
|
ACWX MSCI World x US |
67.18 |
70.57 (new highs) * |
1.0% |
5.1% |
up |
up |
up |
|
|
Bitcoin |
87,576.98 |
89,316.89 |
(6.4)% |
2.0% |
neutral |
down |
up |
|
|
|
|
|
|
|
|
|
|
|
|
Gold Mining Stock Indices |
|
|
|
|
|
|
|
|
|
Gold Bugs Index (HUI) |
701.49 |
884.45 (new highs) * |
10.9% |
26.2% |
up |
up |
up |
|
|
TSX Gold Index (TGD) |
817.76 |
1,014.58 (new highs) * |
7.9% |
24.1% |
up |
up |
up |
|
|
|
|
|
|
|
|
|
|
|
|
% |
|
|
|
|
|
|
|
|
|
U.S. 10-Year Treasury Bond yield |
4.17% |
4.23% |
flat |
1.4% |
|
|
|
|
|
Cdn. 10-Year Bond CGB yield |
3.44% |
3.42% |
1.2% |
(0.6)% |
|
|
|
|
|
Recession Watch Spreads |
|
|
|
|
|
|
|
|
|
U.S. 2-year 10-year Treasury spread |
0.69% |
0.62% |
flat |
(10.1)% |
|
|
|
|
|
Cdn 2-year 10-year CGB spread |
0.85% |
0.82% |
flat |
(3.5)% |
|
|
|
|
|
|
|
|
|
|
|
|
|
|
|
Currencies |
|
|
|
|
|
|
|
|
|
US$ Index |
98.26 |
97.46 |
(1.9)% |
(0.8)% |
down |
down |
down |
|
|
Canadian $ |
72.87 |
0.7306 |
1.7% |
0.3% |
up |
up (weak) |
neutral |
|
|
Euro |
117.48 |
118.31 |
2.0% |
0.7% |
up |
up |
up |
|
|
Swiss Franc |
126.21 |
128.30 |
3.0% |
1.7% |
up |
up |
up |
|
|
British Pound |
134.78 |
136.43 |
2.0% |
1.2% |
up |
up |
up |
|
|
Japanese Yen |
63.83 |
64.22 (new lows) * |
1.5% |
0.6% |
neutral |
down |
down |
|
|
|
|
|
|
|
|
|
|
|
|
|
|
|
|
|
|
|
|
|
|
Precious Metals |
|
|
|
|
|
|
|
|
|
Gold |
4,311.97 |
4,979.11 (new highs) * |
8.4% |
15.5% |
up |
up |
up |
|
|
Silver |
71.16 |
102.41 (new highs) * |
14.3% |
42.9% |
up |
up |
up |
|
|
Platinum |
124.81 |
2,762.40 (new highs) * |
18.4% |
35.0% |
up |
up |
up |
|
|
|
|
|
|
|
|
|
|
|
|
Base Metals |
|
|
|
|
|
|
|
|
|
Palladium |
1,619.50 |
2,043.00 |
10.9% |
26.2% |
up |
up |
up |
|
|
Copper |
5.64 |
5.94 |
1.5% |
5.3% |
up |
up |
up |
|
|
|
|
|
|
|
|
|
|
|
|
Energy |
|
|
|
|
|
|
|
|
|
WTI Oil |
57.44 |
61.26 |
3.0% |
6.7% |
up |
down (weak) |
down |
|
|
Nat Gas |
3.71 |
5.32 (new highs) |
71.1% |
43.4% |
up |
up |
up |
|
Source: www.stockcharts.com
* New All-Time Highs
Note: For an explanation of the trends, see the glossary at the end of this article.
New highs/lows refer to new 52-week highs/lows and, in some cases, all-time highs.
Source: www.stockcharts.com
Markets continue to be influenced by President Trump and his flip-flops. We’re going to invade Greenland; no, we’re not. We’re going to put tariffs on the EU; no, we’re not. Markets don’t know what to do. Trump wanted to invade Greenland and put on tariffs, so stock markets tanked. Then he changed his mind (the TACO man was spooked by the falling markets), so stock markets rebounded. He says he has a deal. Except it’s not with Greenland or Denmark, the only ones who count. So, in this topsy-turvy market stocks fell this past week, the second week in a row. The S&P 500 fell 0.4%, the Dow Jones Industrials (DJI) dropped 0.5%, the Dow Jones Transportations (DJT) fell 0.3% after making all-time highs, while the tech-heavy NASDAQ fell 0.1%. The S&P 400 (Mid) fell 0.6% and the S&P 600 (Small) was off 0.4% with both making all-time highs this past week. Bitcoin fell 6.4%. The S&P 500 Equal Weight Index dropped 0.1% after making all-time highs.
In Canada, the TSX Composite rose 0.3% to all-time highs while the TSX Venture Exchange (CDNX) was up 5.8% to new 52-week highs. In the EU, the London FTSE fell 0.8%, the EuroNext was down 1.4%, the Paris CAC 40 was off 1.4%, and the German DAX fell 1.6%. Asia fared better as China’s Shanghai Index (SSEC) rose 0.8%, the Tokyo Nikkei Dow (TKN) was down 0.2%, Hong Kong’s Hang Seng (HSI) fell 0.4%, and India’s Nifty Fifty was down 2.5%. The MSCI World Index (ex U.S) ETF rose 1.0% to new all-time highs.
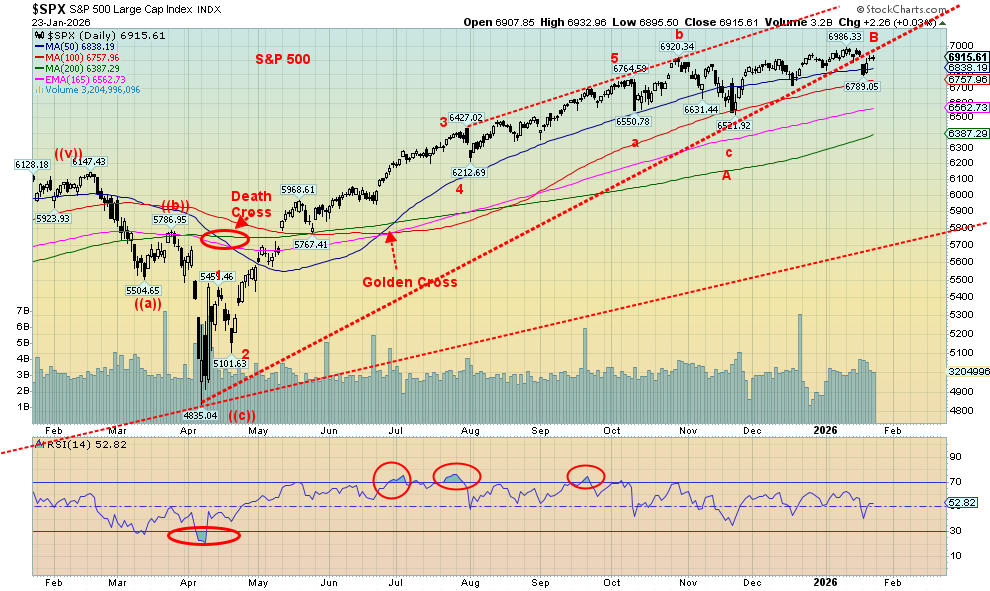
We’ve broken the uptrend, but we can’t begin confirming a top until we break under 6,500 near the most recent good low. Under 6,200 the breakdown is well underway. Failure to take out that all-time high at 6,986 is also a negative sign. But we won’t know until we break under 6,500. Every time we think the market might break to the downside or we go higher to new all-time highs. However, this is not a market to chase. The smart money has been selling. The former leaders (i.e., the MAG7 and FAANGs) are not leading any longer. That suggests to us that the next good move should be to the downside. It’s caveat emptor, especially for the U.S. markets. But new highs can’t be ruled out until we break. Canada, on the other hand, has been held up by golds, metals, and materials, sectors that are not dominant in the U.S. markets.
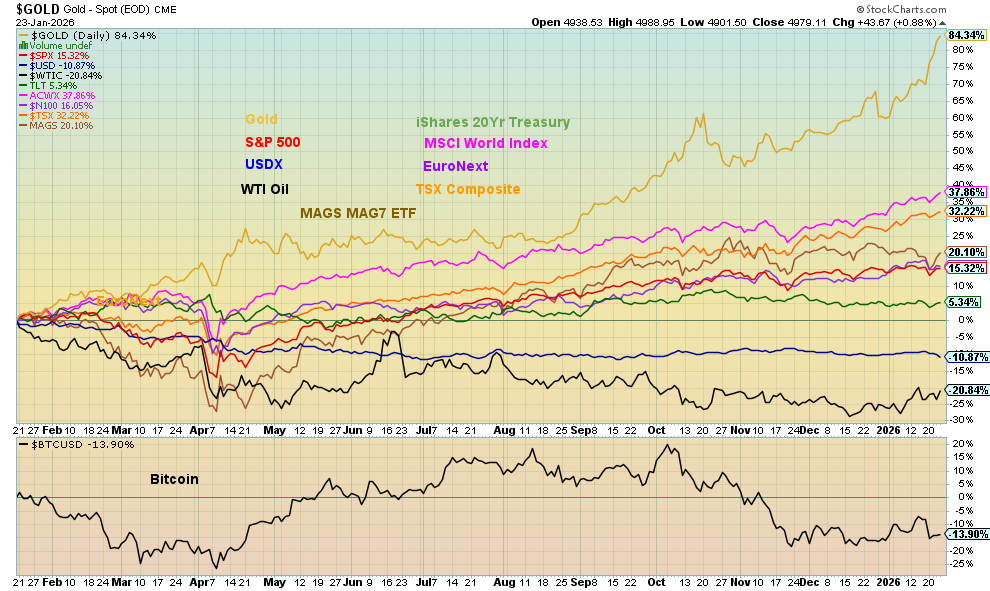
Selected Performance since Inauguration Day, January 20, 2025
Source: www.stockcharts.com
Leaping further into the lead is gold, now up 84.3% since Election Day on November 4, 2024. An incredible run. It’s still a distant second to the MSCI World Index (ex US) ETF (ACWX), which is up 37.9%. WTI oil remains the drag, down 20.8%, while Bitcoin is down 13.9% and the US$ Index is off 10.9%. If silver were posted, we would note it is up 239.4%. Remarkable.
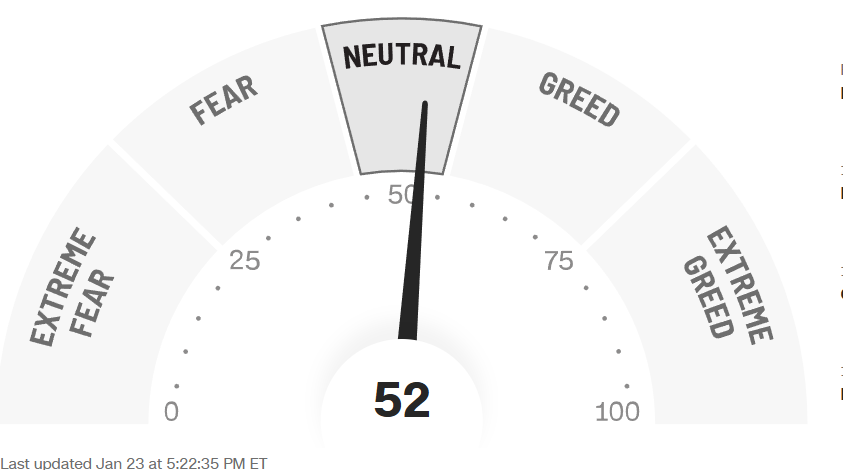
Fear & Greed Index
Source: www.cnn.com
Given the weakness in the markets this past week, the CNN Fear & Greed Index has fallen back to neutral from greed. The put/call ratio and safe haven demand indicate extreme fear. However, junk bond demand and new 52-week highs vs. new 52-week lows indicate extreme greed. No wonder the index came up in the middle. The CNN Fear & Greed Index is an alternative to the VIX Volatility Index.
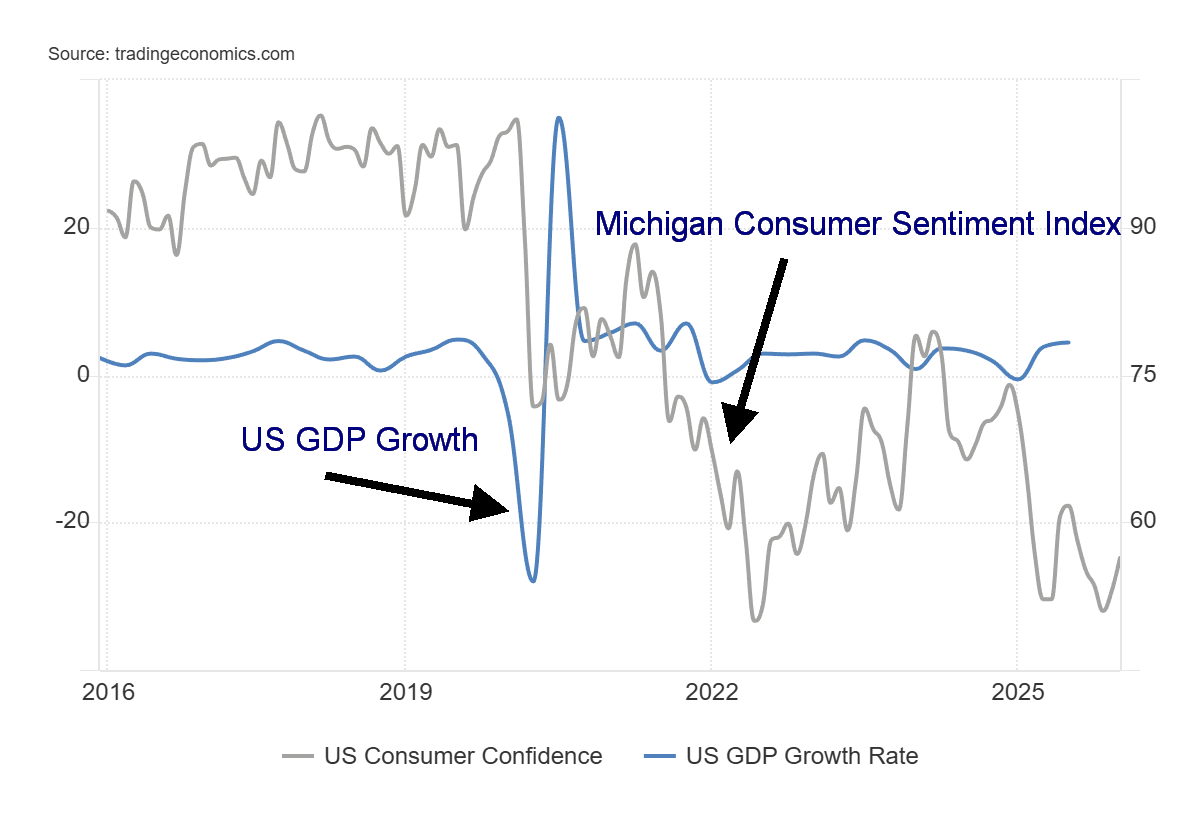
U.S. GDP Growth (quarterly), Michigan Consumer Sentiment Index 2016-2026
Source: www.tradingeconomics.com, www.bea.gov, www.umich.edu
U.S. Q3 growth surprised jumping to 4.4% above the forecasted 4.3% and the Q2 growth of 3.8%. With a negative Q1 GDP growth thus far for 2025 is 2.5% which is above expectations. Growth in Q3 was driven by a rise in exports and a decline in imports which is an addition to GDP. There was also less drawn from inventories and a rise in U.S. government spending. The Michigan Consumer Sentiment Index also surprised rising to 56.4 in Janauary 2026. Still, it remains 20% below a year ago and at levels associated with steep recessions as in 1980-1982, the global financial crisis 2007-2009 and the pandemic 2020. And we are not even in an official recession yet.
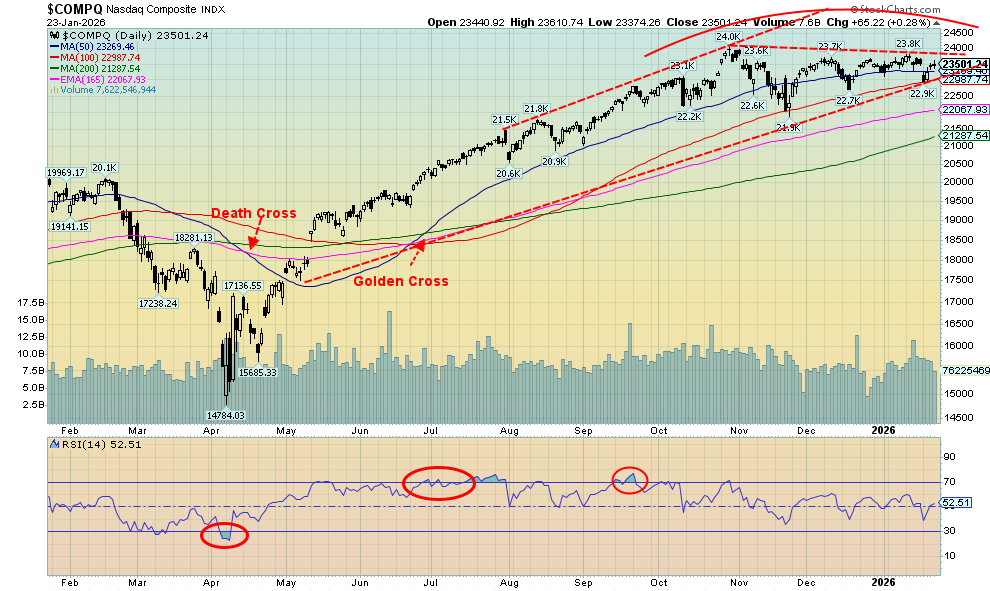
Source: www.stockcharts.com
The NASDAQ continues to form what could be a top. However, we won’t know that for sure until we break down under 23,000 and even more so under 22,000. A breakout above 24,000, however, would signal the opposite, that the NASDAQ is going higher. Still, amongst the major indices, the NASDAQ is the only one that hasn’t made new all-time highs this year. It’s probably why the MAG7 is faltering and technology in general is losing some of its lustre. The NY FANG Index fell 0.8% this past week while the NASDAQ was down only 0.1%. Of the technology stocks, Apple fell 2.9% and Google fell 0.6% but the remaining five rose, led by Meta, up 6.2%. The big winner on the week was Advanced Micro (AMD), up 12.1%. Broadcom (AVGO) fell 9.0%, leading the downers.
We are not going to argue against an upside breakout as the pattern could be an ascending triangle with rising bottoms and a relatively flat top. So, watch the upside breakout as well. It’s been that kind of year. Things change on a whim.
Source: www.stockcharts.com
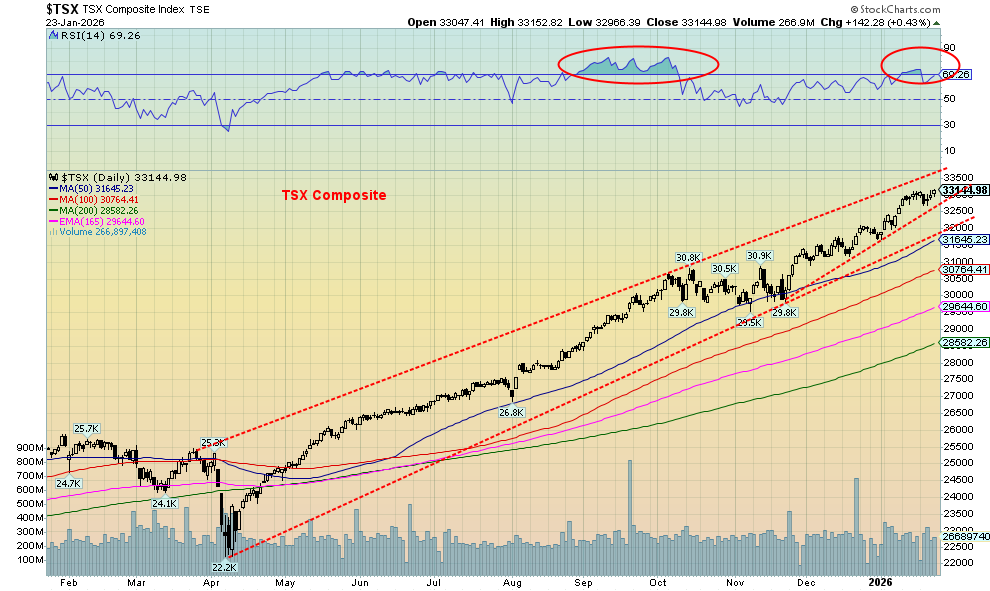
The TSX Composite continues to rise, making all-time highs just as it did in 2025. The TSX rose 0.3% this past week, even as the U.S. indices faltered – thanks once again to the rise of Golds, Metals & Mining, and Materials. All three sub-indices rose this past week with Golds (TGD) up 7.9%, Metals & Mining (TGM) up 6.4%, and Materials (TMT) up 7.0%, all to record highs. Six sub-indices were up this past week, the other ones being Energy (TEN), up 2.7% to new 52-week highs, Telecommunications (TTS), up 1.7%, and Consumer Staples (TCS) up 1.8%. Leading the downside was Information Technology (TTK), off 6.4%. In a bit of divergence, the TSX 60 fell 0.5% on the week. The TSX 60 just doesn’t have the same percentage of gold, metals, and material stocks that are in the broader index.
We still look like we might have more room to move higher, but it all depends on the big three: golds, metals, and materials. The bull channel suggests potential up to 33,500. The breakdown starts under 32,500 and especially under 31,500. Long-term support is down to 28,500.
U.S. 10-year Treasury Note, Canada 10-year Bond CGB
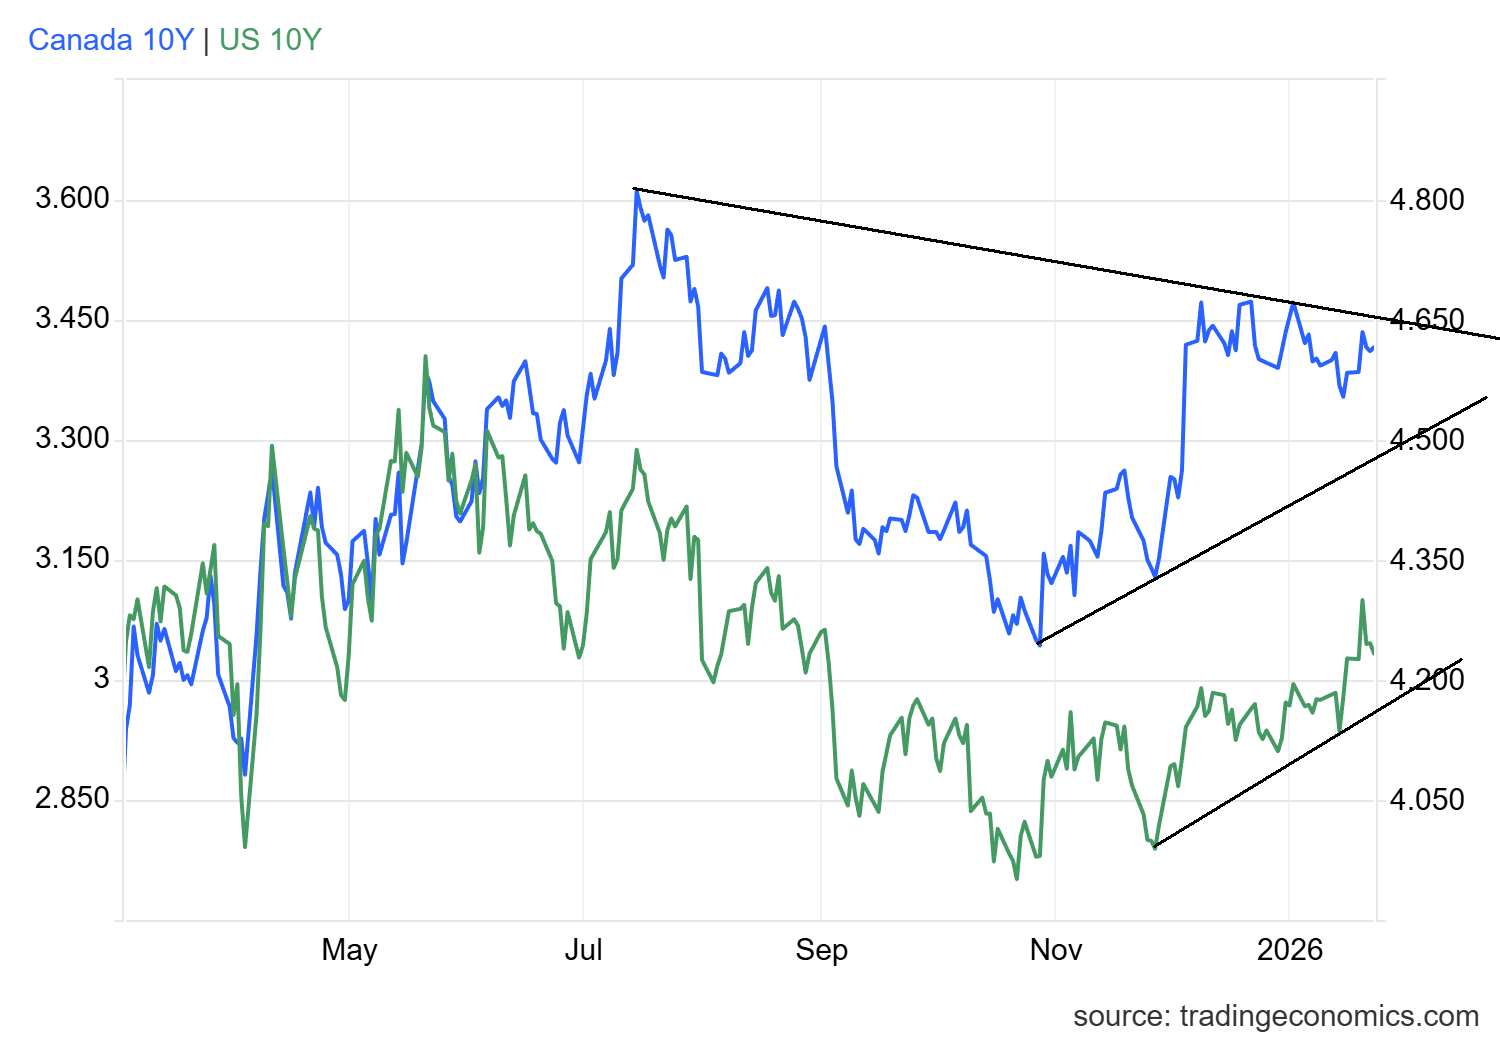
Source: www.tradingeconomics.com, www.home.treasury.gov, www.bankofcanada.ca
U.S. longer term interest rates bounced back and forth this past week, actually hitting a five-month high before settling back. Overall movement was minimal with the U.S. 10-year Treasury note unchanged, although the Canadian Government of Canada 10-year bond (CGB) went from 3.38% to 3.42%. Our 2–10 spreads were unchanged on the week, still signaling recession ahead.
It seems that President Trump’s flip-flops had interest rates rising, then falling back this past week. The University of Michigan’s Sentiment Indicator also improved this past week, which kept yields from falling, with the pressure largely to the upside. This coming week, the FOMC meets on January 27–28 and the market is widely expecting the Fed to leave rates unchanged. The Bank of Canada (BofC) also meets, and they too are expected to leave interest rates unchanged. That won’t please President Trump. Expect some noise. Most analysts are not expecting any rate cuts until June. By then a new Fed chair will be in place. But current Fed Chair Jerome Powell has indicated he will most likely stay on as a Fed governor until his term is up in two more years. Longer term note and bond yields remain elevated, thanks to sticky inflation and economic numbers that still indicate growth in the U.S.
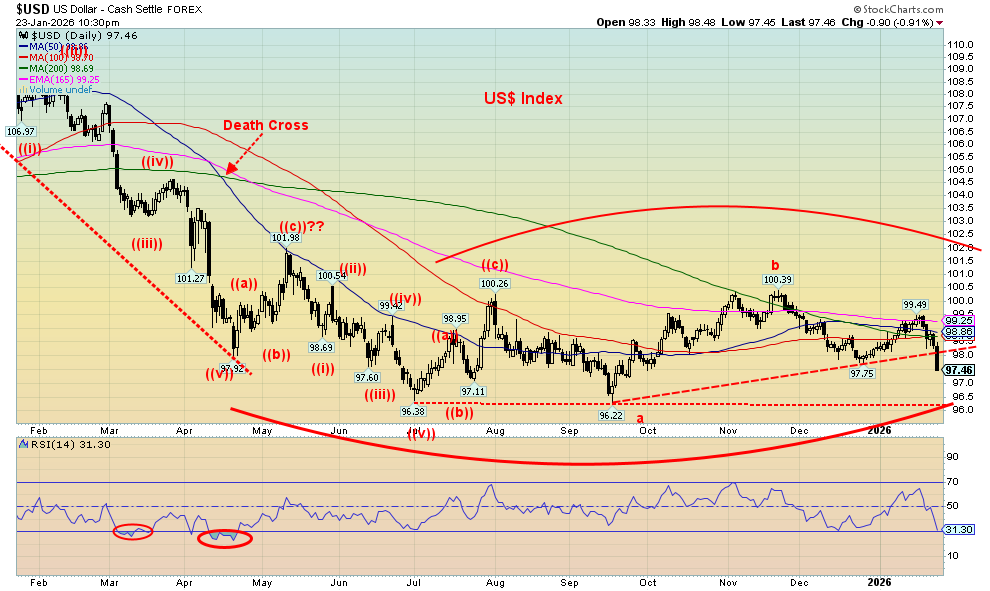
Source: www.stockcharts.com
Given President Trump’s unpredictability on economic matters (on/off tariffs), the US$ Index finally reacted negatively, tumbling 1.9% this past week and breaking support. It was the biggest drop in 8 months. The recent lows at 96.22 are now looking into sight. Below 97.20 new lows beckon. Regaining that recent high at 99.49 would instead point us higher. That looks more remote now. Under 96 we could target down to 91.80. The all-time low for the US$ Index is 70.70, seen in 2008 during the financial crisis. Since the gold standard ended in August 1971, the US$ Index has lost over 20% of its value. No, it hasn’t been straight down. From that all-time high in 1985 the US$ Index has fallen 40%. That’s not what one would expect from the world’s reserve currency. But as we’ve noted, reserve currencies come and go. They don’t last forever. We’re not expecting the demise of the U.S. dollar anytime soon, but its ongoing weakening is a concern. The collapse of a reserve currency is usually accompanied by global volatility, including global war (or its equivalent, going back thousands of years).
As for the currencies, the euro rose about 2%, the Swiss franc was up 3%, the pound sterling rose about 2%, while the Japanese yen jumped 1.5% despite making 52-week lows earlier. The Cdn$ was up 1.7%. Good week for the currencies. Not so good for the US$. Despite the gains this past week, all fiat currencies have been losing value for years. No wonder gold and silver have been rising. Both used to be money and under the current circumstances one is better off in gold and silver than in fiat (paper) currencies.
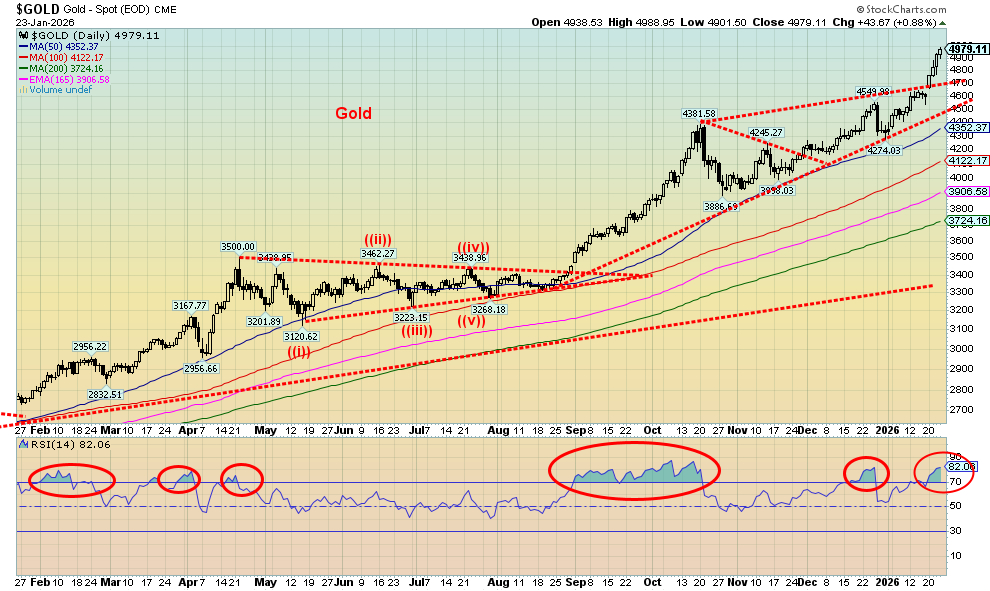
Source: www.stockcharts.com
What a week for gold and the precious metals. Or maybe we should say it’s just another day at the office. It seems that when President Trump opens his mouth the precious metals leap again. He’s having that effect on them.
The long-predicted $5,000 for gold is within grasp. We broke out of that rising consolidation pattern solidly this past week as gold gained 8.4%, now up 15.5% on the year. Keep that up and we’ll rise almost 100% in 2026. Naturally, gold made all-time highs. But then along came silver and it blew gold away, rising 14.3%. It is now up almost 44% in 2026. Not to be left behind, platinum surged 18.4% and is now up 35% in 2026. The gold indices kept up with the Gold Bugs Index (HUI), up 10.3%, and the TSX Gold Index (TGD), up 7.9%. By comparison, the gold stocks seemed reluctant to rise higher. Still, they are up 26.1% and 24.1% so far in 2026. What a time to be a gold bug.
The ascending triangle that formed from October to just recently suggests a target up to at least $5,200. At this rate we’ll be there by January 31. No, don’t count on this every week. Overbought may be just a state of mind but corrections do happen, often suddenly. Has gold moved from being a safe haven to a highly speculative asset like Bitcoin? It’s difficult to say, but if Bitcoin is the comparison, then we have a lot further to rise. The mass of retail is still not in, and many portfolio managers still have a low exposure to gold in their portfolios. They are still not talking endlessly about gold on CNBC. When the talking heads are frothing about gold, the top is probably nearby.
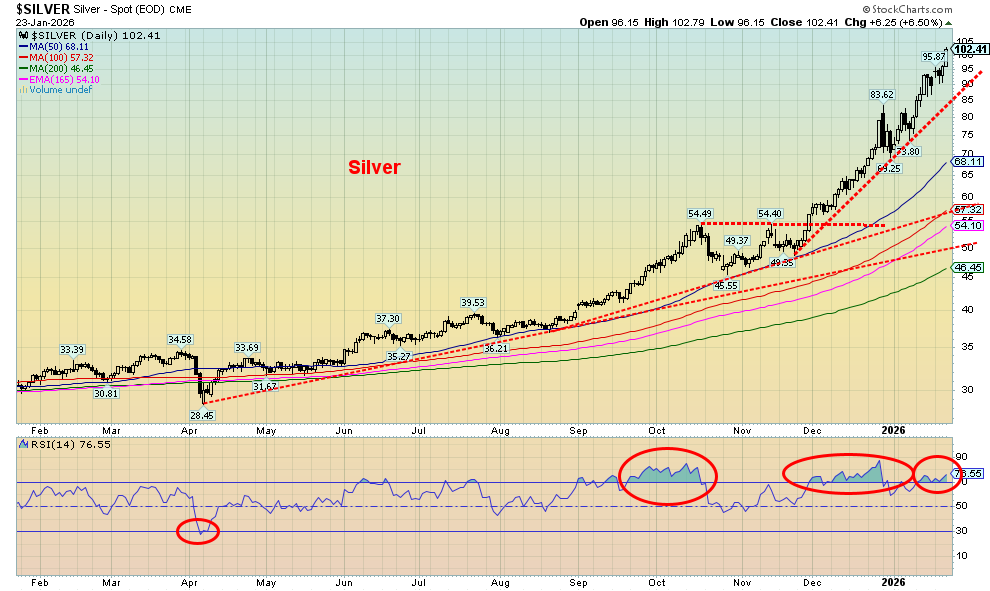
Source: www.stockcharts.com
Silver crossed $100 this past week (close $102.41), a level called for by many analysts over the years that nobody believed would ever happen. Not even what appeared to be an outside day key reversal on December 29, 2025, has stopped the rise. The downside lasted for a couple of days before the upswing continued.
“Silver bugs are gold bugs on steroids, methamphetamines, Red Bull, and
Jack Daniels...” (anonymous)
(Thanks, Mike, good quote)
We’re overbought. But we were overbought in September and October 2025 before a correction set in. Then we were overbought again through December before that reversal set in. As my colleague Mike Ballanger (GGM Advisory Inc.) says, overbought doesn’t seem to matter much these days. It’s just a state of mind. But don’t get complacent. A correction could start anytime. Nonetheless, hitting over $100 is momentous. Now the silver bugs are ardently calling for $200, $300, $500. Some things you do have to take with a grain of salt. Yes, they could be right, but when and how long will it take to get there? To the silver bugs, that could be tomorrow. Yes, supply shortages continue and silver is an important (critical?) industrial metal.
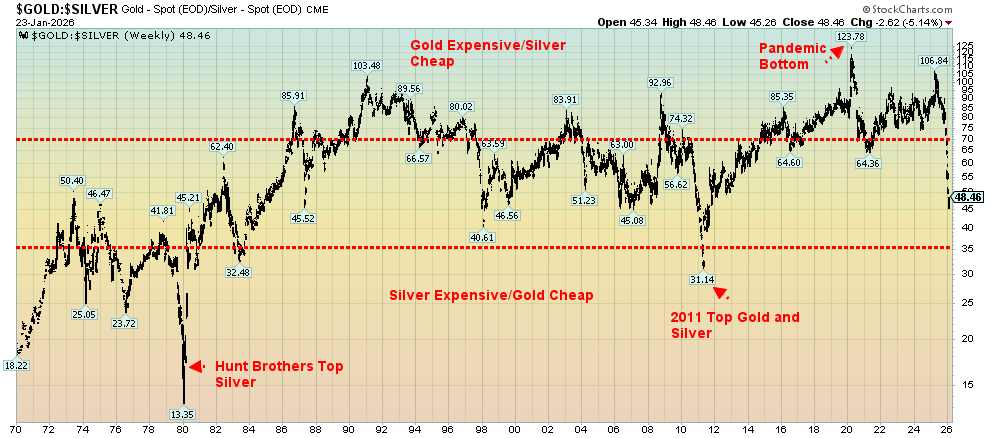
After years of the gold:silver ratio at levels where gold was favoured, the tide has turned. The gold:silver ratio peaked at 123.78 during the pandemic. Now it is at 48.46 and falling in favour of silver. Could we break down to that 1980 low at 13.35? Silver bugs will feel their heads explode. At that ratio and keeping gold at its Friday close of $4,979, silver would be $372. Even at that 2011 low of 31.14, silver would be $160. Suddenly, $300 silver doesn’t seem so impossible after all.
Gold/Silver Ratio 1970–2026
Source: www.stockcharts.com
Source: www.stockcharts.com
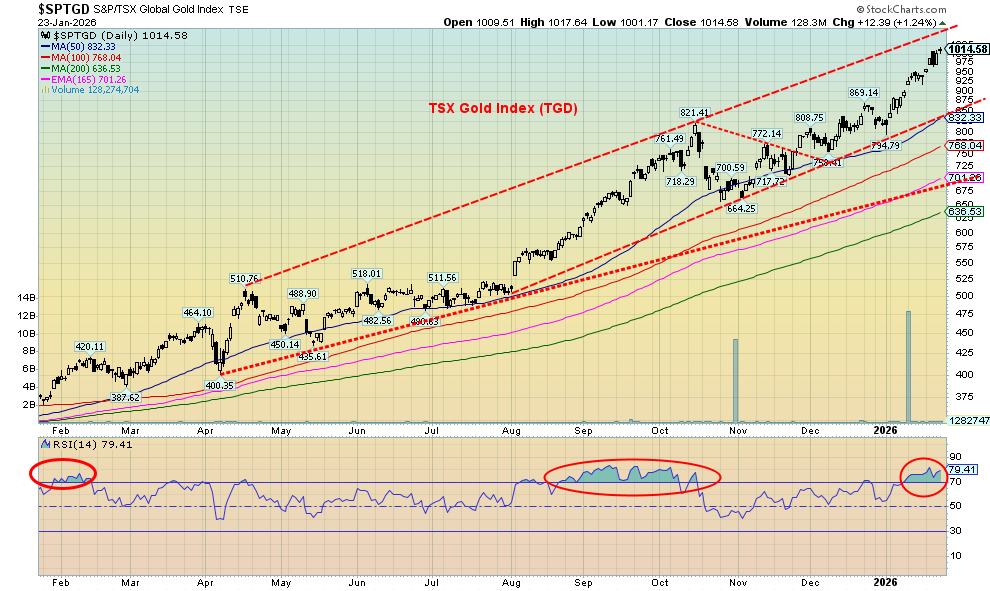
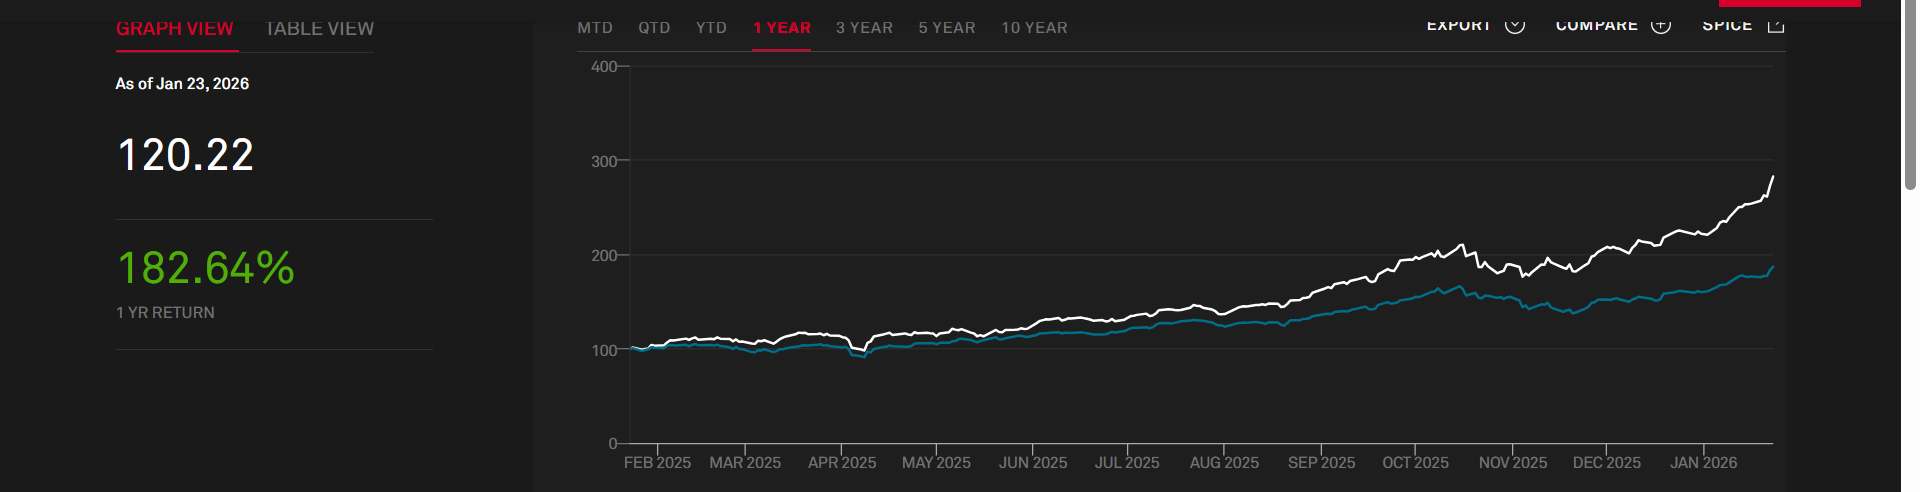
We’d call the TSX Gold Index (TGD) the seventh wonder of the world, but the title is already taken, mostly by a group of ancient wonders. Nonetheless, it is impossible to ignore the rise of the gold stocks over the past year. In 2025 the TGD gained almost 143%. It’s only three weeks into 2026 but the TGD is already up 24%. And we may be just getting underway. The TSX Venture Exchange Metals & Mining Index is up 182.6% in the past year, compared to a gain of 87.1% for the TSX Venture Exchange (CDNX). The junior miners’ rise is, we believe, just getting underway. The all-time high for the CDNX is over 3000 vs. 1000 today.
This past week the TGD gained 7.9% while the Gold Bugs Index (HUI) was up 10.3%. The CDNX gained 5.8% and is now up 16.9% in 2026. For the gold stocks it has been a golden year. The gold bugs are running around bug-eyed with glints in their eyes. Can this continue? We’re overbought. Overbought is, however, just a state of mind. We were overbought from August to October, but we just kept going higher. The bull channel breaks under 830 (50-day MA). So, it’s a level to keep in mind. That break level rises as we go higher. Both the TGD and HUI printed all-time highs this past week while the CDNX made 52-week highs.
Corrections will come, but at this stage we do not see any major top forming. The trend is solidly to the upside. However, profit-taking along the way is wise. Beware of complacency setting in.
S&P Venture Exchange Metals & Mining Index vs. the TSX Venture Exchange (CDNX) 2025–2026
Source: www.spglobal.com
Source: www.stockcharts.com
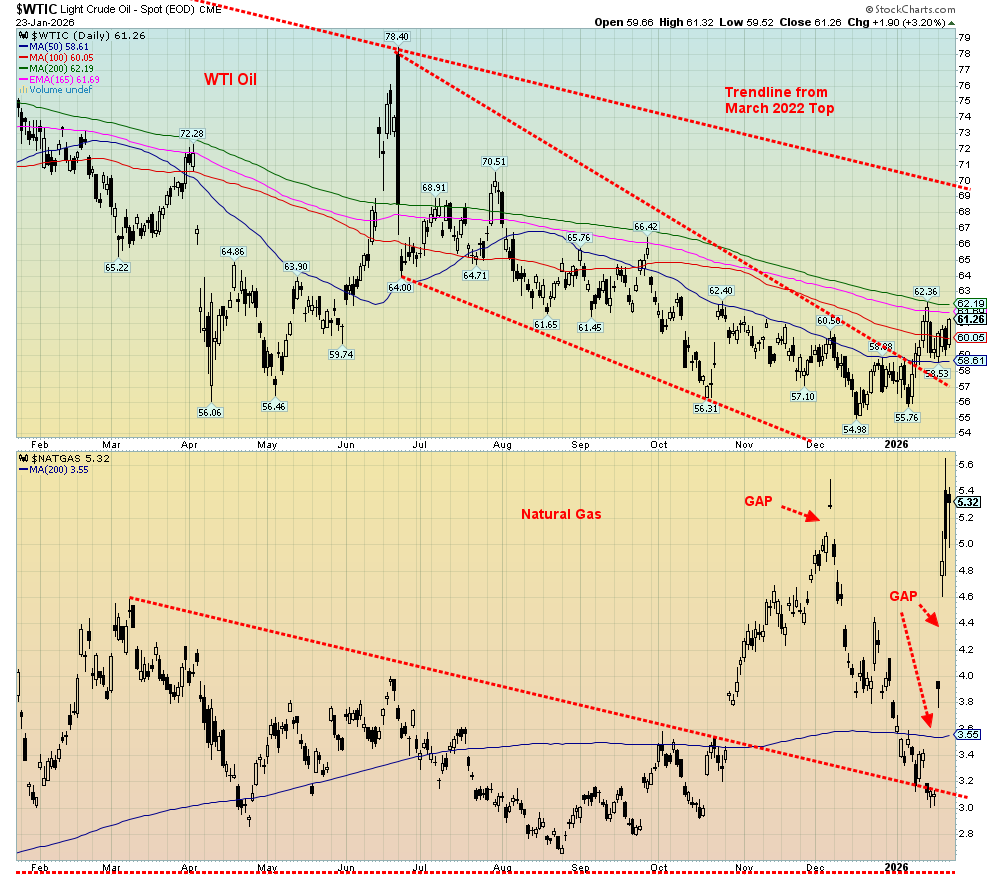
Thanks to Trump, oil prices have only gone up in 2026. No, not the kind of gains we’ve seen for gold, silver, and gold stocks but gains, nonetheless. So far, WTI oil is up 6.7% in 2026, while Brent crude is up 8.9%. The energy stocks are up too with the ARCA Oil & Gas Index (XOI) up 7.6% while the TSX Energy Index (TEN) is up 8.2%. Certainly, that’s better than in 2025 when WTI oil fell almost 20% and Brent was down 18.6%.
So, what gets oil going? Well, for starters, the U.S. sending an armada to the Persian Gulf and the Gulf of Oman, poised to potentially attack Iran. The U.S. has also threatened to bomb Iran. That works. Leave aside that Iran rearmed heavily after the previous attack by the U.S. and Israel with missiles that could hit U.S. bases in the region and Israel. As well, there is always the sticky problem of the Straits of Hormuz where 25%–30% of the world’s oil flows through. Iran can’t block it, but it can make things difficult. Nothing like geopolitical factors to get oil prices moving upward.
This past week, WTI oil gained 3.0% while Brent crude jumped 3.1%. The XOI gained 2.0% while the TEN was up 2.7%. Both indices climbed to new 52-week highs. Helping things along was an IEA report suggesting that the oversupply should ease in 2026. Not to be left out is natural gas (NG) that soared up 71.1% at the Henry Hub and 4.9% at the EU Dutch Hub. NG is up 43.4% and at the Dutch Hub up 39.6% thus far in 2026. Brrrrr, it’s cold. Add-in the threats of a massive snow and ice storm and NG prices soared, leaping higher with barely a pause. It was the story of the week. Many are also seeing their heating bills soar raising affordability issues.
Those gaps look like running gaps or measuring gaps, suggesting that NG could go even higher. Note the gap back in December at the top. That was an exhaustion gap. No sign of that yet, although on the high day (new highs) NG made the high and then reversed down. Could it be a top? Time will tell. The gap below is enticing and, if filled down to $4 or lower, the top is in. Meanwhile, WTI oil might be poised to take out the recent high at $62.36. A close above $63 will suggest the low is in. Nonetheless, WTI oil has a way to go to that major resistance seen at $69/$70.
There’s nothing like threats of war in a major oil zone and freezing temperatures to get things going. We are also in a seasonally positive time for energy that can last until June, at least. We’re now expecting a larger move from the energy sector that will really break upwards if the U.S. attacks Iran.
Copyright David Chapman 2026
GLOSSARY
Trends
Daily – Short-term trend (For swing traders)
Weekly – Intermediate-term trend (For long-term trend followers)
Monthly – Long-term secular trend (For long-term trend followers)
Up – The trend is up.
Down – The trend is down
Neutral – Indicators are mostly neutral. A trend change might be in the offing.
Weak – The trend is still up or down but it is weakening. It is also a sign that the trend might change.
Disclaimer
David Chapman is not a registered advisory service and is not an exempt market dealer (EMD) nor a licensed financial advisor. He does not and cannot give individualised market advice. David Chapman has worked in the financial industry for over 40 years including large financial corporations, banks, and investment dealers. The information in this newsletter is intended only for informational and educational purposes. It should not be construed as an offer, a solicitation of an offer or sale of any security. Every effort is made to provide accurate and complete information. However, we cannot guarantee that there will be no errors. We make no claims, promises or guarantees about the accuracy, completeness, or adequacy of the contents of this commentary and expressly disclaim liability for errors and omissions in the contents of this commentary. David Chapman will always use his best efforts to ensure the accuracy and timeliness of all information. The reader assumes all risk when trading in securities and David Chapman advises consulting a licensed professional financial advisor or portfolio manager such as Enriched Investing Incorporated before proceeding with any trade or idea presented in this newsletter. David Chapman may own shares in companies mentioned in this newsletter. Before making an investment, prospective investors should review each security’s offering documents which summarize the objectives, fees, expenses and associated risks. David Chapman shares his ideas and opinions for informational and educational purposes only and expects the reader to perform due diligence before considering a position in any security. That includes consulting with your own licensed professional financial advisor such as Enriched Investing Incorporated. Performance is not guaranteed, values change frequently, and past performance may not be repeated.
About the author


Website: https://www.enrichedinvesting.com
Disclaimer: David Chapman is not a registered advisory service and is not an exempt market dealer (EMD) nor a licensed financial advisor. We do not and cannot give individualised market advice. David Chapman has worked in the financial industry for over 40 years including large financial corporations, banks, and investment dealers. The information in this newsletter is intended only for informational and educational purposes. It should not be considered a solicitation of an offer or sale of any security. The reader assumes all risk when trading in securities and David Chapman advises consulting a licensed professional financial advisor before proceeding with any trade or idea presented in this newsletter. David Chapman may own shares in companies mentioned in this newsletter. We share our ideas and opinions for informational and educational purposes only and expect the reader to perform due diligence before considering a position in any security. That includes consulting with your own licensed professional financial advisor.