
What a week for gold and silver. Soar to new, unheard of heights, then they leaped off the cliff. At least that's what it looks like. A negative reaction to the CME raising margin rates again, and suddenly a sell-off became a panic as others piled on, particularly for silver, which suffered its worst day ever on Friday. It even made the Hunt Brothers debacle of 1980 look like a Sunday school picnic. Still, both gold and silver posted gains for the month. A period of consolidation should now follow, as the sell-off was technical, not fundamental. It was also a paper dump, not a physical dump, as spreads widened between paper and physical.
Volatility reigns. Not only did gold and silver soar, then crash, but the US$ Index broke down as well. President Trump is threatening everyone, wars continue, and we're no closer to peace, and chaos on the streets of America continues. A new Fed Chair was appointed, Kevin Warsh. Is he a hawk or a dove? Will he follow the President's instructions or continue to be independent as the Fed is supposed to be? Warsh still needs to be confirmed by the Senate. Word is Powell plans on staying on as a governor as long as he is allowed to.
The S&P 500 made a lonely walk to new all-time highs, but no one else followed. Then stock markets wavered on the last couple of days of the month. Have we topped? We list points to watch for confirmation of a top. Our chart of the week is about silver. Timely, considering we prepared it before Friday's crash. Oil prices rose again, and the energy indices hit new 52-week highs. CES Energy Solutions Corp., for example, providing oilfields with chemical solutions, having clients likely to benefit from these price increases, itself is likely to benefit, reported record revenue and increased funds flow from operations, pays a dividend, and is held in the Enriched Capital Conservative Growth Strategy.* Ongoing threats to bomb Iran and now an embargo on oil to be shipped to Cuba helped oil rise.
This coming week, we get the January job numbers for both the U.S. and Canada. They are expected to be weak.
We are away over the next two weekends; however, we will endeavour to post at least a short report.
Snowstorms and now even a bomb cyclone across the U.S. have led to chaos on the roads and thousands of canceled flights. The negative impact of the snowstorms and the chaos on the streets of American cities will show up in Q1 GDP.
Despite all this, have a great week.
DC
* Reference to the Enriched Capital Conservative Growth Strategy and its investments, celebrating a 7.92 -year history of 147.47% growth (annual 12.13%), is added by Margaret Samuel, President, CEO and Portfolio Manager of Enriched Investing Incorporated, who can be reached at 416-203-3028 or msamuel@enrichedinvesting.com This information should not be construed as an offer, or a solicitation of an offer or sale of any security. Past performance does not guarantee future returns
“It is a sobering fact that the prominence of central banks in this century has coincided with a general tendency towards more inflation, not less. [I]f the overriding objective is price stability, we did better with the nineteenth-century gold standard and passive central banks, with currency boards, or even with ‘free banking.’ The truly unique power of a central bank, after all, is the power to create money, and ultimately the power to create is the power to destroy.”
—Paul Volcker, American economist, 12th Chairman Federal Reserve 1979–1987, President of the Federal Reserve Bank of New York 1975–1979, Chair President’s Economic Recovery Advisory Board 2009–2011; 1927–2019
“The gold standard did not collapse. Governments abolished it in order to pave the way for inflation. The whole grim apparatus of oppression and coercion, policemen, customs guards, penal courts, prisons, in some countries even executioners, had to be put into action in order to destroy the gold standard.”
—Ludwig Von Mises, Austrian/American political economist, philosopher of the Austrian School, proponent of classical liberalism, best known work Human Action: A Treatise on Economics (1949); 1881–1973
“The problem with fiat money is that it rewards the minority that can handle money but fools the generation that has worked and saved money.”
—Adam Smith, Scottish economist and philosopher, pioneer of political economy, key figure in the Scottish Enlightenment, called the Father of Economics, well known for his work An Inquiry into the Nature and Causes of the Wealth of Nations (1776); 1723–1790
Things are becoming more “zooey.” Gold screams through $5,000, then barely a pause, and we are through $5,500; silver leaps through $100, then to $120; then both gold and silver reverse and fall sharply in one of the worst wipeouts we’ve ever seen. As well, the US$ Index breaks down. Meanwhile, the streets of U.S. cities, particularly Minneapolis, become more volatile, and the U.S. threatens to bomb Iran, sending oil prices higher. It’s enough to make one’s head explode.
We’ve said it before, and we say it again – volatility. 2026 is shaping up to be a volatile year. If there was complacency in the market, it may soon disappear, to be replaced by fear. Let’s take the U.S. dollar, the world’s reserve currency. The US$ Index has broken uptrend support, dating back to the lows of 2011.
The U.S. dollar is the world’s reserve currency. It has been that way since 1944 and Bretton Woods. Even though Bretton Woods ended in 1971 when President Nixon took the world off the gold standard, the U.S. dollar remained as the world’s reserve currency. Nothing lasts forever, as we’ve seen with so many other currencies that disappeared as the reserve currency. You name it: the Roman denarius, the Roman and Byzantine gold solidus, the Portuguese escudo, the Spanish real, the Dutch guilder, the French franc. the British pound sterling. All had their runs as the world’s reserve currency – but no longer.
Currently, the U.S. dollar makes up 57% of global reserves, 90% of foreign exchange transactions, and 54% of global trade. It used to be higher. Now the U.S. is stating it would like a weaker dollar. Yes, it helps exports. But it also signals weakness. In the past, when the U.S. dollar fell, so did the stock market. Those periods of lows in the US$ Index also coincided generally with lows in the U.S. stock market (marked as equities undervalued). With the breaking of long-term support, we could be headed to another significant drop in the US$ Index, followed by a drop in the stock market. To date, the US$ Index has fallen some 2% already in 2026, after a 9.4% drop in 2025. A weaker U.S. dollar is not good for the stock market or the world.
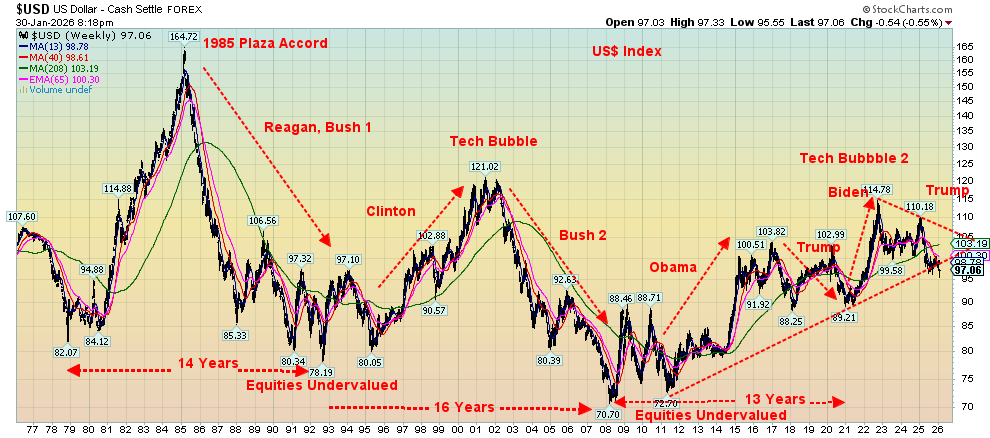
Source: www.stockcharts.com
Japan, which is facing its own problems with rising inflation and a falling bond market (rising yields), has seen the Bank of Japan (BOJ) forced to intervene in the foreign exchange market to help push up the value of the yen. Other currencies have, in turn, traded higher, with the Swiss franc hitting 10-year highs.
The world is facing uncertainty. The Trump administration attacks the Fed and its chairman, Jerome Powell, with a criminal investigation. President Trump openly states he wants lower interest rates. On January 28, at the monthly meeting of the FOMC, the Fed left rates unchanged, citing continued economic growth and sticky inflation. A new Fed chairman is to be appointed to replace Powell when his term is up in May. But will the new Fed chair be tainted? The choice: Kevin Warsh, a former Fed governor. It’s a wait-and-see if Warsh is a Trump spokesperson or his own Fed head. The danger is if he is viewed as a spokesperson for President Trump. If that happens, the market could lose confidence in the Fed and, by extension, the U.S. That makes the massive $38 trillion U.S. treasury market and the U.S. dollar vulnerable. Note, however, that Warsh still needs to be confirmed by the Senate – not a given if enough Republicans balk at his appointment.
All this alone would plunge the global financial markets into uncertainty. Fed policy becomes uncertain. Add in tariffs and even the volatility on the streets of the U.S., and you have the makings of a crisis. No wonder gold has been soaring as a hedge. Institutions are selling the U.S. dollar. In 2000, the U.S. dollar made up some 70% of global reserves. Today it is around 56%. On the rise have been the euro and the Chinese yuan (renminbi). Significantly, led by the People's Bank of China (PBOC), central banks have been increasing their gold reserve holdings.
Japan Inflation, 10-Y and BOJ Interest Rate 2016–2026
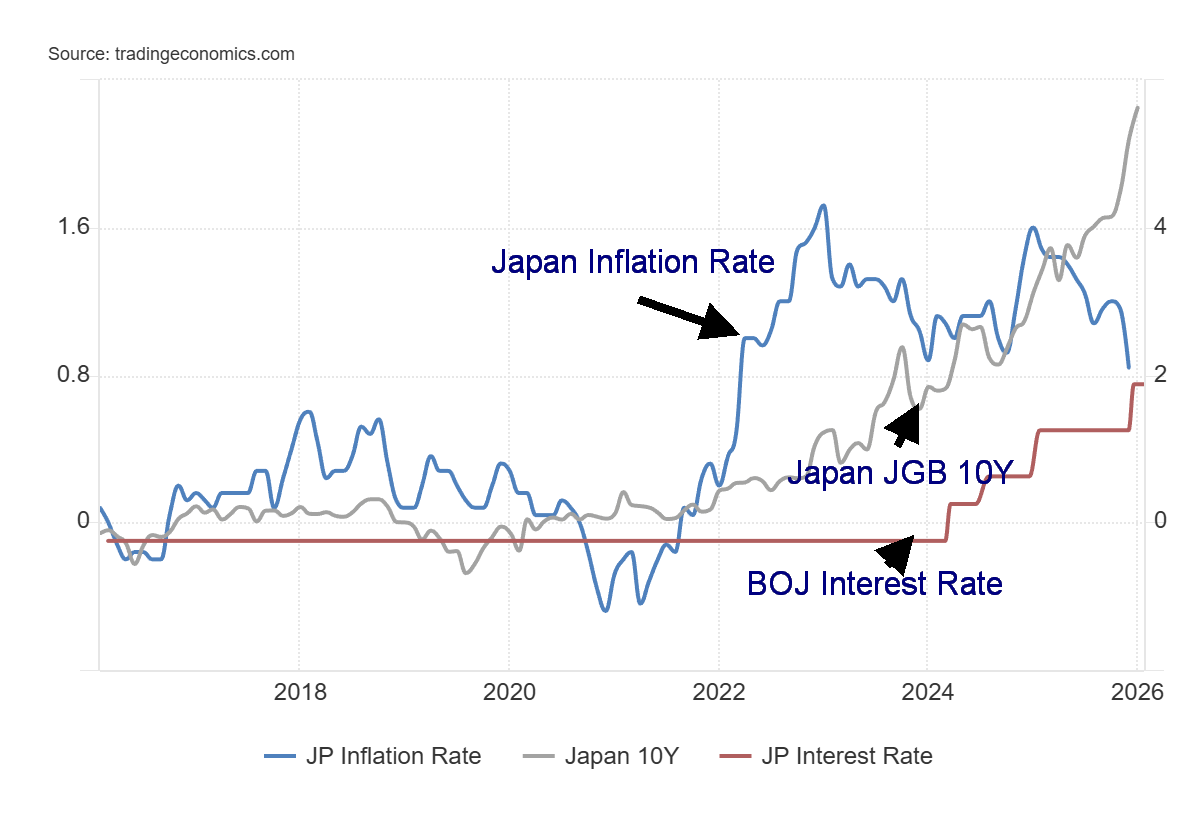
Source: www.tradingeconomics.com, www.stat.go.jp, www.boj.or.jp
As this chart shows, Japan is boxed into a problem. The Japanese yen has been very weak. Inflation rose, the 10-year Japanese bond (JGB) has been rising, while the BOJ has been slow to raise the key interest rate. Inflation at 2.1% is well above the current BOJ rate of 0.75%. The 10-year JGB is trading at 2.25%. Japan has massive debt and a debt/GDP ratio of 252%, the highest in the G7. High interest rates weigh on Japan’s massive debt of $11 trillion. Many believe the BOJ has been operating in the foreign exchange market in an attempt to raise the yen.
That the U.S. dollar has generally held up is largely because the U.S. continues to show GDP growth. But what if that growth slows? No estimates yet for Q4 GDP. But the events in January with killer snow and ice storms and the ongoing strife on the streets of America against the backdrop of more layoff announcements do not bode well for Q1 GDP. GDP growth for 2025 is expected at 2.8%, well above earlier estimates.
The Trump administration talks endlessly about its desire for a weaker dollar. Lower the key Fed rate, and that ought to help push the U.S. dollar lower. That’s good for exports, but a weak currency is a sign of weakness, not strength. The U.S. dollar was overvalued against other major currencies, particularly the Japanese yen and the euro. The Fed’s trade-weighted U.S. dollar index is down only 8.5% from its January 2025 peak vs. a decline of 12.1% for the US$ Index. The Chinese yuan is dominant in the Fed’s Index, with no presence in the US$ Index, which is dominated by the euro.
World – Official Foreign Exchange Reserves by Currency
(Cumulative Total) – 2000–2025
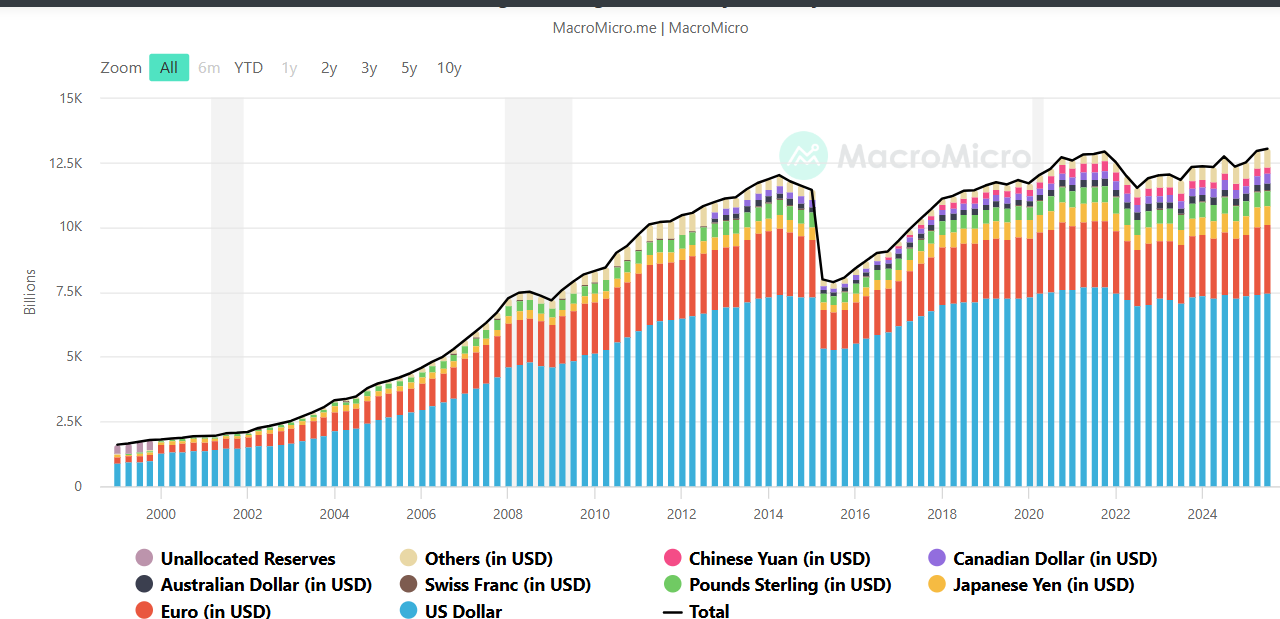
Source: wwww.macromicro.me
Source: www.macromicro.me
Trump’s constant attacks on other countries, particularly the EU and Canada, are not positive for the U.S. dollar. The temptation is for other countries to boost defense spending, which is what we are seeing in both the EU and Canada. This is positive, but it translates into selling dollars and buying euros or Cdn$. Ditto with Japan’s desire to strengthen the yen.
A weaker U.S. dollar is not a panacea for what ails the world’s finances. It could, in fact, put us another step closer to a financial crisis. The appointment of an individual who many see as a Fed dove, beholden to Trump, does not bode well. Jerome Powell, we believe, plans on remaining as Fed governor, even after his term is done and as he is allowed to. That may heighten differences of opinion on the FOMC and may help put the brakes on Kevin Warsh.
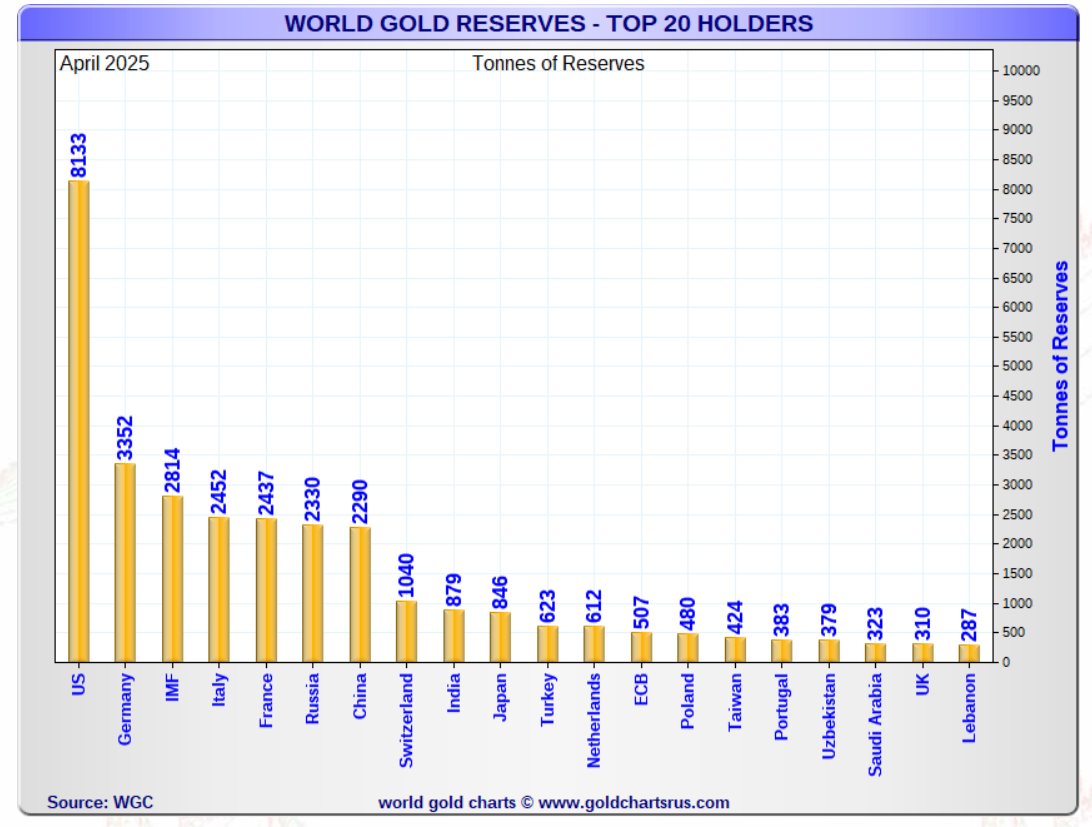
Source: www.goldchartsrus.com, www.gold.org
Chart of the Week
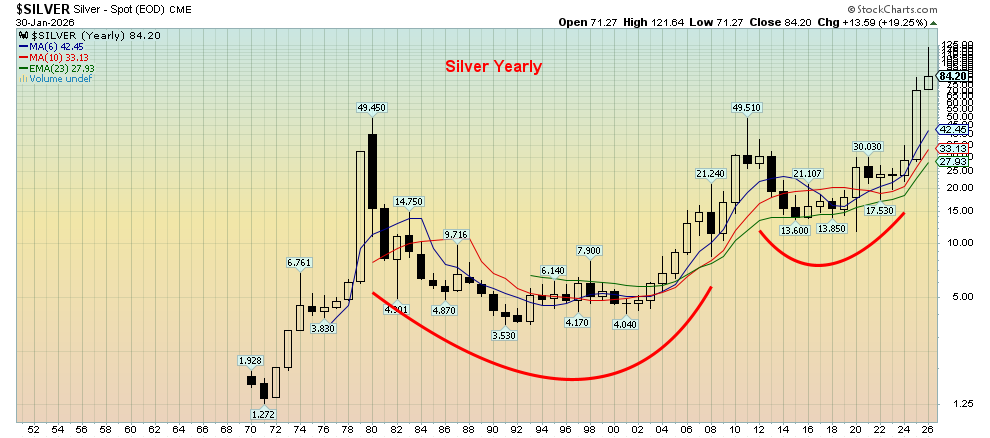
Silver 1970–2026 Yearly
Source: www.stockcharts.com
Was silver in a mania? It certainly looked like it. However, this past week’s wipeout is putting a check on the mania. Silver soared 143% in 2025 and is still up 18% so far in 2026, despite the sharp setback. Were investors just chasing the latest meme/pet rock craze? Gold too has been rising, up 63% in 2025, and has already added another 12.6% in January. Retail investors are starting to jump in. When retail jumps in, it is sometimes a signal that a top is nigh. Yes, physical silver is in short supply, and the premiums are huge. Go to SilverGoldBull.com, www.silvergoldbull.com, www.silvergoldbull.ca, where an ounce of an American silver eagle is offered at US$96, a 12% premium to spot. That is, if they have the product. However, we’ve seen silver offered at 25% premiums, particularly in Asia, and despite the premiums, it’s selling.
It all sounds insane. But maybe it isn’t. It should be. Interest rates are positive, yet both gold and silver have been rising at a much faster pace. We don’t have the inflation/stagflation of the 1970s, a period that saw silver soar to $50 when the Hunt Brothers were trying to corner the market (they failed). Not even 2009–2011, when both gold and silver were rising rapidly because of the 2008 financial crisis, with the saviour being 0% interest rates and massive doses of quantitative easing (QE).
So, what’s going on? As we have explained, this is not an inflation hedge. It’s a solvency crisis. The world is awash with debt, and no more so than the U.S. But the U.S. can’t go bankrupt, can it? Or even Japan, and they have a bigger debt crisis against the backdrop of sharply rising interest rates. The U.S. dollar is the world’s reserve currency. So, they can bail themselves out even as they add upwards of $2 trillion in new debt every year, can’t they?
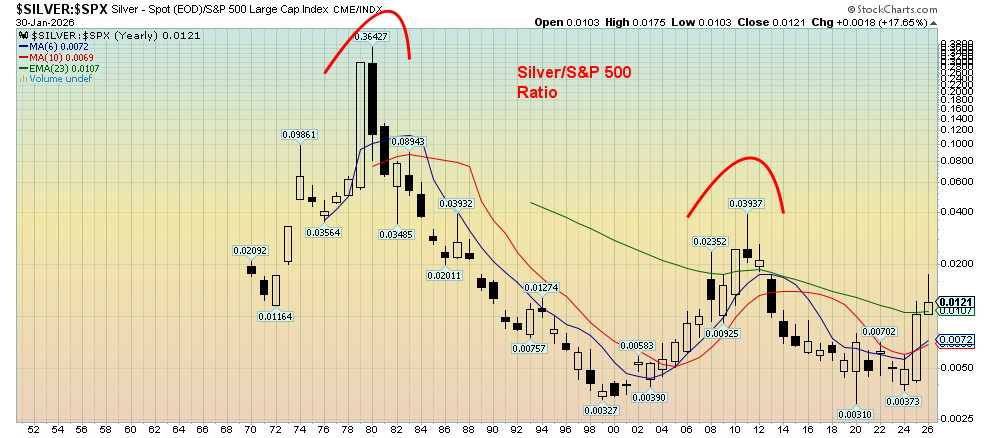
A way of looking at this is through the silver/S&P 500 ratio. We flipped it on its end and, instead of the Dow/Gold ratio, we’re using silver compared to the S&P 500. At the 1980 peak, an ounce of silver could buy 36.5₵ of the S&P 500. Of course, that changed, and by 1999, an ounce of silver could only purchase 0.3₵ of the S&P 500. Fast forward to the 2011 peak, where silver could buy 4₵ of the S&P 500. Silver plunged again, and by 2020, an ounce of silver would again only get you 0.3₵ of the S&P 500. Today, even with silver at record prices that many think are insane, an ounce of silver can only buy 1.2₵ of the S&P 500. That’s a 97% discount to the 1980 peak and a 70% discount to the 2011 peak.
By comparison, silver is cheap today (gold too), or the S&P 500 is too expensive. To reach that 1980 peak, the S&P 500 would have to fall to 305 (which is not likely). Even to reach the 2011 peak, the S&P 500 would have to fall to around 2,800, a 60% drop (note that the S&P 500 fell 57% in 2007–2009). The stock market is pricing in confidence with the U.S. dollar and that the debt is manageable, even with deficits of 6% annually. But now the U.S. dollar is falling (loss of confidence?), and both gold and silver are pricing in loss of confidence as their prices soar. We are nowhere near the levels seen in 1980 and 2011. Today, the stock market does not look like a good bet.
Silver/S&P 500 Ratio 1970–2026 Yearly
Source: www.stockcharts.com
Silver rose over 2,500% from 1971, when the gold standard ended, to its 1980 peak (on a close basis). Where are the Hunt Brothers when you need them? That cup and handle pattern initially projected to around $85. We surpassed that, and the next target was near $108. We have now surpassed that. Third target $144. We’re working on it. A 2,500% move today from that low in 2015 would take us to $340. Stay tuned.
Markets and Trends
|
|
|
|
% Gains (Losses) Trends |
|
||||
|
|
Close Dec 31/25 |
Close Jan 30/26 |
Week |
YTD |
Daily (Short Term) |
Weekly (Intermediate) |
Monthly (Long Term) |
|
|
|
|
|
|
|
|
|
||
|
S&P 500 |
6,845.50 |
6,939.03 (new highs) * |
0.3% |
1.4 |
up |
up |
up |
|
|
Dow Jones Industrials |
48,063.29 |
48,892.47 |
(0.4)% |
1.7% |
up |
up |
up |
|
|
Dow Jones Transport |
17,357.19 |
18,300.31 (new highs) * |
0.6% |
5.4% |
up |
up |
up |
|
|
NASDAQ |
23,241.99 |
23,461.82 |
(0.2)% |
1.0% |
up |
up |
up |
|
|
S&P/TSX Composite |
31,712.76 |
31,923.52 (new highs) * |
(3.7)% |
0.7% |
up |
up |
up |
|
|
S&P/TSX Venture (CDNX) |
987.74 |
1,051.08 (new highs) |
(8.9)% |
6.4% |
up |
up |
up |
|
|
S&P 600 (small) |
1,467.76 |
1,549.15 (new highs) * |
(0.9)% |
5.6% |
up |
up |
up |
|
|
ACWX MSCI World x US |
67.18 |
70.78 (new highs) * |
0.3% |
5.4% |
up |
up |
up |
|
|
Bitcoin |
87,576.98 |
83,860.69 |
(6.1)% |
(4.2)% |
down |
down |
up |
|
|
|
|
|
|
|
|
|
|
|
|
Gold Mining Stock Indices |
|
|
|
|
|
|
|
|
|
Gold Bugs Index (HUI) |
701.49 |
781.28 (new highs) * |
(11.7)% |
11.4% |
up |
up |
up |
|
|
TSX Gold Index (TGD) |
817.76 |
894.80 (new highs) * |
(11.8)% |
9.4% |
up (weak) |
up |
up |
|
|
|
|
|
|
|
|
|
|
|
|
% |
|
|
|
|
|
|
|
|
|
U.S. 10-Year Treasury Bond yield |
4.17% |
4.25% |
0.5% |
1.9% |
|
|
|
|
|
Cdn. 10-Year Bond CGB yield |
3.44% |
3.42% |
flat |
(0.6)% |
|
|
|
|
|
Recession Watch Spreads |
|
|
|
|
|
|
|
|
|
U.S. 2-year 10-year Treasury spread |
0.69% |
0.72% |
16.1% |
4.4% |
|
|
|
|
|
Cdn 2-year 10-year CGB spread |
0.85% |
0.86% |
4.9% |
1.2% |
|
|
|
|
|
|
|
|
|
|
|
|
|
|
|
Currencies |
|
|
|
|
|
|
|
|
|
US$ Index |
98.26 |
97.14 (new iows) |
(0.3)% |
(1.1)% |
down |
down |
down |
|
|
Canadian $ |
72.87 |
0.7345 |
0.5% |
0.8% |
up |
up |
neutral |
|
|
Euro |
117.48 |
118.53 |
0.2% |
0.9% |
up |
up |
up |
|
|
Swiss Franc |
126.21 |
129.37 (new highs) |
0.8% |
2.5% |
up |
up |
up |
|
|
British Pound |
134.78 |
136.82 (new highs) |
0.3% |
1.5% |
up |
up |
up |
|
|
Japanese Yen |
63.83 |
64.61 |
0.6% |
1.2% |
up |
down |
down |
|
|
|
|
|
|
|
|
|
|
|
|
|
|
|
|
|
|
|
|
|
|
Precious Metals |
|
|
|
|
|
|
|
|
|
Gold |
4,311.97 |
4,854.19 (new highs) * |
(2.5)% |
12.6% |
up |
up |
up |
|
|
Silver |
71.16 |
84.20 (new highs) * |
(17.8)% |
18.3% |
up |
up |
up |
|
|
Platinum |
124.81 |
2,414.10 (new highs) * |
(22.5) |
4.6% |
neutral |
up |
up |
|
|
|
|
|
|
|
|
|
|
|
|
Base Metals |
|
|
|
|
|
|
|
|
|
Palladium |
1,619.50 |
1,671.50 |
(18.2)% |
3.2% |
neutral |
up |
up |
|
|
Copper |
5.64 |
5.94 (new highs) * |
flat |
5.3% |
up |
up |
up |
|
|
|
|
|
|
|
|
|
|
|
|
Energy |
|
|
|
|
|
|
|
|
|
WTI Oil |
57.44 |
65.76 |
7.4% |
14.4% |
up |
up (weak) |
down |
|
|
Nat Gas |
3.71 |
4.42 |
21.3% |
18.1% |
up (weak) |
up |
up |
|
Source: www.stockcharts.com
* New All-Time Highs
Note: For an explanation of the trends, see the glossary at the end of this article.
New highs/lows refer to new 52-week highs/lows and, in some cases, all-time highs.
Source: www.stockcharts.com
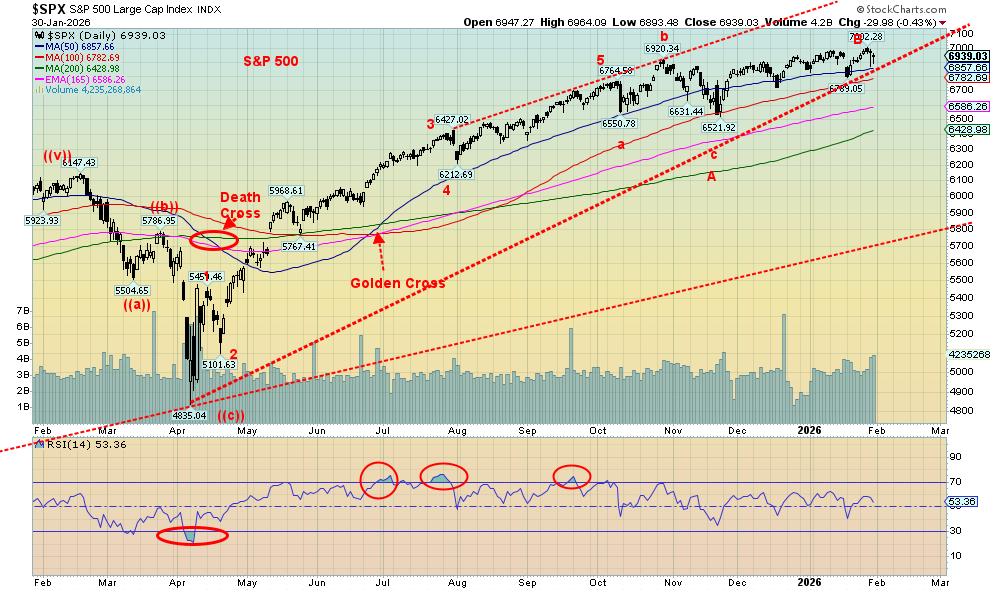
With everyone’s attention on the precious metals crash, the stock indices seemed almost forgotten. They actually didn’t do that much. The S&P 500 made new all-time highs (barely) and then closed up 0.3%. The Dow Jones Industrials (DJI) fell 0.4%, the Dow Jones Transportations (DJT) rose 0.6% to new all-time highs, while the NASDAQ fell 0.2%. The S&P 500 Equal Weight Index fell 0.4%, and the NY FANG Index was off 0.4%. The S&P 400 (Mid) fell 1.4% while the S&P 600 (Small) was down 0.9%. Bitcoin fell 6.1% and was falling further on weekend markets. A portend?
In Canada, the TSX Composite made all-time highs, and then the precious metals crash saw it lose 3.7% on the week. The TSX Venture Exchange (CDNX) also suffered, down 8.9%. In the EU, the London FTSE was up 0.8%, the EuroNext rose 0.5%, the Paris CAC 40 fell 0.2%, while the German DAX fell 1.5%. In Asia, China’s Shanghai Index (SSEC) fell 0.4%, the Tokyo Nikkei Dow (TKN) was down 1.0%, Hong Kong’s Hang Seng (HSI) rose 2.4% to new 52-week highs, while India’s Nifty 50 was up 1.1%. The MSCI World Ex USA ETF was up 0.3% to new all-time highs.
We are close to a breakdown. Under 6,800 would do the trick. Under 6,500 confirms the breakdown. New highs, of course, put it all off to another day. February is not noted for being a great month for stocks. It ranks as the eighth best month for the DJI, but number 11 for the S&P 500 (only September is worse) and number 10 for the NASDAQ. The S&P 500 ended the month up 1.4%, so using the January effect, it is predicting a positive year. The January barometer has an 84% accuracy rate.
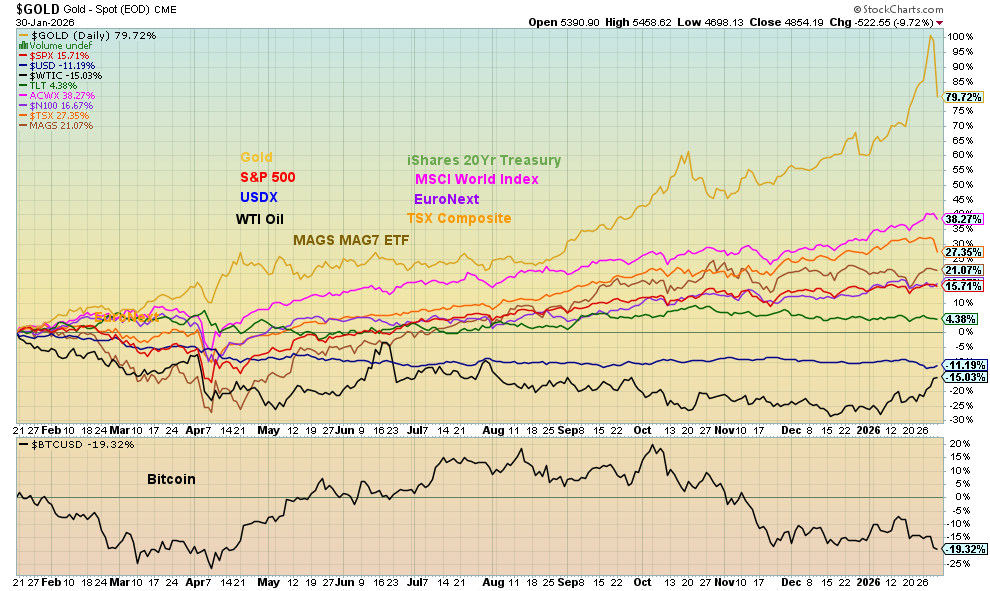
Selected Performance since Inauguration Day, January 20, 2025
Source: www.stockcharts.com
Gold is still in the lead, but this past week it felt like it joined Bitcoin in the cellar. Everybody turned down this past week or was at least relatively flat except for oil prices, which have been slowly rising.
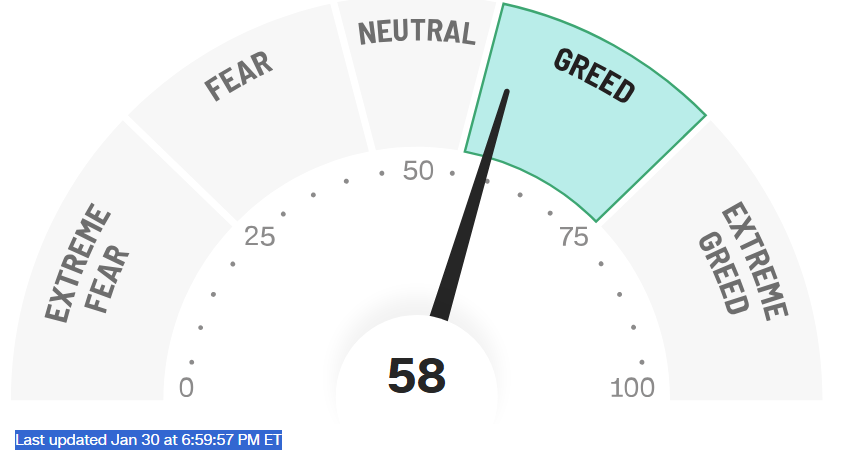
Fear & Greed Index
Source: www.cnn.com
How about that? The S&P 500 made new all-time highs this past week, and we jumped up to greed from neutral. But note that neither the Dow Jones Industrials (DJI) nor the NASDAQ made new all-time highs with them. The Dow Jones Transportation (DJT) squeaked out a new all-time high. All sold off at the end of the week. What does this coming week bring? The Fear & Greed Index is quite split. There is one extreme fear (put/call options), one fear (market momentum), one neutral (market volatility), two greed (stock price breadth, safe-haven demand), and two extreme greed (stock price strength, junk bond demand).
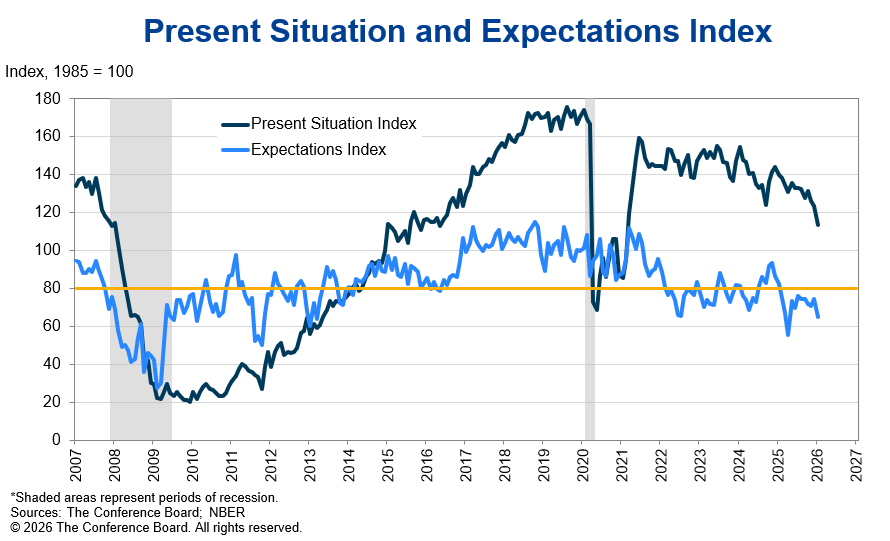
Conference Board Present Situation and Expectations Index 2007–2026
Source: www.conference-board.org, www.nber.org
Consumer confidence continues to sink. The Conference Board’s consumer confidence index fell to 84.5 from 94.2 in December. The present situation index fell to 113.7 vs. 123.6 in December, and the expectations index fell to 65.1 vs. 74.6. The expectations index under 80 has in the past signaled a recession ahead.
www.conference-board.org/topics/consumer-confidence/
Source: www.stockcharts.com
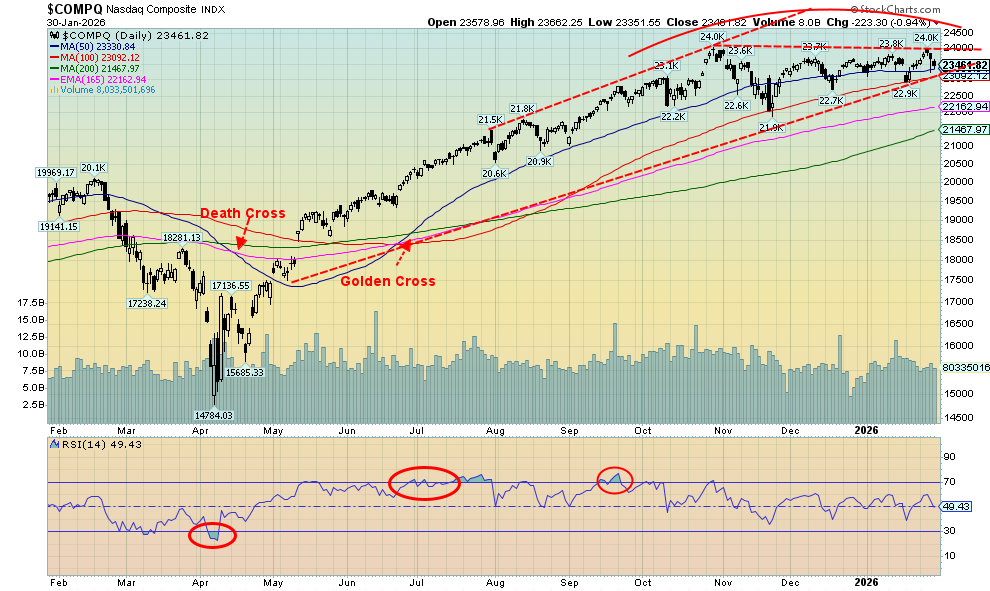
That breakout to the upside for the NASDAQ remains elusive. The pattern looks like an ascending triangle, but it could also be a top. We just have to wait and see which way we break. A breakdown occurs under 23,000, while a breakout to probable new highs is at 24,000. Confirmation of the breakdown occurs under 21,900. The NY FANG Index isn’t cooperating as it fell 0.4% this past week. The NASDAQ fell 0.2%. Microsoft was the culprit as it fell 27.3%, offsetting an 8.8% gain for Meta and a 4.8% gain for Apple. Tesla fell 4.1%. Four of the MAG7 were higher on the week. Snowflake fell 8.3%, AMD was down 8.9%, while ServiceNow fell 12.1%. Not a great week for the techs overall.
Source: www.stockcharts.com
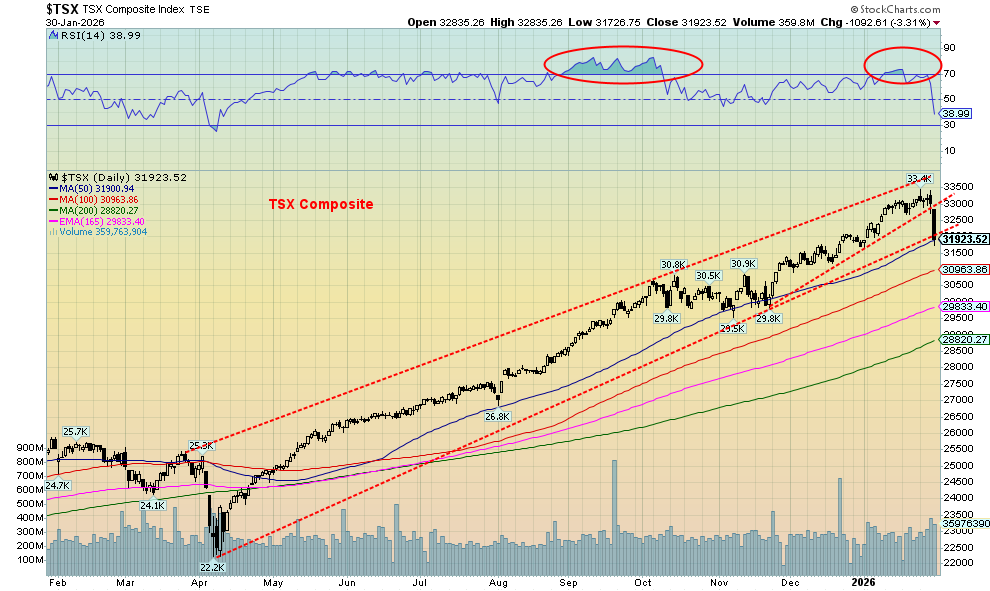
That was a nasty fall for the TSX on Friday when it fell over 1,000 points or 3.3%. The TSX Composite ended the week down 3.7%, all thanks primarily to the collapse of the materials, gold, and metals this past week. The TSX Venture Exchange (CDNX) fared worse, down 8.9% on the week. Despite the fall, the TSX managed to make all-time highs once again. So, a bit of a reversal week. Eleven of the 14 sub-indices fell this past week, led by Golds (TGD), down 11.8%, Metals & Mining (TGM), down 8.5%, and Materials (TMT), off 10.4%. All three made all-time highs before reversing down sharply. Information Technology (TTK) didn’t want to be left behind, so it fell 7.6%. Leading the way up was Energy (TEN) +2.7%, with the only others up being Telecommunications (TTS) +0.3% and Utilities (TUT) +0.8%. The TSX broke 33,000 support, then settled or appeared to be breaking the next support near 32,000 at the 50-day MA. Next support is 28,500–31,000. We appear headed in that direction. The TSX’s largest component, Financials (TFS), fell 2.0% this past week. Only new highs can save this now. Another sharp drop and then the TSX will be oversold. The RSI is at its lowest level since the “Liberation Day” mini-crash last April. Our expectations are that we will see downside follow-through, led once again by the materials group. The upside leader can quickly become the downside leader.
U.S. 10-year Treasury Note, Canada 10-year Bond CGB
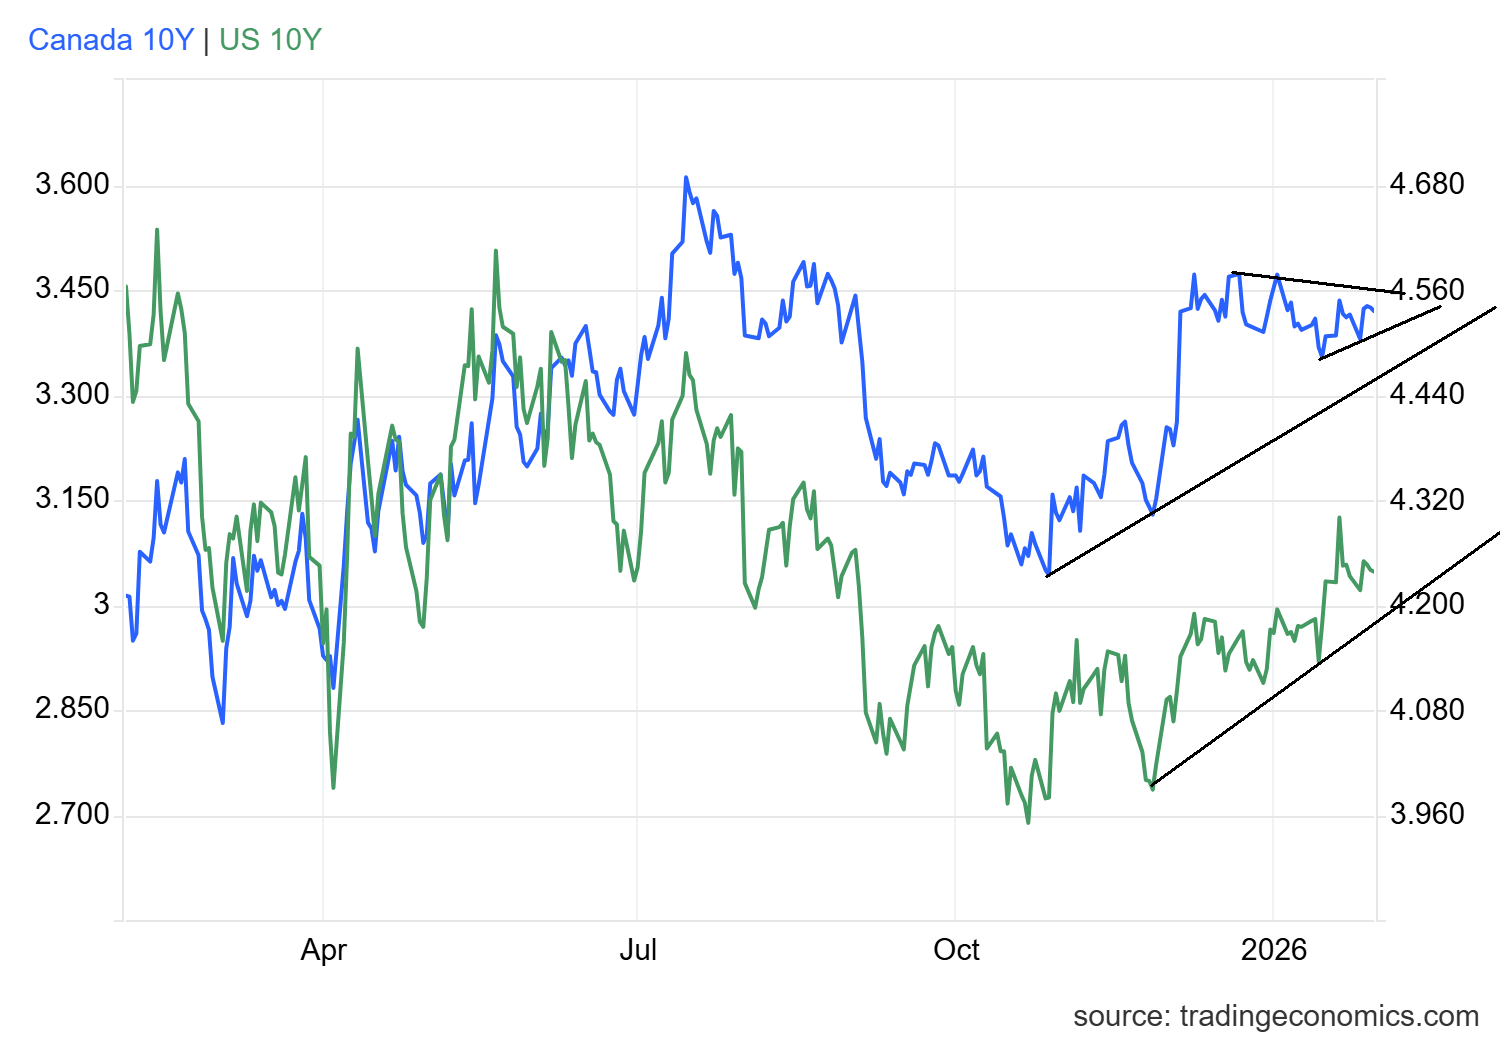
Source: www.tradingeconomics.com, www.home.treasury.gov, www.bankofcanada.ca
The appointment of Kevin Warsh didn’t do a whole lot for the Treasury market this past week. Warsh seems to be all over the map. He was seen as one of the more hawkish potential picks. And he was quite against the Fed expanding its balance sheet as it did after the 2008 financial crisis and the pandemic. He’s against inflation, but like Trump, he has been a proponent of lower interest rates. The U.S. 10-year Treasury note didn’t do much this past week, up 2 bp to 4.25%. The Canadian 10-year Government of Canada bond (CGB) was flat at 3.42%. The 2–10 spreads in the U.S. rose 10 bp, and in Canada they were up 4 bp. The 2–10 spreads continue to point to a recession. This past week, consumer confidence fell (note the preceding chart), but the Chicago Purchasing Managers Index (PMI) rose to 54 from 42.7. Over 50 usually indicates expansion, while under 50 points to a recession.
This week is a big one for reports: a number of PMIs, including the ISM Manufacturing indices and the S&P Global Services PMIs, along with the JOLTS job openings and job quits. However, the big day is February 6 when the employment numbers come out. The market is looking for nonfarm payrolls to rise by 40,000 and the unemployment rate to rise to 4.5%. In Canada, job losses are expected to be 10,000, and the unemployment rate is expected to remain unchanged at 6.8%.
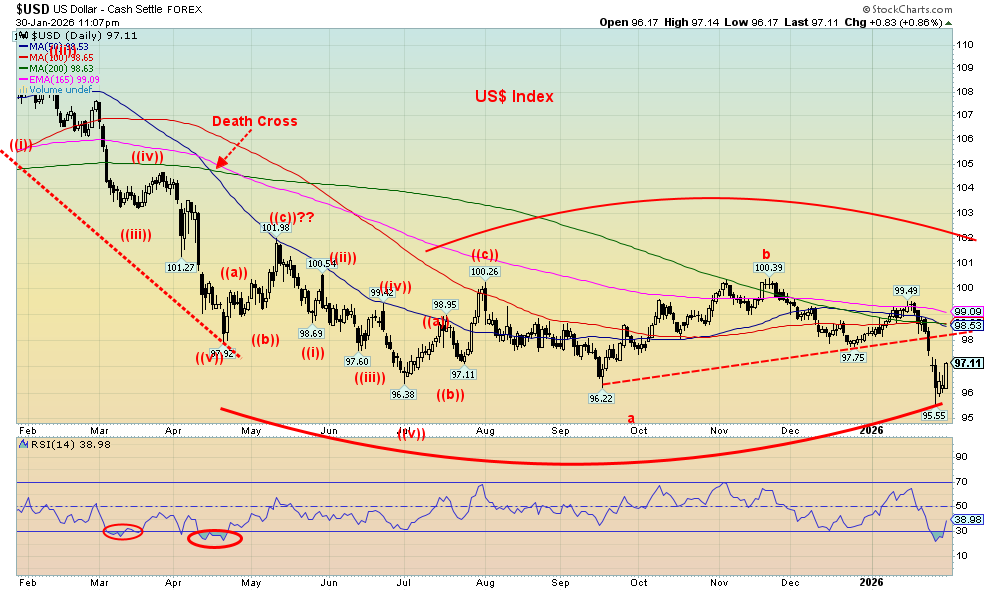
Source: www.stockcharts.com
The market seemed to perceive the appointment of Kevin Warsh as the next Fed Chair positively, as the US$ Index rebounded after seeing new 52-week lows earlier in the week. While the US$ Index rebounded, gold and silver sold off sharply. On the week, the US$ Index fell 0.3% despite the rebound late in the week. The euro gained 0.2%, the Swiss franc was up 0.8%, the pound sterling up 0.3%, and the Japanese yen gained 0.6%, thanks to some possible intervention by the BOJ. Both the Swiss franc and the pound sterling made 52-week highs. The Cdn$ gained 0.5%. A lot depends on upside follow-through this coming week. The US$ Index is rising from oversold levels and has considerable room to move higher, according to the RSI that closed at 34 on Friday. It’s a long way to go to confirm a low, as we’d need to get over 99 to really confirm that a low is in. Above 99.50 points to even higher prices. New lows under 95.55 suggest that we are going to fall further.
Source: www.stockcharts.com
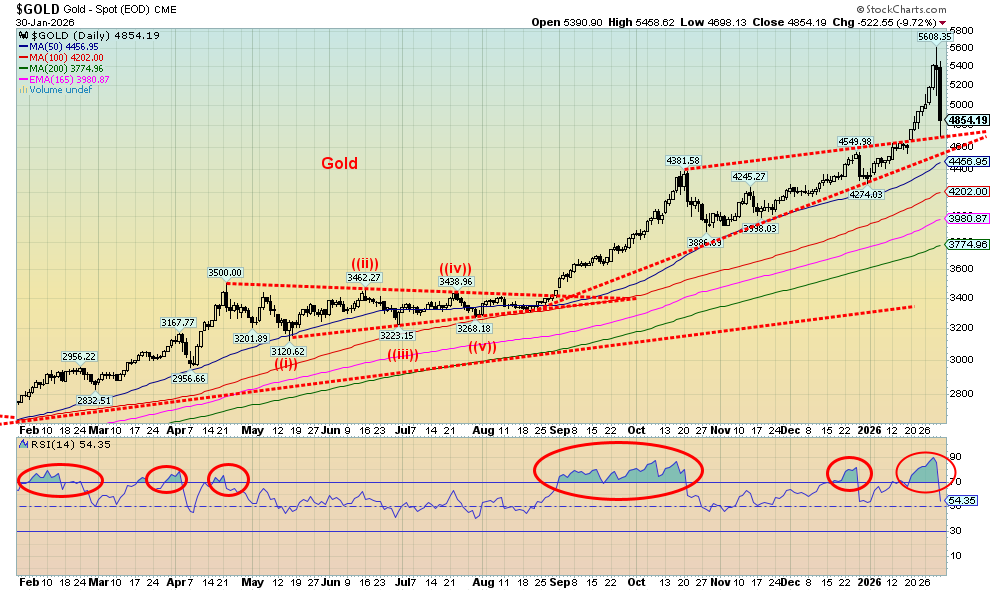
Following a $1,268 move for gold prices in 2026, the inevitable correction came. It was a doozy. Gold peaked at $5,608 on Thursday before the correction (crash?) got underway. Then gold fell $754 in two days, or 13.4%. A mini-crash? Silver was worse, falling 27% on Friday. Definitely a crash. Platinum dropped almost 17%. This week, gold doesn’t look too bad, losing only 2.5%. Silver lost 17.8% while platinum fell 22.5%. Palladium was off 18.2%. Copper was up 0.5% but well down from its all-time high at $6.58 seen this past week. The gold stocks took it on the chin as well, with the Gold Bugs Index (HUI) down 11.7% and the TSX Gold Index (TGD) down 11.8%.
So, what was this estimated $7 trillion wipeout all about? Derivatives played a big role. Gold’s derivatives through futures, options, future rate agreements, ETFs, etc., had a crypto moment. Too much leverage, and when the avalanche started, it couldn’t be stopped. There were announcements of more margin requirements at the Chicago Mercantile Exchange (CME). Then we suspect the bullion banks stepped in and added, and along the way, stops were triggered. Nervous nellies panicked, and the crash was on. Gold was dumped. Silver was slaughtered. There was also east/west arbitrage: one could buy physical in the U.S. and sell in Asia and take advantage of higher price levels. Nonetheless, for long-term buyers, the fundamentals remain the same, particularly for silver, which is in short supply physically but with lots of paper silver (note the silver chart that follows). It’s the same situation with gold, where there is an estimated 100–300 ounces of paper gold for every ounce of physical gold.
The reasons for holding gold haven’t gone away. We’re still grappling with too much debt, the potential for a sovereign debt crisis, and ongoing geopolitical conflicts with Russia/Ukraine, Israel/and everyone else. Add in threats to bomb Iran and an oil embargo on Cuba. As well, ongoing domestic political conflicts on the streets of the U.S. and in the halls of the Capitol in Washington, D.C., and an erratic president who threatens other countries with annexation.
Nonetheless, Friday’s action saw that what goes up fast comes down even faster. A week and a half's gains were wiped out in a nanosecond.
Gold hit some support this past week. But a drop through $4,600 could trigger more losses. Long-term support and the 200-DMA isn’t until around $3,800. Regaining above $5,400 could trigger new highs. However, given the strength of the drop, we at best face a period of consolidation before another leg up gets underway. And the sell-off may not yet be over. Next support is in the $4,300/$4,400 zone. All this was a caution to not get complacent. We were originally looking for a high for gold/silver in February. It came early. Could February now give us a low?
Source: www.stockcharts.com
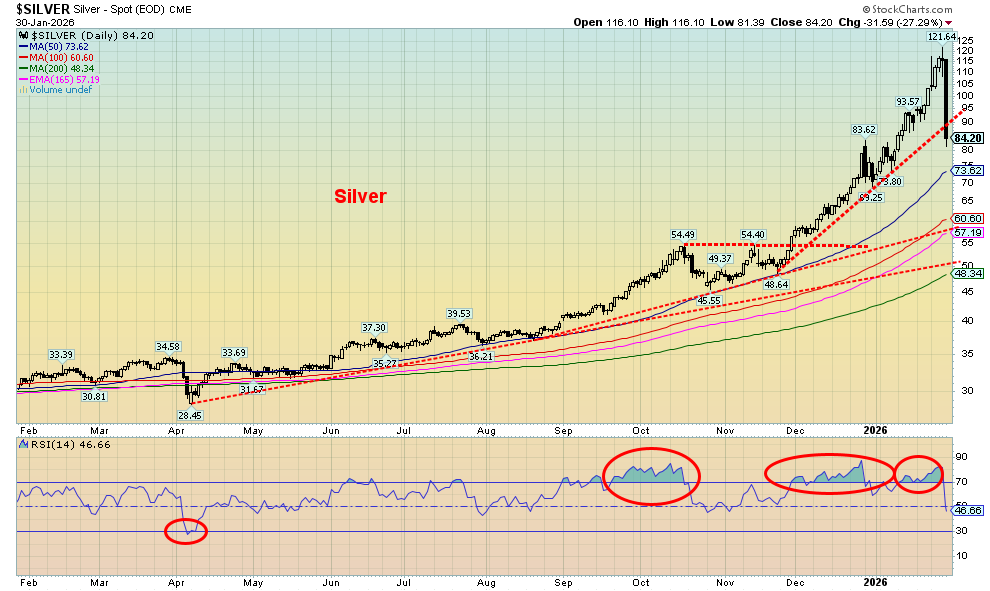
WIPEOUT! That’s about all we can say about the devastating but also surprising collapse of silver this past week. After screaming through $100 and then $110, hitting an all-time high peak of $121.64, silver turned tail and collapsed almost 31% in a mere two days to $84.20, going through $100 again, only this time to the downside. The collapse on Friday of 27.3% was a record day. Not even the Hunt Brothers could pull that one off. On the following page, there’s a nifty chart showing the worst silver crashes.
So, what gives? After all, silver has become a critical mineral used in all sorts of stuff, especially in the defense industry, EVs, solar panels, etc. But, as we have noted, there are some 200–400 (some say around 350) paper ounces for every one ounce of physical silver. That’s a lot of leverage, both up and down. If an avalanche starts, it may be impossible to get out of the way. Spreads between London and Shanghai exploded. Spreads between paper silver and physical silver also rose. This was a technical collapse, not a fundamental one.
All this started after President Trump announced Kevin Warsh as the next Fed Chair. Despite many questions about Warsh – i.e., is he a hawk or a dove, is he a puppet of President Trump or not – the market perceived it as negative for the precious metals and positive for the U.S. dollar. The CME raised margin requirements. Margin calls came, and liquidation got underway. It cascades onto itself. Silver was still offered at a $10 premium to spot in North America, but could be as high as $25 in Asia.
Before this drop, silver soared 72% in January, or roughly $50. That’s clearly a bit overdone. The Relative Strength Index (RSI) consistently showed as overbought. Not so much anymore, having fallen to a neutral 47. But oversold undoubtedly beckons. What’s key is below $69/$70, the most recent daily low. As long as we can hold that level, we should be okay, although the repair to this wipeout won’t happen overnight. If that zone fails, then we don’t see any strong support until we get to $57/$60.
It was a dramatic wipeout. But, as with gold, the conditions and reasons behind the rise have not gone away. The 1980 peak was the Hunt Brothers’ attempt to corner the silver market. Fallout from the 2008 financial crisis, QE, and a government shutdown helped drive the 2011 peak. But this time, outside of the appointment of Warsh, there was no other obvious reason. Chaos continues on the streets of the U.S., and no peace deals exist for Russia/Ukraine or Israel/Gaza. President Trump continues to threaten everyone with annexation. There are growing signs that the U.S. could tip over into recession.
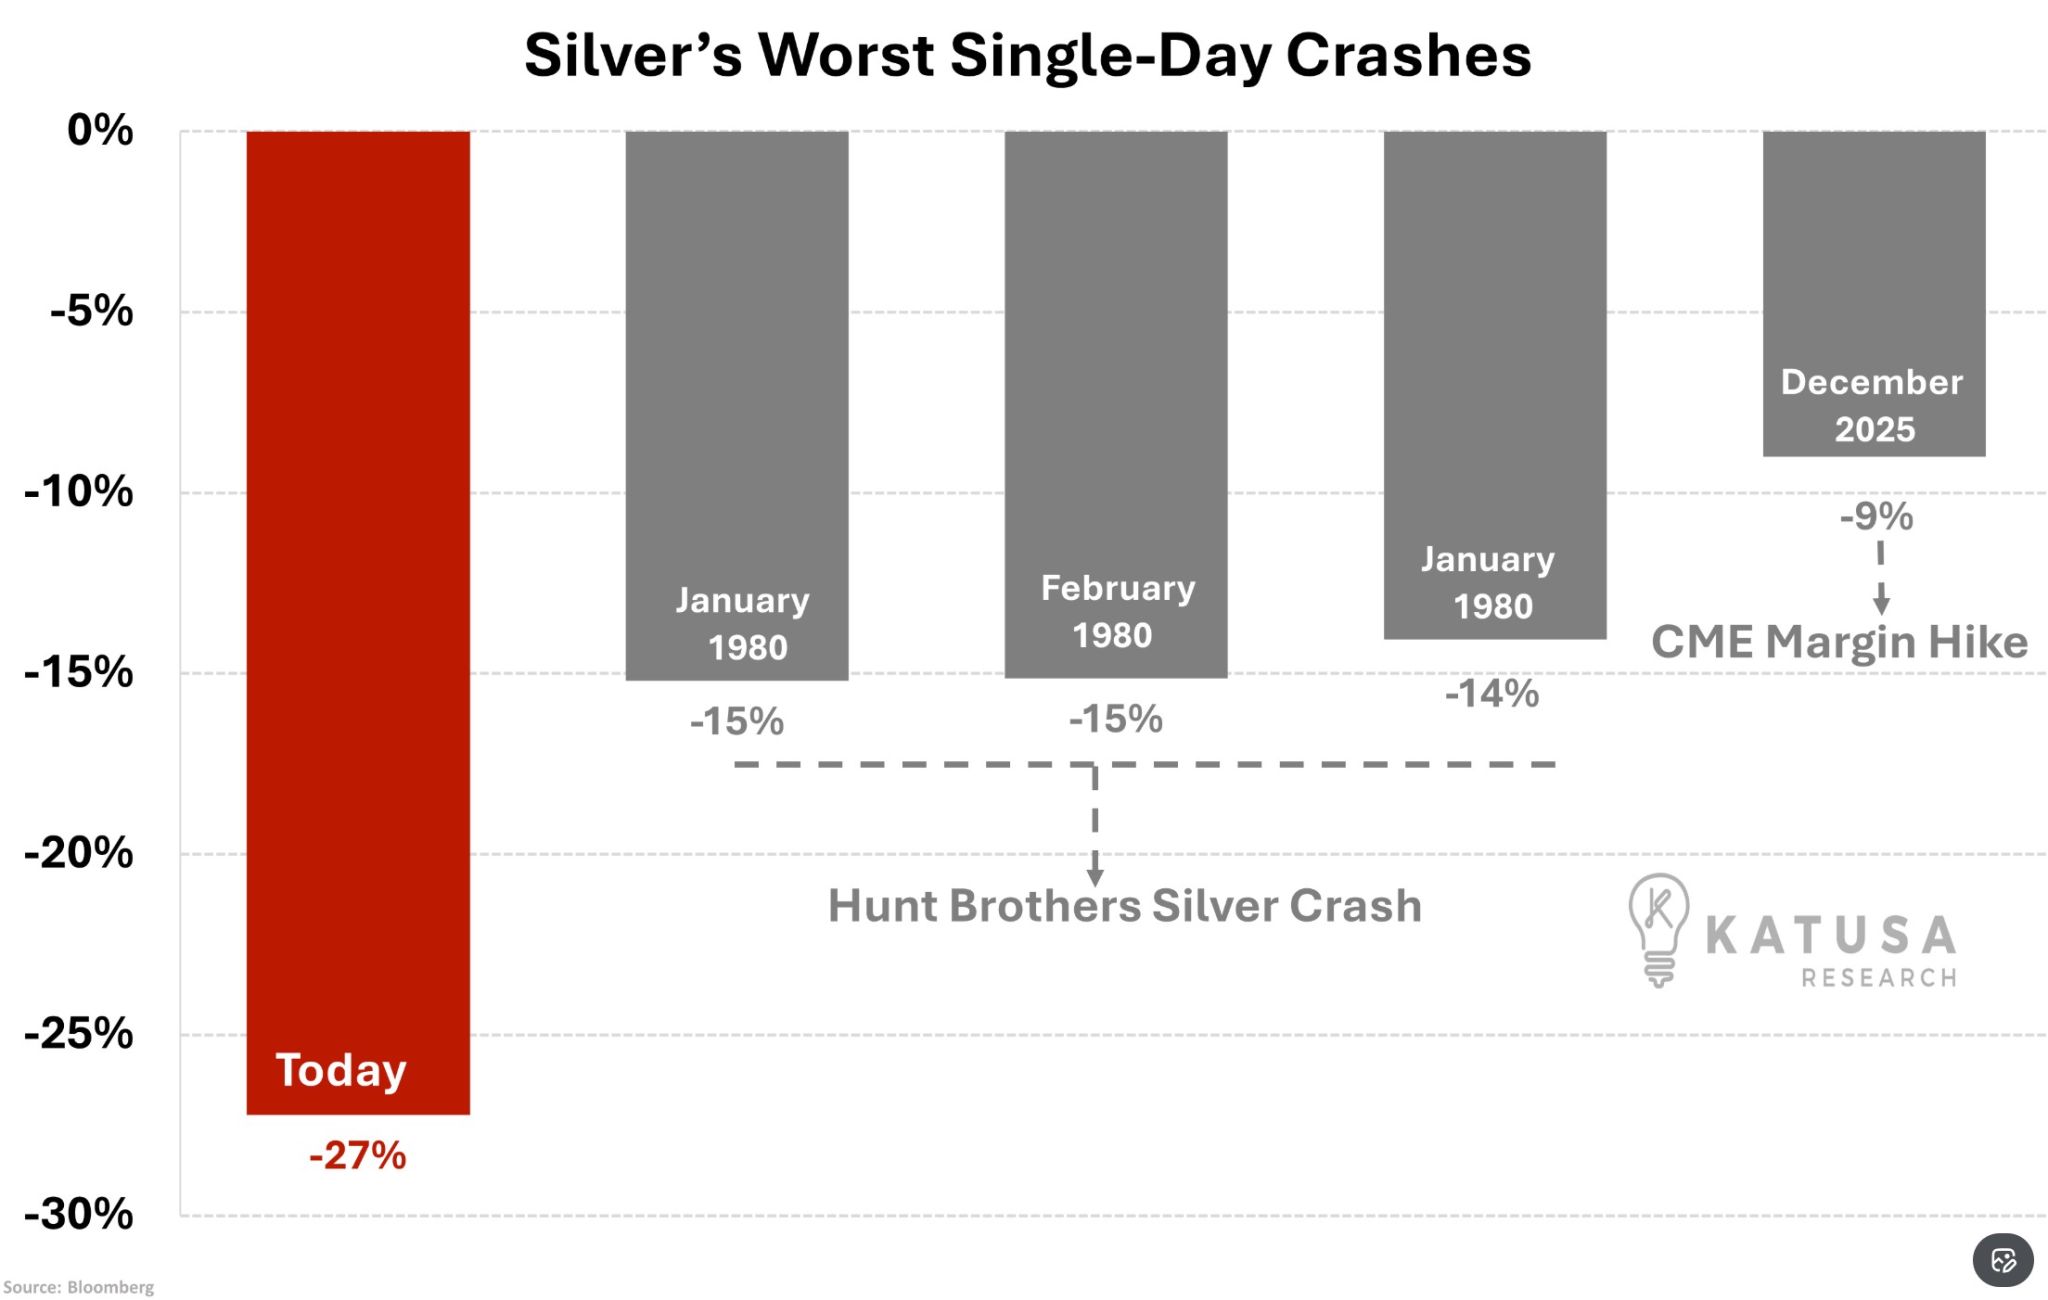
Source: www.bloomberg.com, www.katusaresearch.com, www.syzgroup.com
Source: www.stockcharts.com
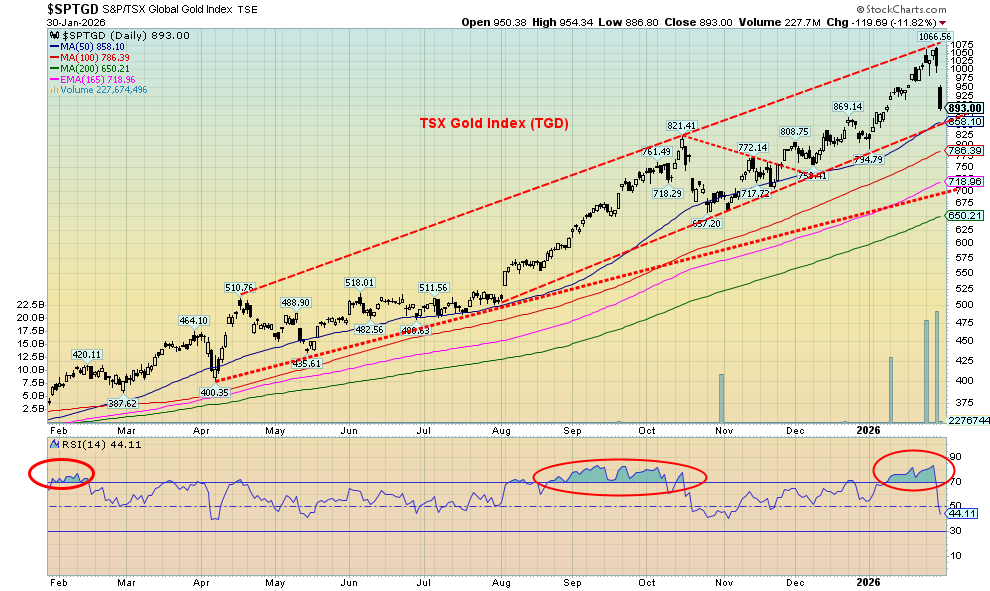
The bad news is that the gold stocks were clobbered this past week. The good news is that they did better than silver. Over two days, Thursday and Friday, of this past week, the TSX Gold Index (TGD) fell 16.3%. On the week, the TGD was down 11.8%. It was the same for the Gold Bugs Index (HUI) as it fell 11.7% on the week. Individual stocks fell, in some cases more, others less. The trigger, of course, was the massive liquidation in the gold and silver paper markets. The RSI for the TGD went from overbought to close at a neutral 44.1 this past week.
We are now fast approaching channel support near 860 and the 50-day MA. As long as that holds, the trend remains up. Below that, support appears more solid in the 650/660 zone. Unfortunately, that is another drop of 27%. The 200-DMA is at 650. Interim support can be seen around 790 and 715. For the long term, a drop under 650 would signal the bull market is officially over. There is a gap just above that could be enticing to fill. Returning above 1,000 would be positive and suggest possible new highs ahead. We don’t see that happening soon. A period of consolidation should follow any final low. That could begin as early as this coming week.
Source: www.stockcharts.com
The U.S. continues its talks to bomb Iran. Arab states ask them to use caution and, of course, would prefer that the U.S. not bomb Iran, fearing it could unleash destabilization in the Middle East. Trump’s erratic rhetoric doesn’t help. Iranian warships are prowling the same waters as U.S. warships. Add in the devastation from winter storm Fern that shut in at least 500,000 bpd, and you have the makings of a tightening in the market.
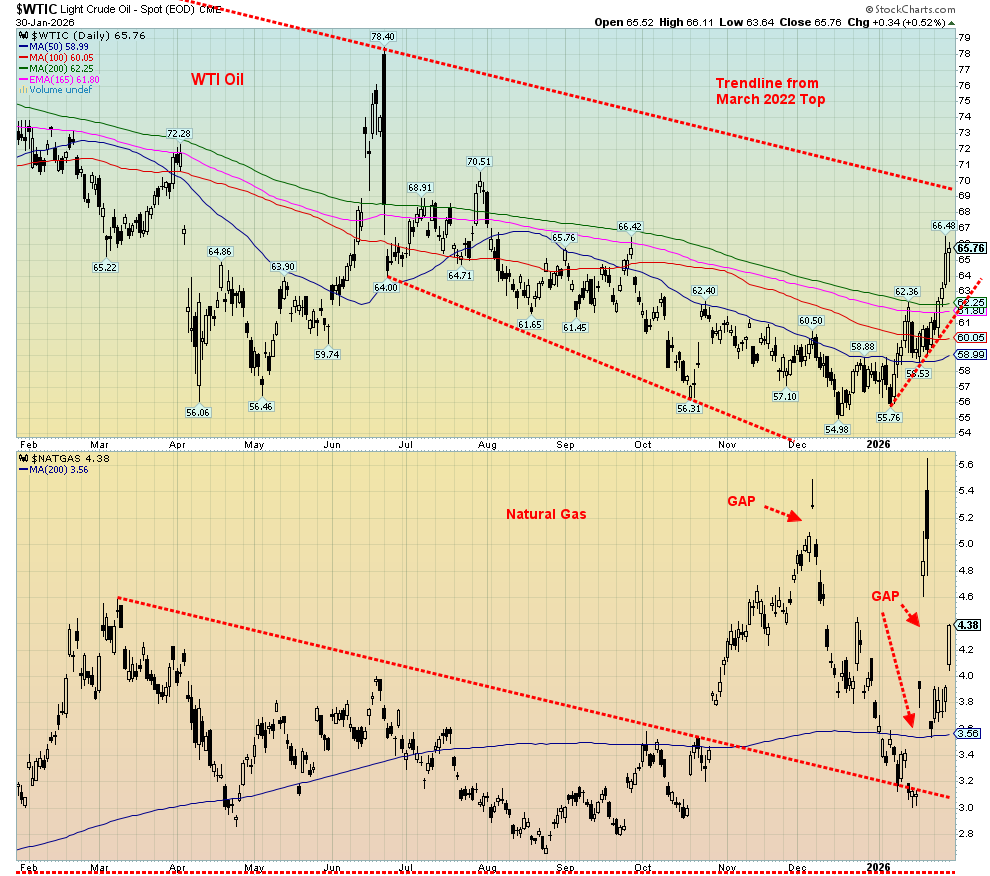
As a result, WTI oil jumped over $4 this past week, or 7.4%. Brent crude rose 5.7%. The energy stocks loved it as the ARCA Oil & Gas Index (XOI) rose 3.4% while the TSX Energy Index (TEN) was up 2.7%. Our thoughts on energy stocks that we’ve noted over the past month or two are coming to fruition as energy stocks rise. Both indices reached 52-week highs but remain short of all-time highs. Since we have broken out to the upside, the next target to take out is that downtrend line from the 2022 top. The breakout appears to be above $69/$70. Can we do it? The answer is yes if the Iran bombing takes place and Iran responds as they have threatened to, especially since they have restocked their arsenal after the last bombing by the U.S./Israel in June 2025. As we have noted, Iran may not have the capability to block the Straits of Hormuz, but it can make things difficult. 20%–25% of the world’s oil, or around 20 million barrels/day, flows through the Straits of Hormuz.
Natural gas (NG) has been wild and woolly, spiking to $5.65, collapsing to $3.60, then rising again to close the week at $4.42, up 21.0% on the week. It’s been wild, complete with gaps and island reversals that are enough to make one’s head whirl. Colder weather was the culprit. EU NG at the Dutch Hub rose 1.0%, but the volatility of U.S. NG was not present. Concern over whether the U.S. might bomb Iran was the catalyst. Iran is the world’s third largest producer of NG and holds the world’s second largest reserves.
As long as the pressure of potentially bombing Iran remains on the table, along with ongoing cold weather, both oil and gas prices should remain elevated. Energy stocks are still not showing any signs of a top, despite new 52-week highs. For WTI oil, as long as we don’t break back under $62.30, we should be okay.
Copyright David Chapman 2026
GLOSSARY
Trends
Daily – Short-term trend (For swing traders)
Weekly – Intermediate-term trend (For long-term trend followers)
Monthly – Long-term secular trend (For long-term trend followers)
Up – The trend is up.
Down – The trend is down
Neutral – Indicators are mostly neutral. A trend change might be in the offing.
Weak – The trend is still up or down but it is weakening. It is also a sign that the trend might change.
Disclaimer
David Chapman is not a registered advisory service and is not an exempt market dealer (EMD) nor a licensed financial advisor. He does not and cannot give individualised market advice. David Chapman has worked in the financial industry for over 40 years including large financial corporations, banks, and investment dealers. The information in this newsletter is intended only for informational and educational purposes. It should not be construed as an offer, a solicitation of an offer or sale of any security. Every effort is made to provide accurate and complete information. However, we cannot guarantee that there will be no errors. We make no claims, promises or guarantees about the accuracy, completeness, or adequacy of the contents of this commentary and expressly disclaim liability for errors and omissions in the contents of this commentary. David Chapman will always use his best efforts to ensure the accuracy and timeliness of all information. The reader assumes all risk when trading in securities and David Chapman advises consulting a licensed professional financial advisor or portfolio manager such as Enriched Investing Incorporated before proceeding with any trade or idea presented in this newsletter. David Chapman may own shares in companies mentioned in this newsletter. Before making an investment, prospective investors should review each security’s offering documents which summarize the objectives, fees, expenses and associated risks. David Chapman shares his ideas and opinions for informational and educational purposes only and expects the reader to perform due diligence before considering a position in any security. That includes consulting with your own licensed professional financial advisor such as Enriched Investing Incorporated. Performance is not guaranteed, values change frequently, and past performance may not be repeated.
About the author


Website: https://www.enrichedinvesting.com
Disclaimer: David Chapman is not a registered advisory service and is not an exempt market dealer (EMD) nor a licensed financial advisor. We do not and cannot give individualised market advice. David Chapman has worked in the financial industry for over 40 years including large financial corporations, banks, and investment dealers. The information in this newsletter is intended only for informational and educational purposes. It should not be considered a solicitation of an offer or sale of any security. The reader assumes all risk when trading in securities and David Chapman advises consulting a licensed professional financial advisor before proceeding with any trade or idea presented in this newsletter. David Chapman may own shares in companies mentioned in this newsletter. We share our ideas and opinions for informational and educational purposes only and expect the reader to perform due diligence before considering a position in any security. That includes consulting with your own licensed professional financial advisor.