
Risk is everywhere. Risk is what we have to manage. Then a risk that had already been noted becomes a reality. That risk was that the US and Israel would bomb Iran. Now it is happening. What next? Oil and gold should rise? The stock market may sell off. The war has the potential to engulf not just the Middle East but also the world. Being an airline company these days must be becoming more risky. Embargo on Cuba, cutting off flights not just to Cuba but to other places in the Caribbean as well. Mexico and its battles with the cartels in resort areas again negatively impacted flights. Now, the Mid-East where airlines have once again been cut off. Will airline stocks crash and burn? Meanwhile, thousands are stranded.
Everyone has talked about the coming commodity super cycle. But so far, all we have is the gold super cycle. The chart of the week looks at the divergence between gold and the CRB Index, representing commodities. Energy is the largest component. It has been down, but the outbreak of war in the Middle East may now change that scenario.
The U.S. stock markets were mostly down this past week. But elsewhere, there were some new highs, including once again Canada's TSX Composite. The MAG7 are teetering. They led the market up. Will they lead it down?
But the real story is the bombing of Iran at the end of the week. Where does it take us? Does the law of unintended consequences kick in? What is the risk? The risks, as they say, are high. Stocks likely to withstand any negative economic fallout include value retailers such as Dollarama Inc., which reported increased sales and higher EBITDA, pays a dividend, and is held in the Enriched Capital Conservative Growth Strategy.*
This Friday, March 6, 2026, the February U.S. job numbers are out. Expectations are for nonfarm payrolls to rise 70,000, and unemployment to remain unchanged at 4.3%.
Spring is coming. At least some cheer. Have a great week!
DC
* Reference to the Enriched Capital Conservative Growth Strategy and its investments, celebrating an 8 -year history of 152.91% growth (annual 12.30%), is added by Margaret Samuel, President, CEO and Portfolio Manager of Enriched Investing Incorporated, who can be reached at 416-203-3028 or msamuel@enrichedinvesting.com This information should not be construed as an offer, or a solicitation of an offer or sale of any security. Past performance does not guarantee future returns.
“Governments last as long as the under-taxed can defend themselves against the over-taxed.”
—Bernard Berenson, American art historian, wrote The Drawings of Florentine Painters, a major art authority in the American art world during the early 1900s; 1865–1959
“In bull markets, promises trade at a premium, but in bear markets reality trades at a discount.”
—Jim Chanos, Greek-American investment manager, founder of Kynikos Associates, advisor/specialist on short-selling, nicknamed the Darth Vader of Wall Street, noted art collector; b. 1957
“An economist is a man who, when he finds something works in practice, wonders if it works in theory.”
—Walter Heller, American economist, influential advisor to President John F. Kennedy, Chairman Council of Economic Advisors (1961–1964); 1915–1987
Risk: uncertainty that something may result in loss or injury
Risk can be present in many different situations – business, financial, personal, health, geopolitical. In no particular order, the world’s biggest risks are: extreme weather events, collapse of biodiversity systems, pollution, misinformation/disinformation, cybersecurity, societal polarization, adverse outcomes of AI technology, inequality, global conflict, geoeconomic risks (i.e., tariffs), erosion of human rights/civic freedoms, and displacement. These risks are summarized in the World Economic Forum's Global Risks Report, 2026 (www.weforum.org).
We spent a great deal of our careers as risk managers. The primary risk we managed was interest rate risk, the financial institutions’ portfolio of loans, plus other financial instruments. Other risks included foreign exchange, credit, operational, and liquidity. Investors face a different kind of risk with market volatility, inflation (erosion of purchasing power), the markets (systemic risk such as a market decline or crash), interest rates, credit, foreign exchange, liquidity, political, operational, cybersecurity, and horizon risk (outliving one’s savings).
We’ve already had several risks in action in 2026. They include political risk emanating from the U.S. because of the Trump administration’s attack on checks on power, political enemies (to capture the machinery of government), and chaos on the street. There have also been extreme weather events, particularly the nor’easters that have hit the U.S. East Coast more than once in 2026. There have also been floods, droughts, and, who can forget 2025’s wildfires?
There has been geopolitical risk, such as the U.S.’s attack on Venezuela and an oil embargo on Cuba. The outbreak of violence in Mexico between the Mexican government and cartels is under the category of armed conflict. The latter two events – the oil embargo on Cuba and violence in Mexico – have directly impacted tourism and the airlines that take tourists to Cuba, the Caribbean islands, and now Mexico. Tourism has also fallen on trips to the U.S. from Canada and the rest of the world. Who’s next? As it turned out, it’s the Middle East.
And dare we mention the ongoing tensions between the U.S., China, and Russia? The conflict with Iran that may or may not happen (it happened as we wrote this). There are those who believe that World War III is a real possibility. With the onslaught against Iran, the law of unintended consequences could happen.
Lest we forget, the Fed could be headed for a period of uncertainty with a split board and an incoming chairman personally chosen by Trump, even as he still needs to be confirmed by the Senate. Finally – the elephant in the room – there’s the mind-boggling debt, not only in the U.S. but also globally, that also includes corporations and consumers.
Take airlines as an example. They fly everywhere – domestically, internationally. They carry people and goods. Who flies? Business travelers, vacationers, frequent flyers (usually wealthy people), families, and groups for reunions or destination events. People also fly for medical reasons, for adventure-seeking, as expats going back and forth, and finally, the pilots, stewardesses, and others who make the plane fly, and those flying feel comfortable.
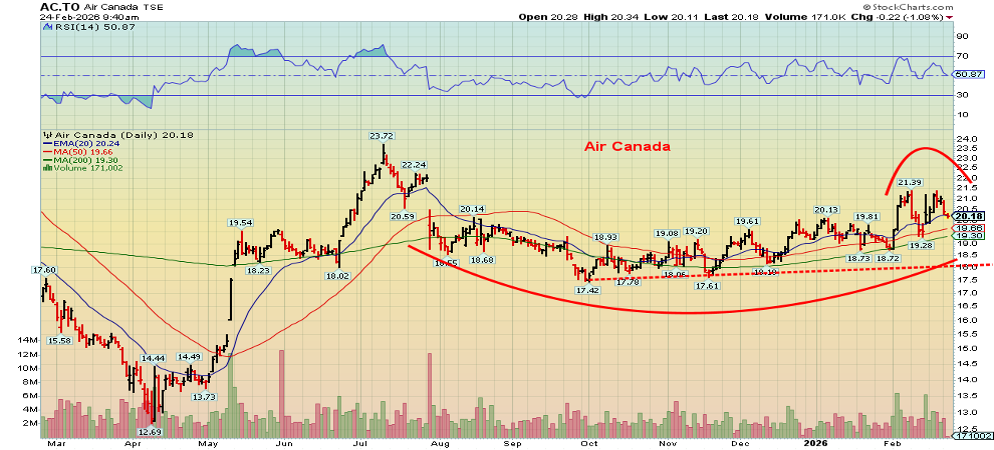
So, we confess, despite all the turmoil, particularly involving vacation spots such as Cuba, Mexico, and Florida, and now the Middle East, Air Canada (AC/TO), Canada’s preeminent airline, is hanging in. And in the U.S., Delta Airlines (DAL/NYSE) is also hanging in, surprisingly. No, they haven’t crash-landed with all the turmoil. Not only is flying for vacationing down, but in 2026, extreme weather events have also played havoc. Check out Air Canada’s chart on the next page. Is that a rounded bottom forming? Or is it merely an extended B wave following that top and decline from July 2025 to October 2025 (the A wave) before a choppy, feeble rebound got underway? Arguably, there are now negative signs with what appears to be a small double topping pattern that has formed over the past month or so. A break under $18 could start a sharper decline. Regaining above $22.25 could signal the start of a run to new highs.
Since the 2020 pandemic low, Delta Airlines has been on a steady but extremely choppy rise to new highs. However, it’s showing signs of trouble. Under $65, a bigger break could occur. The Air Canada chart appears next.
Source: www.stockcharts.com
Even as airlines may soon have trouble flying, we’ve always noted that the real danger is the monstrous debt, not just in the U.S., but globally. All the governments in the G7 are carrying historically high levels of debt to GDP. The leader, of course, is Japan, with a debt-to-GDP ratio of 237. Italy is at 135 and the U.S. at 124. France is at 113, with Canada at 111. Note that Canada’s debt-to-GDP ratio includes its provinces, along with the federal government. Strip out the provinces, and Canada drops to around 42. The United Kingdom is at 94, while Germany is the best outside of Canada at 62. The EU is at 87. For the record, China is at 88, but Russia is a paltry 16.
With such high debt-to-GDP ratios, will these major countries have the wherewithal to respond to another financial crisis or pandemic? Adding to the debt pile could make things even more unstable. Fiscal policy is thus becoming an increasing risk, given these already massive debt levels. This is especially true for the U.S., which is running a $2 trillion deficits over 6% of GDP. Handing out massive tax cuts that benefit mostly the wealthy not only adds to inequality but is also fiscal insanity.
Risk is in every facet of life. But the current path that could lead to debt collapse, civil conflicts, and even global war makes the current period particularly vulnerable. However, it is good for gold.
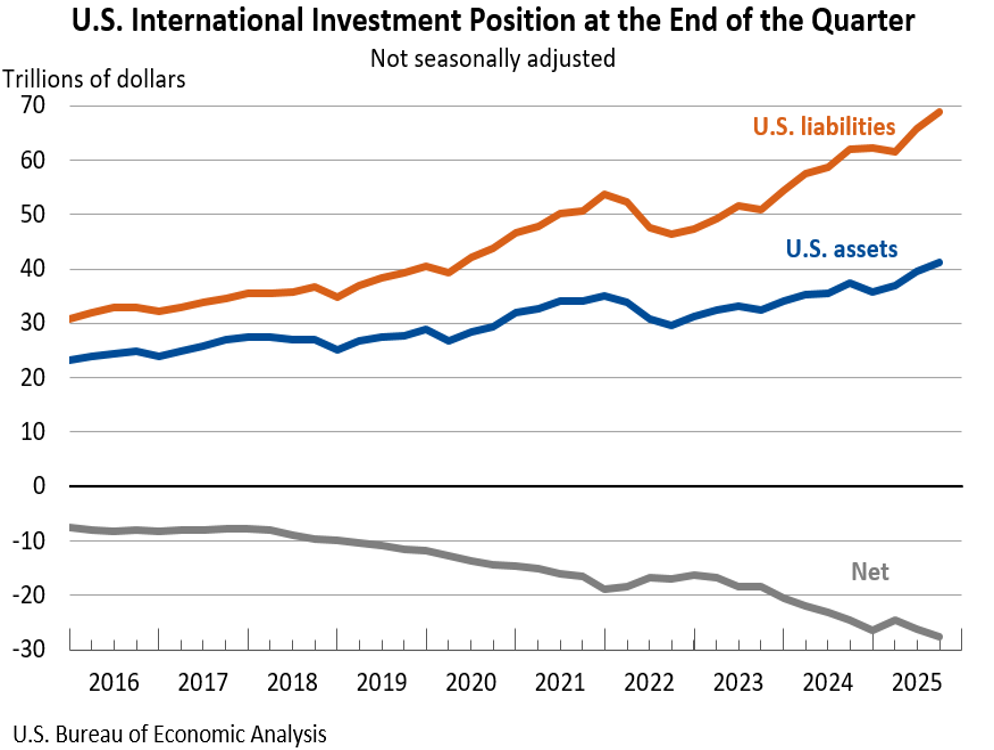
One final risk. The U.S. net international investment position (NIIP) represents the difference between U.S. residents' foreign financial assets and liabilities. At the end of the third quarter in 2025, that position stood at approximately -$27.61 trillion. This negative position, or net liability, consisted of $41.27 trillion in assets and $68.89 trillion in liabilities, indicating that foreign holdings of U.S. assets exceed U.S. holdings of foreign assets. The NIIP is actually an important measure of the U.S. financial position in the global economy. All that direct foreign investment in the U.S. has contributed considerably to the record rise of the stock market. The risk is that, because of ongoing economic conflicts between the U.S. and just about everyone else, some of these funds might be withdrawn from the U.S. and repatriated to their home country. That in turn would make the stock market increasingly risky and put downward pressure on the U.S. dollar as the funds are converted.
Risk, it seems, is everywhere, even where you don’t know there is risk.
Source: www.bea.gov
Chart of the Week
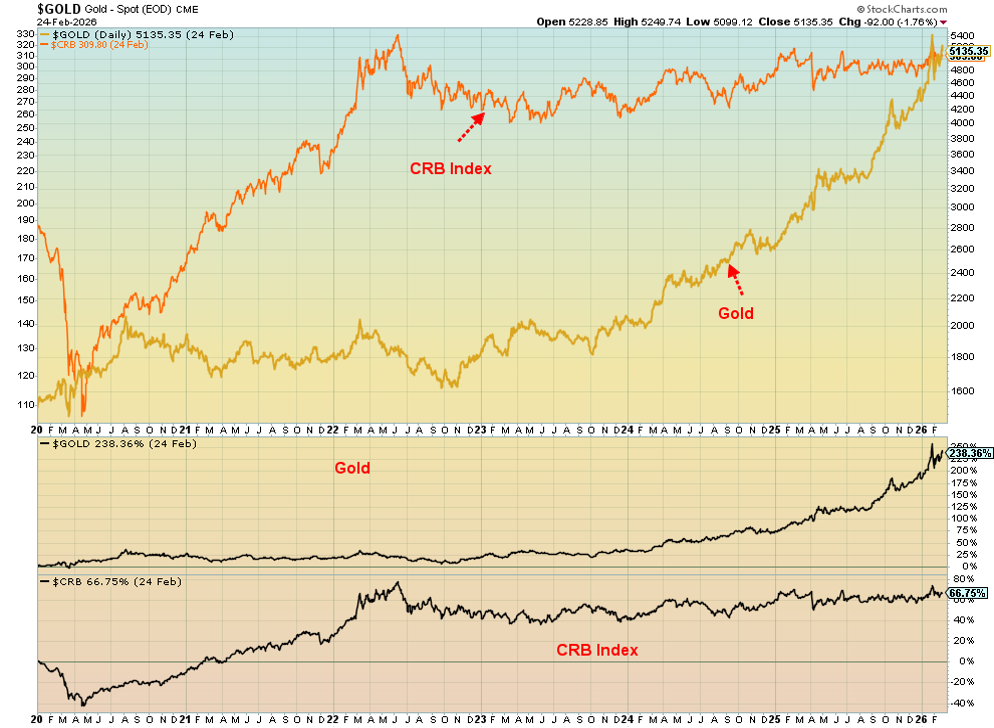
Gold and the CRB Index 2020–2026
Source: www.stockcharts.com
Since the pandemic in 2020, gold has climbed 238%. The CRB Index, of which gold is a component, is up only 67%, a considerable underperformance. Besides gold, other CRB components include:
- The energy group: WTI oil, natural gas, RBOB gasoline, heating oil
- Soft commodities: sugar, cotton, coffee, cocoa, orange juice
- Metals: gold, silver, copper, aluminum, nickel
- Livestock: cattle, hogs
- Agriculture: soybeans, wheat, corn
The largest component is the energy group, making up 39% of the index. Soft commodities make up 21%, metals 20%, agriculture 13%, and livestock 7%.
Gold has been the safe haven of choice since the 2020 pandemic. Gold is up 238% since then, primarily due to geopolitical instability, domestic political instability, economic instability, and debt, debt, debt. The energy group, the largest, has lagged. The CRB Index is up only 67% during the same time. Oil is up a feeble 9% since 2000, and natural gas (NG) is up 36%. The ARCA Oil & Gas Index (XOI) has gained 71% while the TSX Energy Index (TEN) is performing much better, up 147%. But then the TSX Gold Index (TGD) has gained 310%. (Note: the events in Iran could extend gains for oil, NG, and the energy indices.
So, is the energy sector overdue to catch up? It has been showing signs of life, recently making new highs for the current move. But it remains well under a more significant breakout level at $68/$70. The key, of course, is whether it will bomb Iran or not bomb Iran. Bombing Iran could destabilize the entire Middle East, which holds 30% of the world’s oil production, upwards of 50% of the world’s oil reserves, produces 17%–20% of the world’s natural gas, and holds at least 30% of the world’s reserves in NG. Iran is the world’s seventh-largest producer of oil and holds the world’s third-largest reserves. When it comes to natural gas, Iran is the world’s third-largest producer and holds the world’s second-largest reserves. When it comes to energy, Iran, along with the U.S. and Russia, is a major player. Therefore, its production and huge reserves are perfect for geopolitical games, particularly given that Iran is not friendly to the West.
The CRB Index is showing signs that it could soon break higher. If so, then it is energy that is going to lead the way. Energy stocks have been leading the way up over the commodity oil and gas. If correct, then energy stocks should continue higher from current levels.
With gold rising sharply while the CRB languishes, dragged down by the poor performance of the energy sector, we can note that we have a gold supercycle. As to the commodity supercycle, it is currently stuck in neutral.
Stocks
Source: www.stockcharts.com
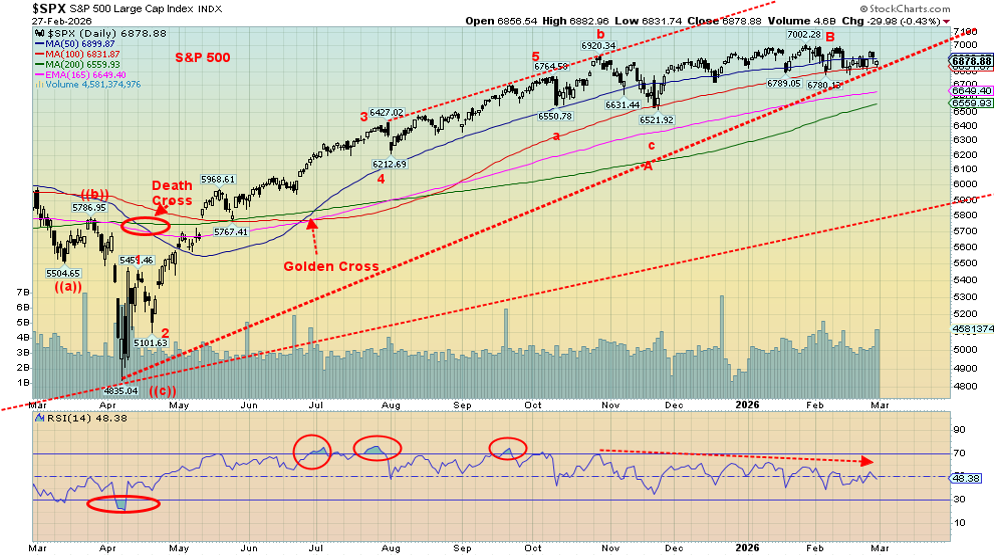
The U.S. stock markets wobbled this past week. The S&P 500 fell 0.4%, the Dow Jones Industrials (DJI) was down 1.3%, the Dow Jones Transportations (DJT) was off 0.8%, and the NASDAQ fell 0.6%. The S&P 400 (Mid) was down 0.9%, and the S&P 600 (Small) was down 1.5%. In a divergence, the S&P 500 Equal Weight Index rose 0.4%, and the NY FANG Index was up 0.1%, thanks to a big 22%+ gain for Netflix after it backed out of the Warner Discovery deal. Of note, all seven of the MAG7 finished down on the week. The tech/AI sell-off continues.
The rest of the world was more positive. The TSX Composite rose 1.5% to new all-time highs. A number of sub-indices also made new all-time highs: Income Trusts (TCM), Consumer Staples (TCS), Golds (TGD), Metals (TGM), Materials (TMT), Industrials (TIN), and Utilities (TUT). If there was a drag, it was Financials (TFS), down 1.3%, and Information Technology (TTK), off 2.4%, that weighed on the index. The TSX Venture Exchange (CDNX) gained 6.2% as a swing in junior miners in particular is fueling that rally.
In the EU, the London FTSE reached all-time highs, up 2.2%, while the EuroNext also made all-time highs, up 0.6%, as did the Paris CAC 40, up 0.8%. Not joining the party was the German DAX, up 0.1%. In Asia, China’s Shanghai Index (SSEC) rose 2.0%, the Tokyo Nikkei Dow (TKN) hit all-time highs, up 3.6%, Hong Kong’s Hang Seng (HSI) rose 0.8%, while India’s Nifty Fifty Index was the only spoiler, down 1.5%. The MSCI World Index (ex U.S.) rose 0.5% to new all-time highs.
Bitcon’s woes continue as it fell 3.1%, closing back under $65,000. BTC is now down almost 49% from its all-time high set in October 2025. Interestingly, however, was that the U.S. stock market was down while the Canadian stock markets, EU stock markets, and the major Asian stock indices were all mostly up on the week. We don’t have the numbers, but were investments being pulled out of the U.S. and back to the home country? Notably, the US$ Index fell this past week – not much, less than 1% – but that helped the currencies rise. Well, most of them, but not the pound sterling and the Japanese yen, as both were off for the week. The Chinese yuan recorded a better-than-usual rise this past week.
Bond yields also fell, with the U.S. 10-year Treasury note falling under 4% for the first time since September 2025. The 10-year closed at 3.95%, down 14bp on the week. The Canadian 10-year bond (CGB) also fell 9bp on the week to 3.13%. A report signaling that Canada’s Q4 GDP fell 0.2% added to Canada’s woes. Canada has suffered from specifically directed tariffs not covered by CUSMA, and the result has been job losses. Full-year GDP grew 0.1%. Canada is not the only one experiencing slow to negative growth, as the remaining G7 countries, except the U.S., are all slowing. But even the U.S. is showing slowing signs, along with sticky inflation.
The S&P 500 still has not broken down. However, we are very close to the first break point under 6,800. But the real key is 6,500. Under that level, look out below.
Gold and Silver
Source: www.stockcharts.com
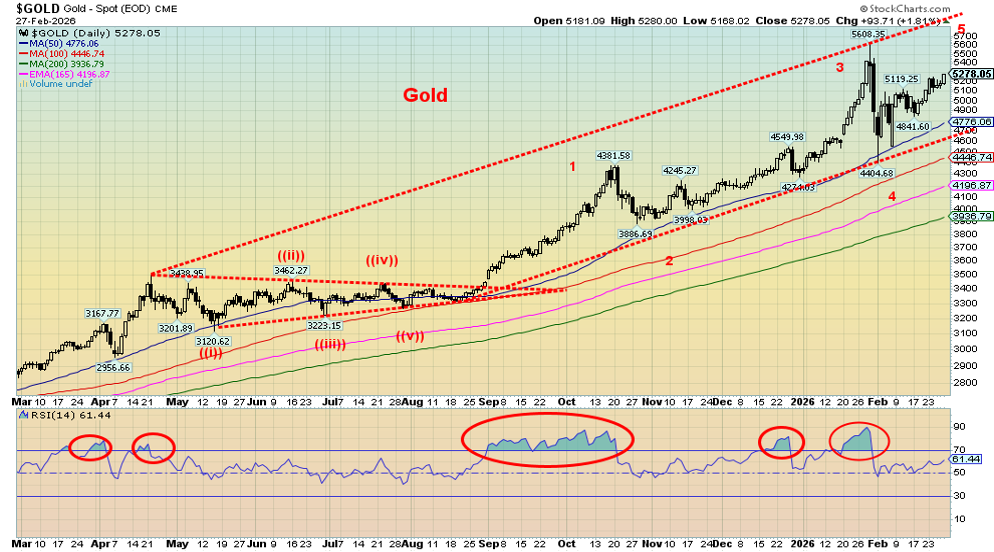
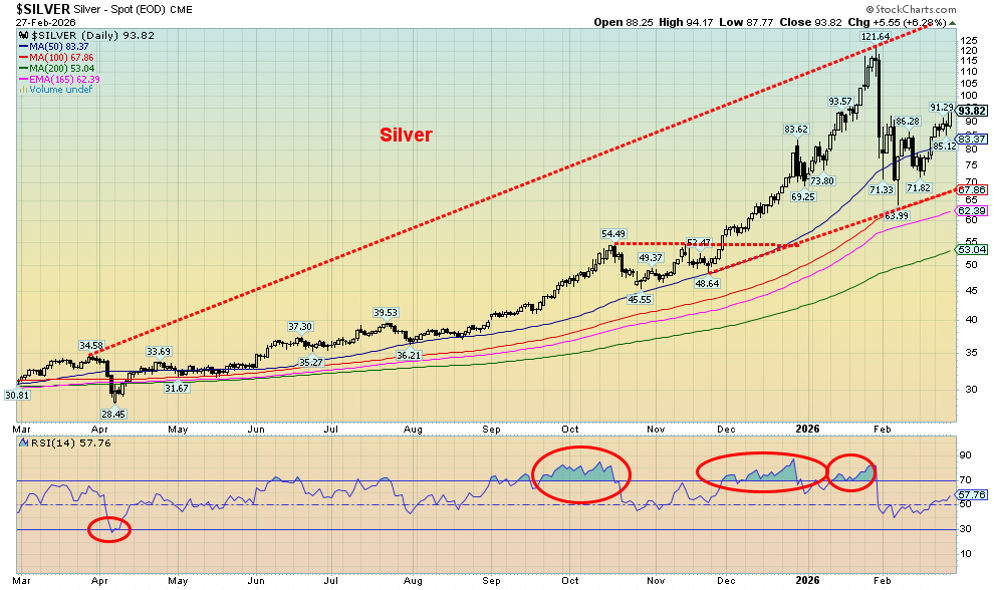
Is the next major up wave for gold, silver, and the gold stocks about to get underway? The events in the Middle East, with the bombing of Iran, might be the catalyst, not only for oil and gas to rise but also for a rise in precious metals. By any measurement, they’ve already had a banner year. It is, we suspect, about to get even better. With things deteriorating geopolitically, conflict still on the domestic political front, deteriorating economies in the West, and massive debt, gold and silver have only one way to go, and that is up (with periodic sharp corrections, as we saw recently).
This past week was no exception. Gold rose 3.3%, silver was up 11.7%, platinum was up 9.4%, and the near precious metals saw palladium flat and copper up 2.4%. But once again, it was the gold stocks that shone with the Gold Bugs Index (HUI) gaining 9.6% and the TSX Gold Index (TGD) up 8.7%. Both leaped to new all-time highs and appear to be leading the metals. It’s only February, and already gold is up 22%, silver up 31.7%, platinum up 16%, the HUI up 39.5%, and the TGD with a gain of 34.9%. Remember that both the HUI and the TGD gained over 100% in 2025. At the current pace, both could well soar over 200% in 2026. Many believe the precious metals stocks are still undervalued.
Naturally, don’t take this to the bank. If peace breaks out tomorrow, they could quickly give back all those gains and then some. But, right now, peace seems to be a distant dream. Adding fuel to the fire, Pakistan and Afghanistan is also at war, and the war in Russia/Ukraine rages on. War, it seems, is spreading. The question becomes, when does it expand further and bring in China and Russia? Many have been predicting that World War III is getting closer.
Inflation is still hot or at least lukewarm (note that the Producer Price Index came in slightly above expectations this past week). However, bond yields fell this past week, which is encouraging for both gold and silver. With silver enjoying a strong week, the gold/silver ratio fell to 56 this past week, down from 60.4 the previous week. The recent low for the ratio was 44. Many are predicting a fall to 20. Holding things constant with gold at $5,260, that suggests silver at $260.
The outbreak of war against Iran is not going to be friendly to the already bloated U.S. budget deficit. War is expensive, and the U.S., with a budget deficit to GDP of over 6%, could see it go higher. This adds to the U.S.’s debt woes.
We could be embarking on a fifth wave to the upside from that low last April 2025. The fifth wave can sometimes prove to be more monstrous than the third wave. New highs should confirm we are on our way. The gold stocks are leading, and that appears to be positive. We are not yet overbought, suggesting we have considerable room to move higher.
Source: www.stockcharts.com
Oil and Gas
Source: www.stockcharts.com
The question – to bomb Iran or not to bomb Iran – has been answered as the U.S. and Israel are now bombing Iran. Whether the bombing is legal or not under international law is, as many point out, moot. Nor is it UN-approved. It’s happening, and retaliation is underway. We don’t know whether Russian and Chinese warships are still there following joint exercises recently with Iran. So, what’s going to happen next? The death toll is already rising with U.S. casualties. The head (Khomeini) may be dead, but others rise to take his place. The regime remains.
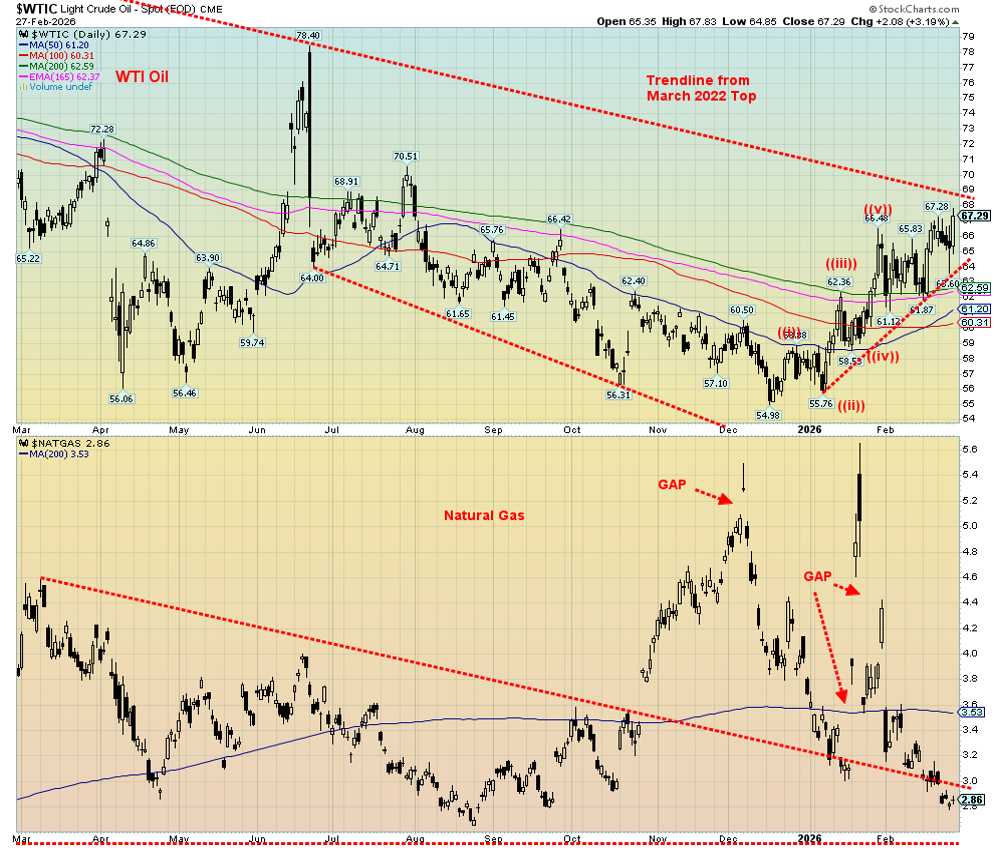
The most likely outcome is that oil prices could soar on Monday’s market opening. We jumped on Friday on rumours and the weekend’s action should result in higher oil prices. Nearby is a potential major breakout over the downtrend line from the Russia/Ukraine conflict back in 2022. That line today is at $68/$69, but we’d want to see WTI oil over $70 on volume to help confirm the breakout. Initial targets could be in the low $90s. No, the Straits of Hormuz have not been shut down, but there could be severe disruption. Bombing is underway from Iran against the UAE directly across the Straits of Hormuz. The UAE is the world’s eighth-largest oil producer and 14th-largest NG producer. They hold roughly 100 billion barrels of proven oil reserves. Note also that flights to the Middle East have been cancelled, stranding thousands. Another blow for the airlines.
As we have pointed out, the Middle East is responsible for roughly 30% of the globe’s oil production and holds upwards of 50% of global reserves. Ditto for natural gas, where the Middle East holds roughly 17%–20% of global production and about 30% of global reserves. Iran is a major oil and gas producer and holds some of the world’s largest reserves of oil and gas. As many would say, that is the real prize in toppling the regime.
On the week, WTI oil rose 1.3%, Brent crude was up 2.1%, natural gas (NG) at the Henry Hub fell again, down 5.9%, but NG at the EU Dutch Hub rose 2.7%. The ARCA Oil & Gas Index (XOI) hit 52-week highs, up 1.4%, while the TSX Energy Index (TEN) gained 1.1%. Both WTI oil and Brent are up almost 20% in 2026, while the energy indices are up over 20% this year. Expect more gains this coming week.
Markets and Trends
|
|
|
|
% Gains (Losses) Trends |
|
||||
|
|
Close Dec 31/25 |
Close Feb 27/26 |
Week |
YTD |
Daily (Short Term) |
Weekly (Intermediate) |
Monthly (Long Term) |
|
|
|
|
|
|
|
|
|
||
|
S&P 500 |
6,845.50 |
6,878.88 |
(0.4)% |
0.5% |
down |
up |
up |
|
|
Dow Jones Industrials |
48,063.29 |
48,977.92 |
(1.3)% |
1.9% |
down |
up |
up |
|
|
Dow Jones Transport |
17,357.19 |
19,689.19 |
(0.8)% |
13.4% |
up |
up |
up |
|
|
NASDAQ |
23,241.99 |
22,668.21 |
(0.6)% |
(2.5)% |
down |
up |
up |
|
|
S&P/TSX Composite |
31,712.76 |
34,339.99 (new highs) * |
1.5% |
8.3% |
up |
up |
up |
|
|
S&P/TSX Venture (CDNX) |
987.74 |
1,107.60 |
6.2% |
12.1% |
up |
up |
up |
|
|
S&P 600 (small) |
1,467.76 |
1,580.95 |
(1.5)% |
7.7% |
up |
up |
up |
|
|
ACWX MSCI World x US |
67.18 |
74.45 (new highs) * |
0.5% |
10.8% |
up |
up |
up |
|
|
Bitcoin |
87,576.98 |
65,601.13 |
(3.1)% |
(25.1)% |
down |
down |
neutral |
|
|
|
|
|
|
|
|
|
|
|
|
Gold Mining Stock Indices |
|
|
|
|
|
|
|
|
|
Gold Bugs Index (HUI) |
701.49 |
978.87 (new highs) * |
9.6% |
39.5% |
up |
up |
up |
|
|
TSX Gold Index (TGD) |
817.76 |
1,103.10 (new highs) * |
8.7% |
34.9% |
Up
|
up |
up |
|
|
|
|
|
|
|
|
|
|
|
|
% |
|
|
|
|
|
|
|
|
|
U.S. 10-Year Treasury Bond yield |
4.17% |
3.95% |
(3.4)% |
(5.3)% |
|
|
|
|
|
Cdn. 10-Year Bond CGB yield |
3.44% |
3.13% |
(2.8)% |
(9.0)% |
|
|
|
|
|
Recession Watch Spreads |
|
|
|
|
|
|
|
|
|
U.S. 2-year 10-year Treasury spread |
0.69% |
0.56% |
(6.7)% |
(18.8)% |
|
|
|
|
|
Cdn 2-year 10-year CGB spread |
0.85% |
0.73% |
(6.4)% |
(14.1)% |
|
|
|
|
|
|
|
|
|
|
|
|
|
|
|
Currencies |
|
|
|
|
|
|
|
|
|
US$ Index |
98.26 |
97.66 |
(0.1)% |
(0.6)% |
neutral |
down |
down |
|
|
Canadian $ |
72.87 |
0.7327 |
0.2% |
0.6% |
up (weak) |
up |
neutral |
|
|
Euro |
117.48 |
118.18 |
0.2% |
0.6% |
neutral |
up |
up |
|
|
Swiss Franc |
126.21 |
130.09 |
0.1% |
3.1% |
up |
up |
up |
|
|
British Pound |
134.78 |
134.74 |
(0.2)% |
flat |
down |
up |
up |
|
|
Japanese Yen |
63.83 |
64.04 |
(0.8)% |
0.3% |
neutral |
down |
down |
|
|
|
|
|
|
|
|
|
|
|
|
|
|
|
|
|
|
|
|
|
|
Precious Metals |
|
|
|
|
|
|
|
|
|
Gold |
4,311.97 |
5,259.31 |
3.3% |
22.0% |
up |
up |
up |
|
|
Silver |
71.16 |
93.71 |
11.7% |
31.7% |
up |
up |
up |
|
|
Platinum |
124.81 |
2,374.10 |
9.4% |
16.0% |
up (weak) |
up |
up |
|
|
|
|
|
|
|
|
|
|
|
|
Base Metals |
|
|
|
|
|
|
|
|
|
Palladium |
1,619.50 |
1,786.00 |
flat |
10.3% |
neutral |
up |
up |
|
|
Copper |
5.64 |
6.00 |
2.4% |
6.4% |
up |
up |
up |
|
|
|
|
|
|
|
|
|
|
|
|
Energy |
|
|
|
|
|
|
|
|
|
WTI Oil |
57.44 |
67.24 |
1.3% |
17.1% |
up |
up |
down |
|
|
Nat Gas |
3.71 |
2.86 |
(5.9)% |
(22.9)% |
down |
down |
neutral |
|
Source: www.stockcharts.com
* New All-Time Highs
Note: For an explanation of the trends, see the glossary at the end of this article.
New highs/lows refer to new 52-week highs/lows and, in some cases, all-time highs.
Copyright David Chapman 2026
GLOSSARY
Trends
Daily – Short-term trend (For swing traders)
Weekly – Intermediate-term trend (For long-term trend followers)
Monthly – Long-term secular trend (For long-term trend followers)
Up – The trend is up.
Down – The trend is down
Neutral – Indicators are mostly neutral. A trend change might be in the offing.
Weak – The trend is still up or down but it is weakening. It is also a sign that the trend might change.
Topping – Indicators are suggesting that while the trend remains up there are considerable signs that suggest that the market is topping.
Bottoming – Indicators are suggesting that while the trend is down there are considerable signs that suggest that the market is bottoming.
Disclaimer
David Chapman is not a registered advisory service and is not an exempt market dealer (EMD) nor a licensed financial advisor. He does not and cannot give individualised market advice. David Chapman has worked in the financial industry for over 40 years including large financial corporations, banks, and investment dealers. The information in this newsletter is intended only for informational and educational purposes. It should not be construed as an offer, a solicitation of an offer or sale of any security. Every effort is made to provide accurate and complete information. However, we cannot guarantee that there will be no errors. We make no claims, promises or guarantees about the accuracy, completeness, or adequacy of the contents of this commentary and expressly disclaim liability for errors and omissions in the contents of this commentary. David Chapman will always use his best efforts to ensure the accuracy and timeliness of all information. The reader assumes all risk when trading in securities and David Chapman advises consulting a licensed professional financial advisor or portfolio manager such as Enriched Investing Incorporated before proceeding with any trade or idea presented in this newsletter. David Chapman may own shares in companies mentioned in this newsletter. Before making an investment, prospective investors should review each security’s offering documents which summarize the objectives, fees, expenses and associated risks. Although Artificial Intelligence (AI) may be deployed from time to time, AI output is monitored and adjusted, if necessary, for accuracy. David Chapman shares his ideas and opinions for informational and educational purposes only and expects the reader to perform due diligence before considering a position in any security. That includes consulting with your own licensed professional financial advisor such as Enriched Investing Incorporated. Performance is not guaranteed, values change frequently, and past performance may not be repeated.
About the author


Website: https://www.enrichedinvesting.com
Disclaimer: David Chapman is not a registered advisory service and is not an exempt market dealer (EMD) nor a licensed financial advisor. We do not and cannot give individualised market advice. David Chapman has worked in the financial industry for over 40 years including large financial corporations, banks, and investment dealers. The information in this newsletter is intended only for informational and educational purposes. It should not be considered a solicitation of an offer or sale of any security. The reader assumes all risk when trading in securities and David Chapman advises consulting a licensed professional financial advisor before proceeding with any trade or idea presented in this newsletter. David Chapman may own shares in companies mentioned in this newsletter. We share our ideas and opinions for informational and educational purposes only and expect the reader to perform due diligence before considering a position in any security. That includes consulting with your own licensed professional financial advisor.