
“My father was a very successful businessman, but he was ruined in the stock market crash. A big stockbroker jumped out the window and fell on his pushcart.”
—Jackie Mason, American stand-up comedian, actor film and television; 1928–2021
“When the stock market crash, a lot of people realized that the American dream was not all it was cracked up to be. They'd been living for this thing and it was kind of a façade. It wasn't real.”
—Dominic Balli, American musician, purveyor of CaliRockReggae, styles reggae-gospel, reggae-pop, gospel, active 2006–present
“Some calamities—the 1929 stock market crash, Pearl Harbor, 9/11—have come like summer lightning, as bolts from the blue. The looming crisis of America's Ponzi entitlement structure is different. Driven by the demographics of an aging population, its causes, timing, and scope are known.”
—George Will, American libertarian-conservative commentator and author, columnist Washington Post, Pulitzer Prize winner for commentary, 1977; b: 1941
Are stock markets headed for a crash? That’s an uncomfortable truth that many would probably not want to talk about. We see numerous forecasts that the stock market is headed for a crash, but these are usually buried in the dark recesses of the internet. Yes, there are mainstream economists warning that a crash is possible. Then on May 4, 2022, The Globe and Mail’s Report on Business had on their front page “An uncomfortable truth: This stock market crash is necessary—Globe & Mail, Report on Business May 4, 2022 – Tim Kiladze.”
In fact, the front page and inside as well contained a number of different headlines that were anything but friendly to markets. Here’s a sample:
Besides the Tim Kiladze article, the following were on the front page:
- “Enbridge Line 5 pipeline faces new threat of shutdown”
- “Heat wave scorches India”
- “The impact of Russian sanctions on business will linger for decades”
- “Toronto home sales plunge 27% in April, house prices drop”
- “Blackouts amid Indian heat wave raises questions about coal usage”
- “Barrick’s massive Donlin mine faces pushback from indigenous groups”
- “Russia looks to Asia for energy buyers amid growing pressure from West, but must slash prices in order to compete”
Is it all just noise? Or do we have a problem? The bulls would call it noise, that the long-term trend is up and to stay the course. Yes, the long-term trend is up. And yes, we have broken down under the 200-day MA. However, since the major low in March 2009, we broke down under that key MA line in 2010, 2011, 2015, 2016, 2018, and 2020 but the long-term uptrend didn’t end. Each time the market recovered and soared to new highs. The bears would say these are just more warning signs. But the current issues are real. Inflation is at a 40-year high, there is a potential blowback from sanctions and decreasing global trade, the war in Ukraine continues with the West wanting the Ukraine to fight as they supply them weapons and the death toll mounts, the negative impact of climate change deepens, China’s lockdowns threaten more supply chain disruptions and are plunging even China into a slowdown, interest rates are rising, and the pandemic lingers on, which itself has sparked supply-chain disruptions and supply shortages.
We could go further. We live in a period of extreme dysfunction—political, social, and economic. The latest in the cultural wars is the possible end of the Roe vs. Wade ruling, an event that could trigger major protests going forward. The partisanship and culture wars have spread into a number of social areas. We have been witnessing the rise of populist political parties in the U.S., the EU, and possibly in Canada as well. The last time we saw this on the current scale was the 1930s.
To put things in perspective, the secular bull market in 1949–1966 broke down in 1968. The secular bull market in 1990–2000 in theory never broke down. What broke down was the 1994–2000 bull market that was steeper than the rise from 1990–1994. That bull didn’t break until 2001. The much longer 1982–2000 bull market didn’t break down until May 2002, although the market broke the four-year MA in June 2001, signaling the start of a bear market. The current market doesn’t officially break down until we are below S&P 500 2,800. The four-year MA is currently near 3,400. The 2021 yearly low is near S&P 500 3,600, so a breakdown under that level could give us a yearly reversal signal that we are entering a bear market.
Our weekly chart of the 2009 to the present bull market shows that on only two occasions did the S&P 500 break under the four-year MA, currently just above 3,400. The two breakdowns occurred in 2011 during the EU/Greek debt crisis and again during the March 2020 pandemic crash. The line was tested in 2016 and again in 2018 but didn’t break. What that tells us is that the long-term trend remains up, although we do note that the intermediate uptrend from March 2020 has broken. This does not preclude the index breaking down under the four-year MA, but the market would have to fall another 20% from current levels just to meet the four-year MA.
The Bull Market 2009–Present
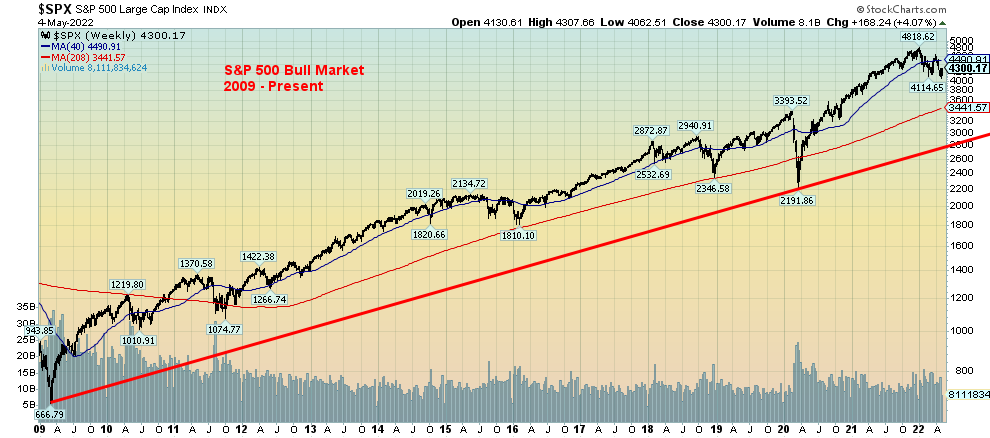
Source: www.stockcharts.com
We are showing each of the major bear markets seen over the past 50 years. What we notice is that each one of them started out with a choppy decline. Some of the rebound rallies were actually quite strong, including some in excess of 20% as we note during the 2000–2002 bear and the 2007–2009 bear. Those rallies gave hope that the bear was over. While it was not noted in any of these bears, it is possible that a rebound rally actually takes the market to small new highs. While possible, it is usually unlikely as the declines are often stair-step with lower lows and lower highs.
The trigger to send the market crashing was usually a Black Swan event, an event that largely came out of the blue even if something was expected. For the 1973–1974 bear it was the Arab Oil Embargo of October 1973 along with the infamous Saturday Night Massacre that took place during the height of the Watergate scandal. The 2000–2002 bear saw the collapse of the dot.com/high-tech sector that had seen the NASDAQ soar 278% from October 1998 to its top in March 2000. But the trigger that sent the markets even lower was the September 11, 2001 (aka 9/11) attacks. Trading on stock markets was temporarily suspended and, while the market eventually found a bottom and rebounded almost 25% into February 2002, all was for naught as the market eventually collapsed almost 35% into October 2002.
The first signs of what became the sub-prime mortgage collapse of 2007–2008 was when a couple of Bear Stearns funds collapsed in July 2007. The crisis was global in nature as the housing bubble burst, mortgage delinquencies rose, foreclosures mounted, and the billions of dollars of mortgage-related securities collapsed. This led eventually to the Lehman Brothers bankruptcy in September 2008, resulting in the final washout in the markets that eventually fell about 55% from the October 2007 top. Numerous financial institutions were caught up in the collapse and, if not for the massive bailout from central banks around the globe, the world might have been plunged into a major depression. This led to quantitative easing, and zero and in some cases
sub-zero interest rates that helped fuel the bull market of 2009 to the present.
1973–1974 Bear Market
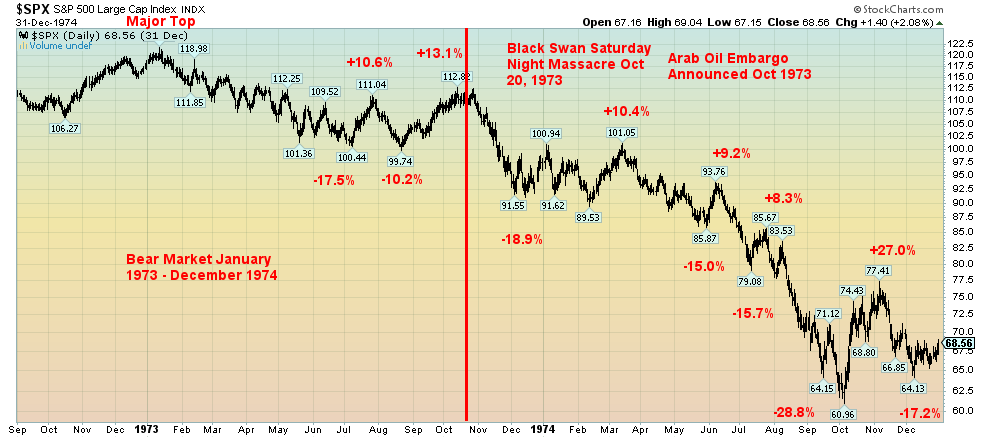
Source: www.stockcharts.com
2000-2002 Bear Market
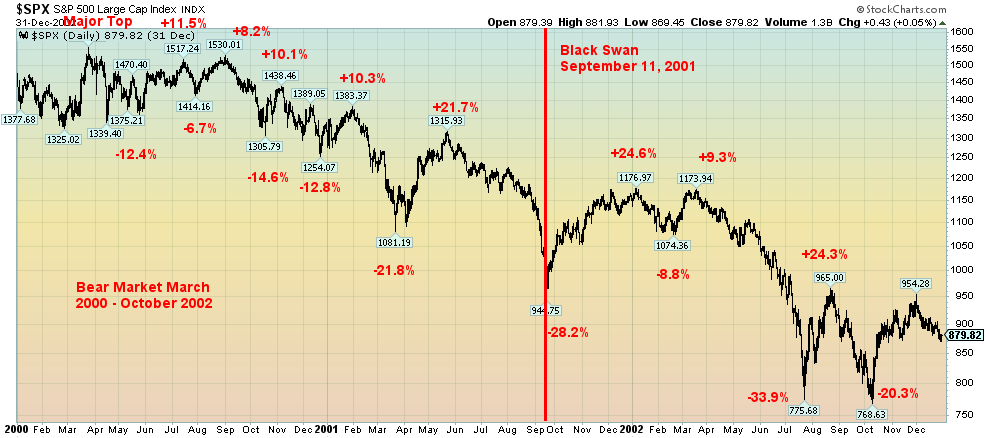
Source: www.stockcharts.com
2007-2009 Bear Market
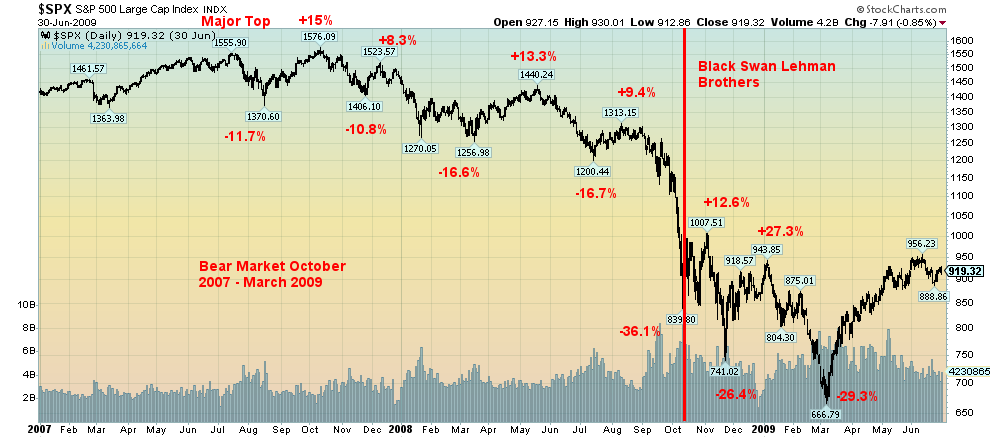
Source: www.stockcharts.com
The current decline is still in its early stages. We can’t say we that we have entered a bear market just yet, although the NASDAQ now down over 20% has entered an official bear market. We would need to see an orderly decline over a period of months before we could safely say we are entering a dangerous period. The question is, what would be the Black Swan event that could cause the stock markets to crack? An escalation in the war in Ukraine involving the West? A housing market collapse? Civil war in the U.S.? Something else?
The Unfolding 2022–? Bear Market?
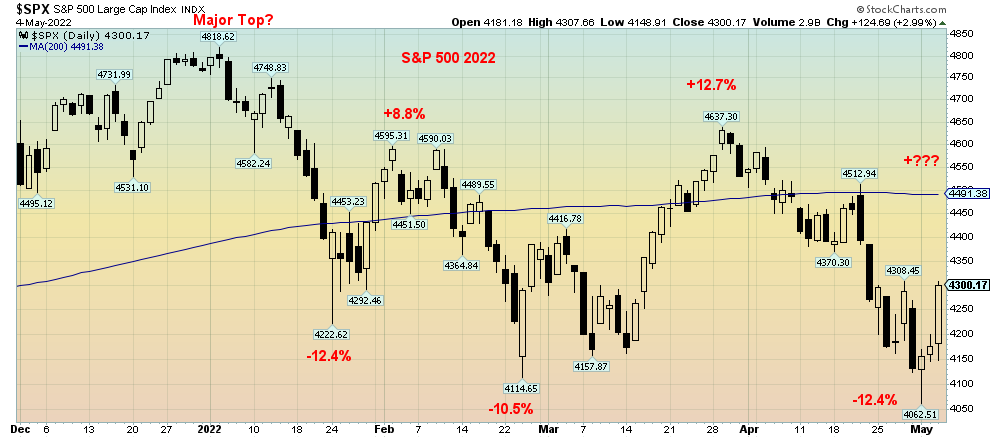
Source: www.stockcharts.com
According to the charts below, we are headed for one of the worst years on record in real terms. 2022 is not off to a very good start. The charts are hinting that things could get worse, a lot worse. Or is this as bad as it gets?
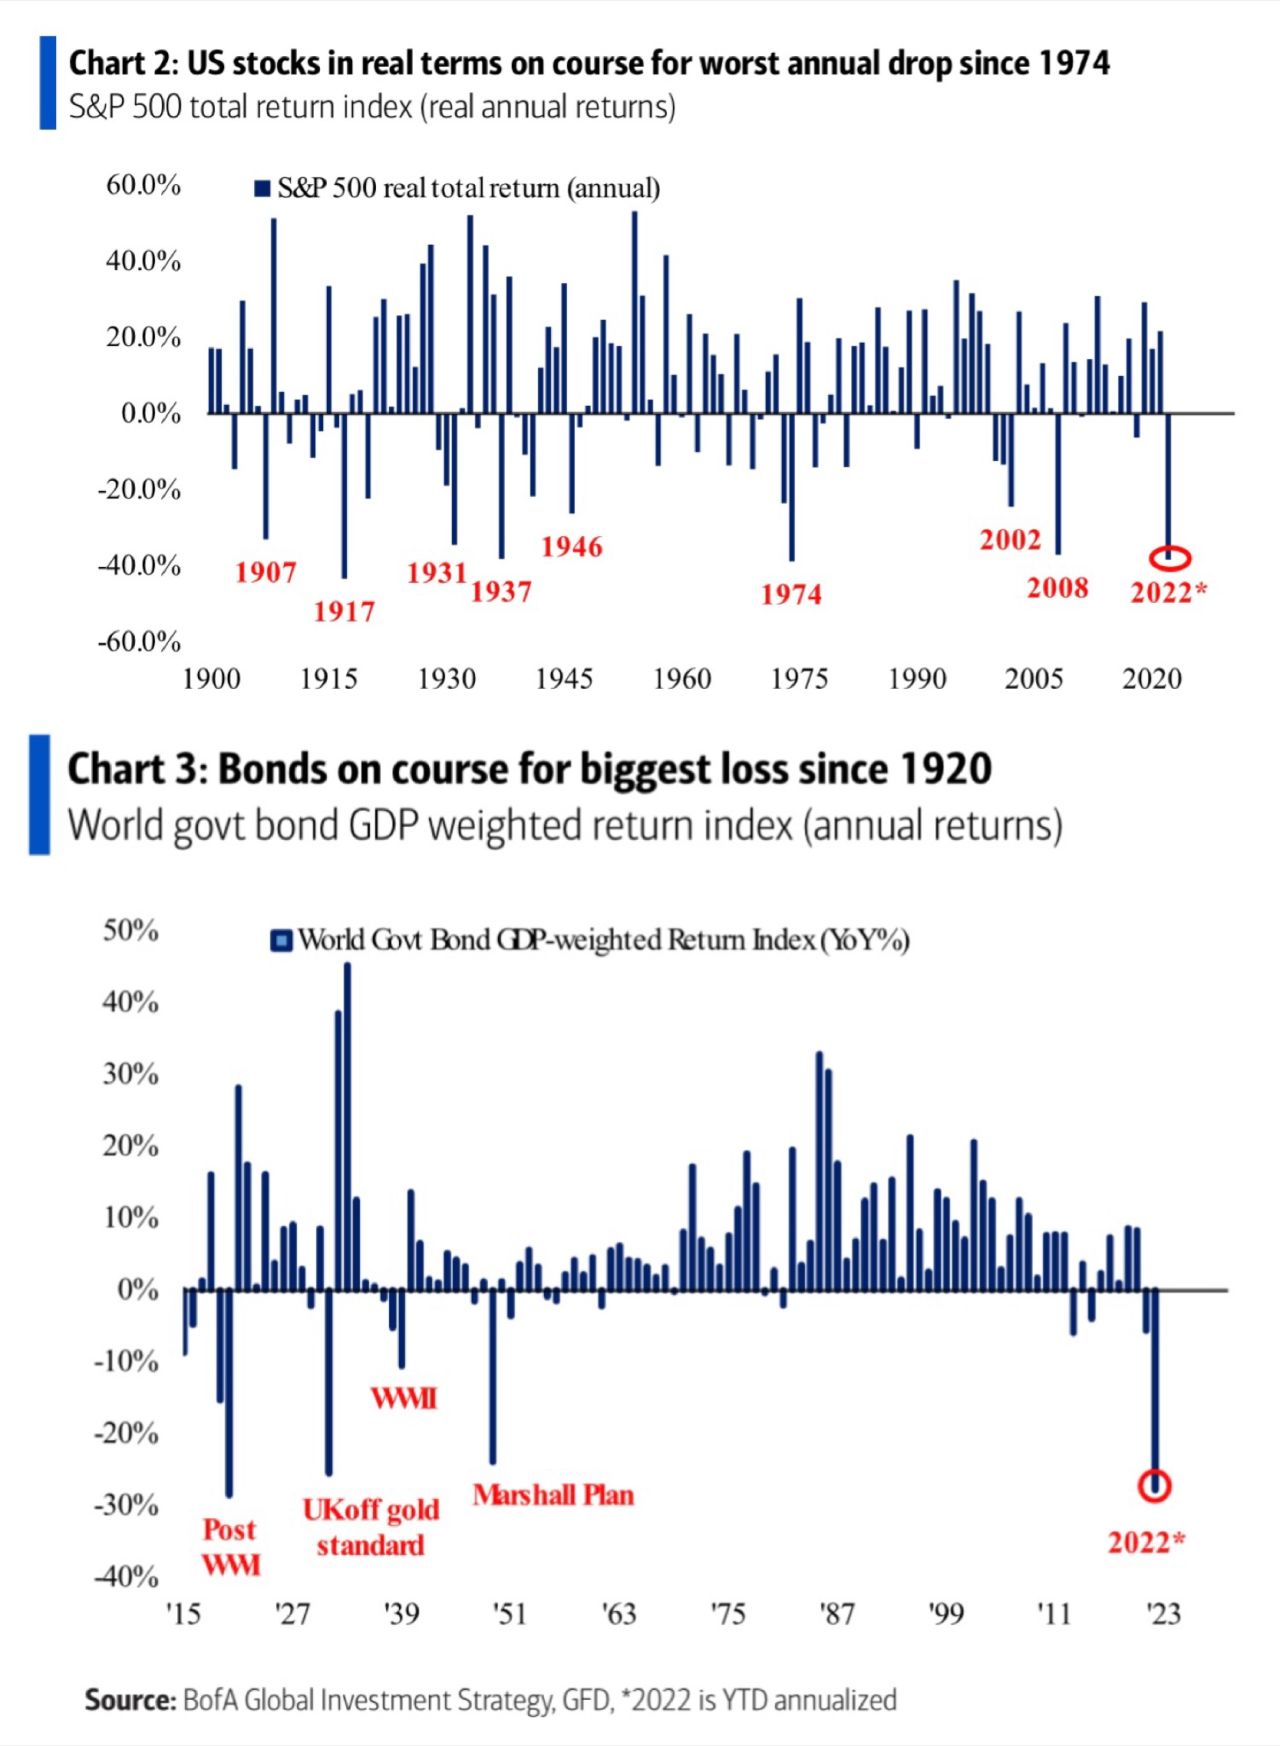
Source: www.business.bofa.com, Courtesy of James Wong, Fixed Income Portfolio Manager, GaoTeng Global Asset Management Limited, Hong Kong.
Chart of the Week
U.S. Job Numbers
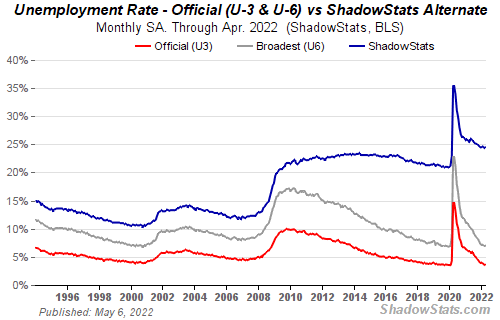
Source: www.shadowstats.com
U.S. employers added 428,000 jobs in December which was the same as was added in March. The gain was above forecasts of 391,000. It was the 12th consecutive month of 400K-plus gains. Leisure and hospitality, food and drinking services, and accommodation were the biggest gainers. The unemployment rate (U3) remained steady at 3.6%. In February 2020, before the onset of the pandemic, the unemployment rate (U3) was 3.5%. So, the job market is about as tight as it has ever been. The U6 unemployment rate (U3 plus those marginally attached, part-time for economic reasons) came in at 7.0% which was up marginally from March’s 6.9%. In February 2020 it was also 7.0%. The Shadow Stats (www.shadowstats.com) number, which is the U6 unemployment rate plus discouraged workers defined away out of the labour force in 1994 and including the long-term discouraged workers unemployed over one year, came in at 24.5% vs. 24.4% in March and 21.3% in February 2020. It appears that long-term unemployment is rising, even as the official numbers remain low. This could be reflecting the mismatch in skills. Jobs required are higher skilled and there is an army of unskilled workers.
All Employees – Total NonFarm (thousands of persons)
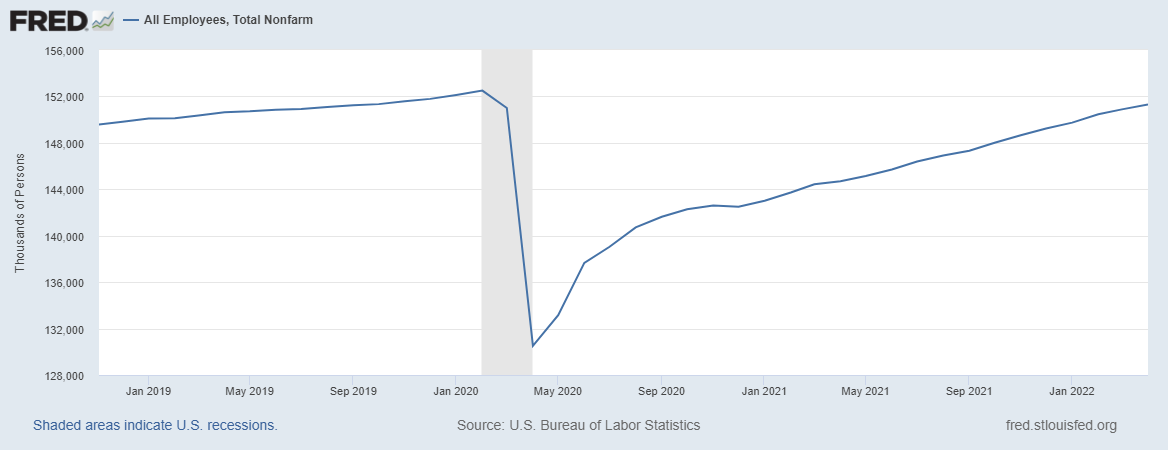
Source: www.bls.gov, www.stlouisfed.org
Despite the better-than-expected gain total, nonfarm remains down 1,190,000 jobs from where they were in February 2020. Yet they insist on calling the economy recovered. How can it be recovered if we are still short 1.2 million jobs? And that is despite a population increase of 1,287,000 since February 2020 and a labour force that actually contracted in April 2022 by 363,000 and remains down 537,000 from February 2020. What that tells us (and the numbers appear to support it) is that prime age employees are leaving the job market. They may be retiring or converting to self-employment. The number of people employed full-time in April contracted 651,000 in April from March but is up from February 2020 by 1,228,000. Part-time employment grew in April by 189,000 but is down 1,757,000 from February 2020.
The labour force participation rate fell in April to 62.2% from 62.4% in March and 63.4% in February 2020. A lower participation rate helps to lower the unemployment rate. The employment population ratio was 60.0% vs. 60.1% in March and 61.2% in February 2020. That translates into fewer people working as a percentage of the working age population. The actual number of people unemployed (U3) was 5,941,000, down from 5,952,000 in March. In February 2020 it was 5,717,000. The number not in the labour force jumped to 100,170,000 from 99,170,000 in March. In February 2020 it was 95,393,000. The bulk of it is retired people at 56.4 million and disabled people at 25.2 million.
Average hourly earnings were up 5.5% year over year, but as inflation is 8.5%, they continue to lag. Seems that employers are not having to pay up as much as they used to. Wage increases are not the cause of inflation as they continue to lag and have for several months. The damper on wage increases has some economists chortling that will bring down the rate of inflation.
U.S. Average Hourly Earnings vs. Inflation Rate
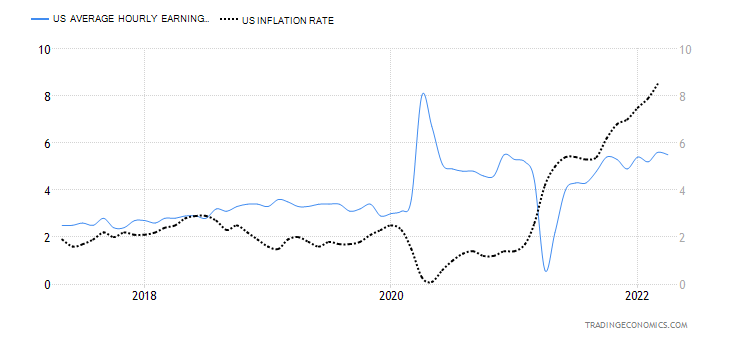
Source: www.tradingeconomics.com, www.bls.gov
Economists appear to be viewing the April jobs report as a sign that the U.S. economy remains strong, despite some underlying concerns and that the number of jobs remains well over 1.1 million below where it was in February 2020. Wages are falling behind the rate of inflation and that could bring some labour unrest. A record 4.5 million quit their job in March (latest available). That’s almost 1.1 million more than quit in February 2020. One of the prime reasons for quitting is many believe they can find a better job elsewhere so they are leaving undesirable jobs to seek better opportunities and they feel confident they’ll find them.
Canada Employment Change and Unemployment Rate
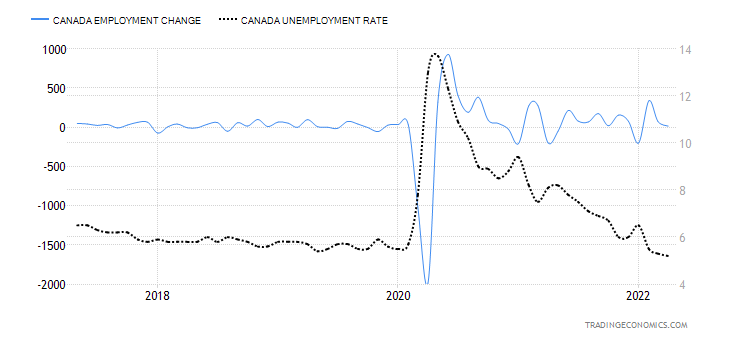
Source: www.tradingeconomics.com, www.statcan.gc.ca
Canada added 15,300 jobs in April which was well below the expected 55,000 and the 75,000 increase in March. But it was a mixed bag as full-time employment fell 31,600 and part-time employment rose 47,100. Canada has done well, however, as there are 441,600 more employed today than there were in February 2020. The unemployment rate fell to 5.2% in April from 5.3% in March. It was the lowest rate on record since 1976. Even the R8 unemployment rate improved, falling to 7.6% from 8.3%. The R8 rate is the highest unemployment rate that Statistics Canada reports and it includes discouraged workers plus the waiting group portion of involuntary part-timers. It is the lowest R8 rate on record and supports the fact that the number of involuntary part-time workers continues to fall.
Stats Canada reported that there were gains in professional, scientific and technical services, and public administration that were offset by declines in construction and retail trade. Employment improved in the Maritimes and Alberta but dropped in Quebec. Women gained as men saw a decline. Hours worked were down 1.9%, sparked mostly by absences due to a rise in Omicron, even as most suffered mild symptoms only but enough to keep them off work. Average hourly wages grew 3.3% year over year, but that’s against a background of an inflation rate of 6.7% last in March. Simply, wages are not keeping up with inflation.
Canada’s job growth is expected to slow going forward, largely because with so many now employed there are simply not enough people seeking employment to go around. With the unemployment rate at 5.2%, many are considering that full employment. The labour force participation rate is at 65.3% vs. 65.4% in March. Fewer people working as a percentage of the total labour force helps also to lower the unemployment rate.
Overall, this continued to be a good report for Canada even if it fell short of expectations. With job growth slowing it is a reflection of slowing of supply of new workers which could translate into a slowing of growth. The report is not going to dissuade the Bank of Canada (BofC) from its current tightening regime. With headline inflation approaching 7% and the BofC rate at 1%, the bank has a way to go to catch up to the rate of inflation. Rising interest rates are already having a negative impact on housing sales as they dipped sharply in the two largest markets, Toronto and Vancouver. Prices were steady, but that could soon translate into falling prices.
One statistic we picked up that was interesting was that the proportion of employees earning less than $20/hour made up 25.9% of all employees vs. 35.5% back in April 2019. It shows that the job market is tight and employers are offering better wages. On the other side, the proportion earning $40/hour or more rose to 24.5%, up from 18.0% in April 2019. And after all that, wage gains are still lagging the rate of inflation
Markets & Trends
|
|
|
|
% Gains (Losses) Trends
|
|
||||
|
|
Close Dec 31/21 |
Close May 6/22 |
Week |
YTD |
Daily (Short Term) |
Weekly (Intermediate) |
Monthly (Long Term) |
|
|
Stock Market Indices |
|
|
|
|
|
|
|
|
|
S&P 500 |
4,766.18 |
4,123.34 (new lows) |
(0.2)% |
(13.5)% |
down |
down |
up |
|
|
Dow Jones Industrials |
36,333.30 |
32,899.37 |
(0.2)% |
(9.5)% |
down |
down |
up |
|
|
Dow Jones Transports |
16,478.26 |
14,900.85 |
0.2% |
(9.6)% |
down |
down (weak) |
up |
|
|
NASDAQ |
15,644.97 |
12,144.66 (new lows) |
(1.5)% |
(22.4)% |
down |
down |
up (weak) |
|
|
S&P/TSX Composite |
21,222.84 |
22,633.28 |
(0.6)% |
(2.8)% |
down |
down (weak) |
up |
|
|
S&P/TSX Venture (CDNX) |
939.18 |
769.97 (new lows) |
(5.5)% |
(18.0)% |
down |
down |
neutral |
|
|
S&P 600 |
1,401.71 |
1,208.75 (new lows) |
(0.5)% |
(13.8)% |
down |
down |
up (weak) |
|
|
MSCI World Index |
2,354.17 |
2,037.96 |
(1.0)% |
(13.4)% |
down |
down |
neutral |
|
|
NYSE Bitcoin Index |
47,907.71 |
36,053.33 |
(7.4)% |
(24.7)% |
down |
down |
up (weak) |
|
|
|
|
|
|
|
|
|
|
|
|
Gold Mining Stock Indices |
|
|
|
|
|
|
|
|
|
Gold Bugs Index (HUI) |
258.87 |
274.06 |
(2.9)% |
5.9% |
down |
up (weak) |
up |
|
|
TSX Gold Index (TGD) |
292.16 |
326.05 |
(1.2)% |
11.6% |
down |
up |
up |
|
|
|
|
|
|
|
|
|
|
|
|
Fixed Income Yields/Spreads |
|
|
|
|
|
|
|
|
|
U.S. 10-Year Treasury Bond yield |
1.52% |
3.14% (new highs) |
7.2% |
106.6% |
|
|
|
|
|
Cdn. 10-Year Bond CGB yield |
1.43% |
3.09% (new highs) |
7.7% |
116.1% |
|
|
|
|
|
Recession Watch Spreads |
|
|
|
|
|
|
|
|
|
U.S. 2-year 10-year Treasury spread |
0.79% |
0.41% |
95.2% |
(48.1)% |
|
|
|
|
|
Cdn 2-year 10-year CGB spread |
0.48% |
0.36% |
44.0% |
(25.0)% |
|
|
|
|
|
|
|
|
|
|
|
|
|
|
|
Currencies |
|
|
|
|
|
|
|
|
|
US$ Index |
95.59 |
103.69 (new highs) |
0.7% |
8.5% |
up |
up |
up |
|
|
Canadian $ |
.7905 |
0.7747 |
(0.6)% |
(2.0)% |
down |
down |
up |
|
|
Euro |
113.74 |
105.43 |
(0.1)% |
(7.3)% |
down |
down |
down |
|
|
Swiss Franc |
109.77 |
101.18 (new lows) |
(1.6)% |
(7.8)% |
down |
down |
down |
|
|
British Pound |
135.45 |
123.36 (new lows) |
(1.9)% |
(8.9)% |
down |
down |
down |
|
|
Japanese Yen |
86.85 |
76.59 |
(0.6)% |
(11.8)% |
down |
down |
down |
|
|
|
|
|
|
|
|
|
|
|
|
|
|
|
|
|
|
|
|
|
|
Precious Metals |
|
|
|
|
|
|
|
|
|
Gold |
1,828.60 |
1,882.80 |
(1.5)% |
3.0% |
down |
up (weak) |
up |
|
|
Silver |
23.35 |
22.37 |
(3.1)% |
(4.2)% |
down |
down |
neutral |
|
|
Platinum |
966.20 |
956.00 |
1.8% |
(1.1)% |
down |
down |
neutral |
|
|
|
|
|
|
|
|
|
|
|
|
Base Metals |
|
|
|
|
|
|
|
|
|
Palladium |
1,912.10 |
2,023.20 |
(12.3)% |
5.8% |
down |
down (weak) |
up |
|
|
Copper |
4.46 |
4.27 |
(3.2)% |
(4.4)% |
down |
down |
up |
|
|
|
|
|
|
|
|
|
|
|
|
Energy |
|
|
|
|
|
|
|
|
|
WTI Oil |
75.21 |
109.77 |
4.9% |
46.0% |
up |
up |
up |
|
|
Natural Gas |
3.73 |
8.04 (new highs) |
11.1% |
115.6% |
up |
up |
up |
|
Source: www.stockcharts.com
Note: For an explanation of the trends, see the glossary at the end of this article.
New highs/lows refer to new 52-week highs/lows and, in some cases, all-time highs.
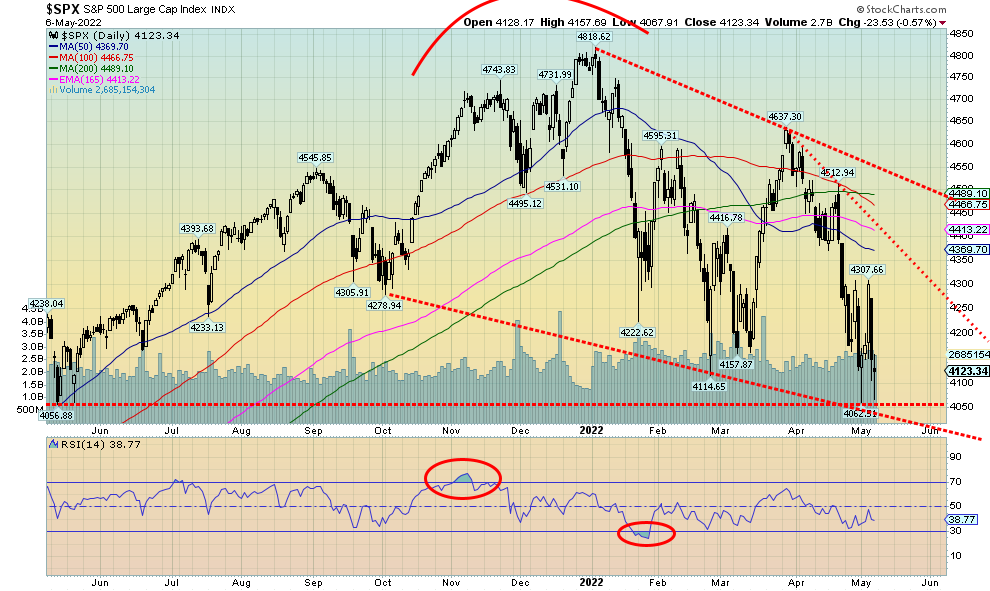
Source: www.stockcharts.com
It was another miserable week in the markets as attempts at a rally earlier in the week were wiped out on Thursday. Still, the indices ended the week only marginally down. The S&P 500 lost 0.2% as did the Dow Jones Industrials (DJI), but the Dow Jones Transportations (DJT) eked out a small 0.2% gain. The S&P 500 Equal Weight also lost about 0.2%. The NASDAQ lost 1.5% while the small-cap S&P 600 (SML) dropped 0.5%. The S&P 500, S&P 600, and the NASDAQ hit 52-week lows. In Canada, the TSX Composite lost 0.6% while the small-cap TSX Venture Exchange (CDNX) dropped 5.5%. In the EU, the London FTSE fell 0.5%, the Paris CAC 40 dropped 4.2%, while the German DAX was down 3.0%. In Asia, China’s Shanghai Index (SSEC) fell 1.5% but the Tokyo Nikkei Dow (TKN) gained 0.6%, providing a bright spot.
With markets being battered by the Russia/Ukraine war, sharply rising inflation, rising interest rates (with more to come), and some potential for a slowing economy (and earnings), the odds of the markets starting a rebound appear slim. Worse, quantitative tightening (QT) is about to get underway with $95 billion/month. The last time we saw QT was 2018 and that year the markets were, well, “crappy,” including a 20% decline in Q4 (reviewed later). But sometimes all the negative sentiment results in a low, so if we are going by the sinking sentiment alone a rebound could start at any time. But will it have any legs?
Our main essay showed how, in the early stages of a bear market, the market can actually be quite choppy for a number of months before the wheels really come off the bus. We could even see a rebound rally that takes us to new highs. But right now, there are just too many negatives, so the bulls’ optimism might be misplaced.
Our preference is to use points of reference to tell us that things are changing. We look for divergences in markets or look for a positive reaction to negative news. But danger lies just below. Below 4,050 for the S&P 500 we could start another sharp down leg. Rallies could develop, but right now we’d have to regain above 4,500 to tell us that the bear is most likely over. As long as we remain under that level, the odds favour the downside, even following a rebound. As we have noted, we’ve had a few rallies since the top was seen in January but all have eventually died and the market continued its down-swing to make new lows. The daily and intermediate trends are now down, and while the long-term monthly trend is still positive it is clearly weakening.
Global indices are also weak and the EU indices appear to be cracking under the strain of the Russia/Ukraine war and threats to embargo Russian oil. The Fed will likely hike interest rates another 50 bp at the June FOMC on June 14–15. And until we see some signs of inflation abating, it will keep upward pressure on the U.S. 10-year treasury. The FAANGs have been one of the worst-performing sectors with the NY FANG Index down 35.2% from its November 2021 top. The FAANGs, along with high-tech and semi-conductor stocks, have been the leaders to the downside. They were also the leaders to the upside. If the markets are to recover, then they need new leadership. Energy, the current top performer is not strong enough in itself to help the markets recover. While the material sector (metals, commodities) has held up better than most, it also is not enough to revive this market. All of this points to an ongoing bear with periodic strong rebound rallies that will sucker many back in again. We highly doubt we have the conditions to set up a strong rebound. Not with interest rates rising and QT happening, inflation raging, and $6/gallon gasoline.
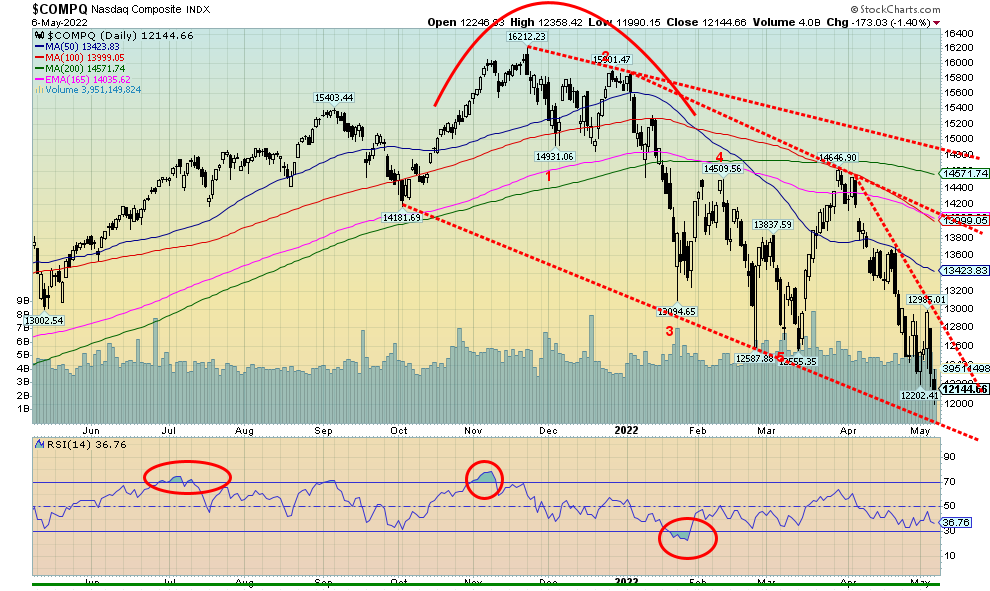
Source: www.stockcharts.com
The NASDAQ is in a bear market, down now 22.4% on the year and down 25% from the early January 2022 top. We could argue that the market is oversold and due for a bounce. But the bottom of that channel, currently down around 11,000, looks enticing. Only 14% of NASDAQ stocks are trading over their 50-day MA and only 12.7% are over their 200-day MA. Those are not quite at the depressed levels seen in March 2020 but we are approaching them. The NASDAQ Bullish Percent Index (BPNDX) is at 29% in bear territory but a long way from 8% seen in March 2020. Still, bearish sentiment is rising and high bearish sentiment could lead to a rebound rally. The NASDAQ has elected a monthly reversal, given it has taken out the lows of 2021. The lows of 2020 remain distant near 6,600. The NASDAQ could break its current steep downtrend above 12,800, but we need to first regain above 14,000 and then above 14,600 before we could confirm a bottom.
Source: www.stockcharts.com
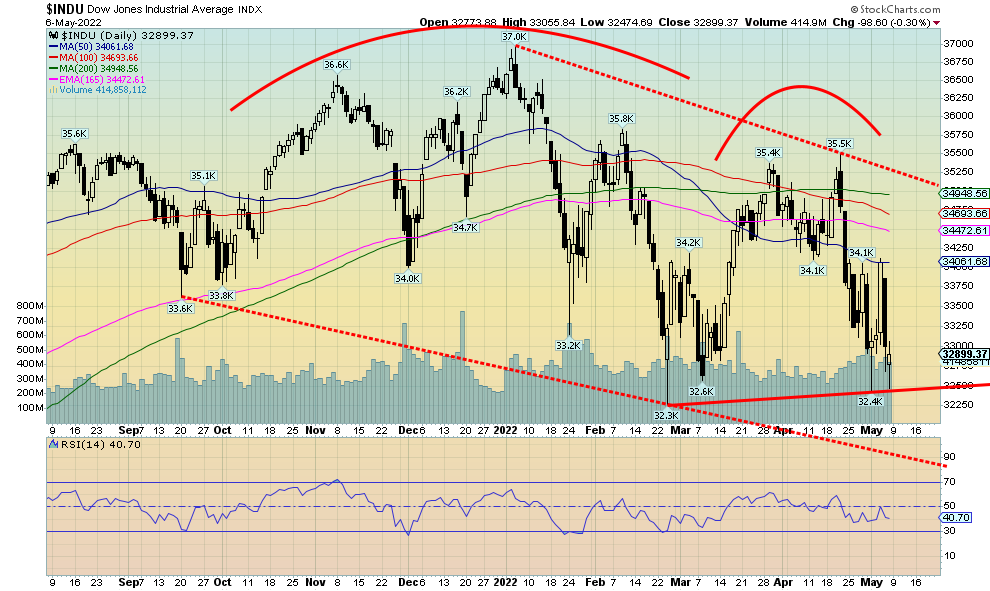
While the S&P 500 and the NASDAQ made new lows this past week for the current move down, the DJI did not make new lows. Some may look at this as a divergence. But we wouldn’t read too much into it just yet. The DJT has been performing quite well and comparatively the DJT has outperformed the DJI during the decline. The DJI closed below 32,900 (just) this past week and that could indicate that there is more downside to come. We are seeing typical action. The DJI plunges, then buyers come in. Volatility reigns as witnessed by the big 932-point up day on May 4 followed by a 1,064-point down day on May 5. The 932 gain was the 11th biggest point gain while the 1064 down day was the 9th biggest point loss. That they followed one after another pointed to the huge volatility in the market, volatility we haven’t seen since March 2020. Even on Friday following the nonfarm numbers the market was volatile with the range being 581 points. That we finished only marginally down is not to dismiss the volatility. The DJI is now down 9.5% on the year. A far cry from the 22.4% the NASDAQ is down. But then the blue chips are doing what they are supposed to do—outperform in a bear market. But will it last? Another break now under 32,475 could send the DJI down to the next good support near 31,700/31,800 and even down to 30,500. Yes, bounces will occur but right now, unless we regain above 34,100, we see little hope of an immediate bottom here. A breakout would occur over 35,000.
Source: www.stockcharts.com
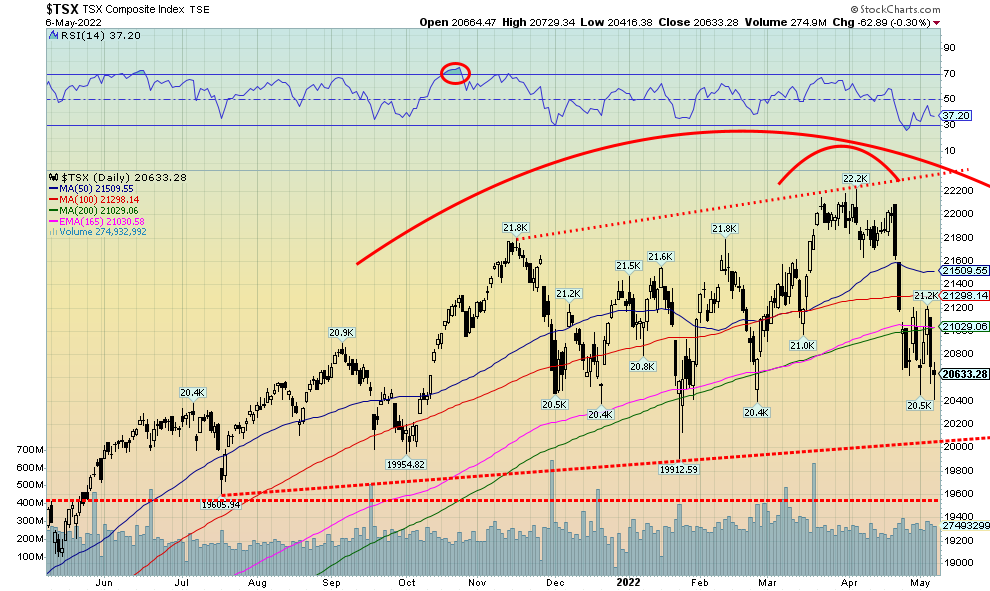
The TSX Composite followed the U.S. stock markets lower this past week, losing 0.6%. The TSX is now down on the year by 2.8%. The TSX Venture Exchange (CDNX) continued its recent weakness, losing 5.5% to fresh 52-week lows. The TSX started its decline back on April 21 and the drop was swift. In five days the TSX lost 5.7%, including couple of gap-down days. The TSX is now under the 200-day MA, suggesting we could be seeing the start of a bear market. The only reason the TSX didn’t fall further this past week was because the Energy (TEN) index which makes up almost 14% of the index. Energy gained 5.1% this past week, the only sub-index to do so. Leading the way to the downside was Real Estate (TRE), losing 5.4% to fresh 52-week lows. Other big losers were Information Technology (TKK) down 5.1%, Income Trusts (TCM) down 4.1%, and Health Care (THC) off 5.2%. Hitting 52-week lows were Consumer Discretionary (TCD) down 3.8%, plus the previously mentioned TRE, TTK, and THC. The TEN hit fresh 52-week highs. We see support for the TSX down to around 20,000 and below that to 19,600. But we need to regain above 21,500 to suggest that we may have made a bottom.
U.S. 10-year Treasury Bond/Canadian 10-year Government Bond (CGB)
Source: www.tradingeconomics.com, www.home.treasury.gov, www.bankofcanada.ca
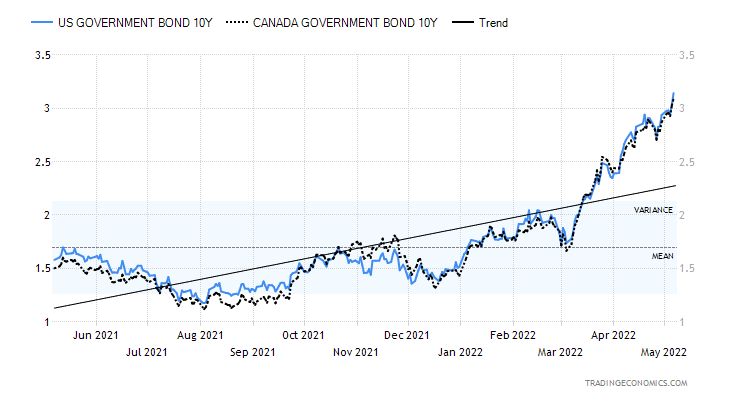
The U.S. 10-year treasury note rose to over 3.00% this past week. Those levels were last seen in 2018. The Fed as expected hiked rates by 50 bp and are hinting at another 50 bp at the FOMC on June 14–15. As well, quantitative tightening is about to get underway as the Fed rolls off $95 billion/month (see next charts). Adding to the concern over rates was the somewhat better than expected nonfarm payrolls on Friday that came in at 428,000, slightly above expectations. As well, the unemployment rate (U3) remains down at levels last seen just before the onset of the pandemic in February 2020. The economy still appears to be good, although there are dark clouds gathering. The ISM Manufacturing Index for April came in at 55.4, although it was below expectations of 57.5 and March’s 57.1 reading. Factory orders jumped 2.2% in April above the expected 0.7%. The ADP employment change was only 247,000, well below the expected 430,000 and the weekly jobless claims jumped to 200,000 when they only expected 182,000. Those numbers set up some expectation that Friday’s nonfarm would disappoint. It didn’t. The result now is expectation of more interest rate hikes and a continued rise in the 10-year. At least the two-year didn’t jump this past week, so the 2–10 spread widened out again to 41 bp. Forecasts of a recession usually only occur when the 2–10 spread turns negative and especially the three-month T-Bill-10 year spread turns negative. It’s nowhere near negative, currently at a very wide 2.28%. On that basis, forecasts of a coming recession seem a bit premature. At this point we can’t say with clarity where the 10-year could top (yield), but the trend remains to the upside. It would take a break back under 2.70% to suggest to us that we may have seen a high.
U.S. Inflation, 10-year, two-year, and Effective Fed Funds
Source: www.stlouisfed.org
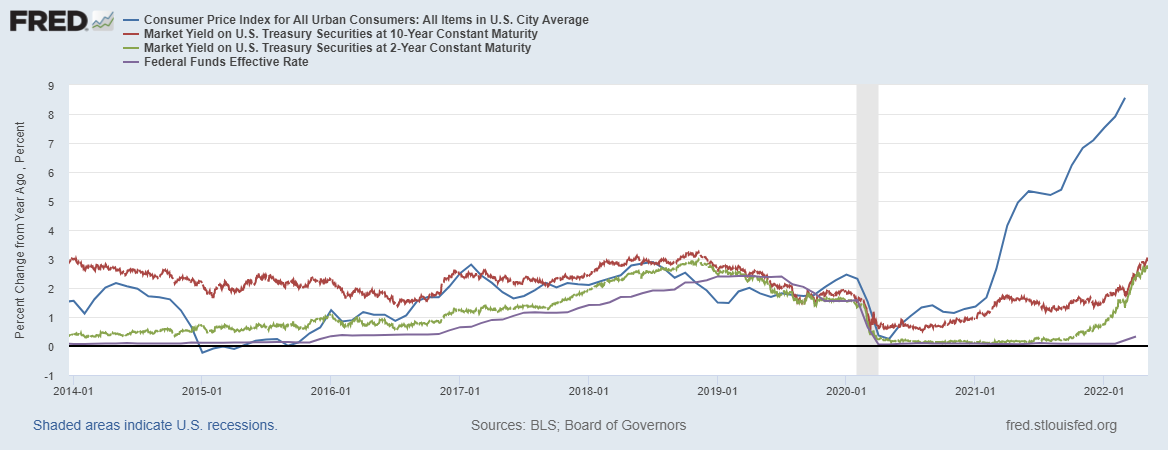
Above, we show that inflation is now surpassing interest rates all across the yield curve. The above chart shows the year-over-year change for the CPI (+8.6%), the U.S. 10-year year treasury note (3.14%), the U.S. 2-year treasury note (2.73%), and the Fed Funds rate (0.83%). No wonder the Fed wants to narrow that to help bring down inflation. But the Fed is not only going to hike interest rates: they are going to start quantitative tightening (QT). During the pandemic the Fed bought a staggering $3.3 trillion of treasuries and $1.3 trillion in mortgages. Their plan now is to roll off some $95 billion/month ($60 billion in treasuries and $35 billion in mortgages). That’s $1.14 trillion in a year. The last time the Fed did quantitative tightening was starting in 2018. The result was that 2018 was a very rocky year for the stock market, including a nasty drop in Q4 when the S&P 500 fell just over 20%. Note the chart below showing QT and the rocky 2018 stock market. QT, coupled with hiking interest rates, has consequences.
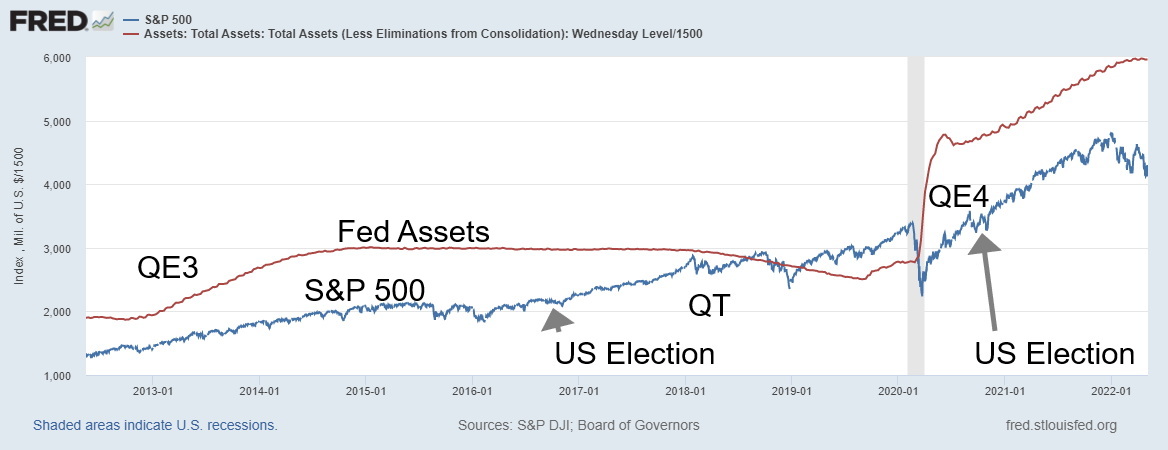
Source: www.stlouisfed.org, www.mcoscillator.com
Source: www.stockcharts.com
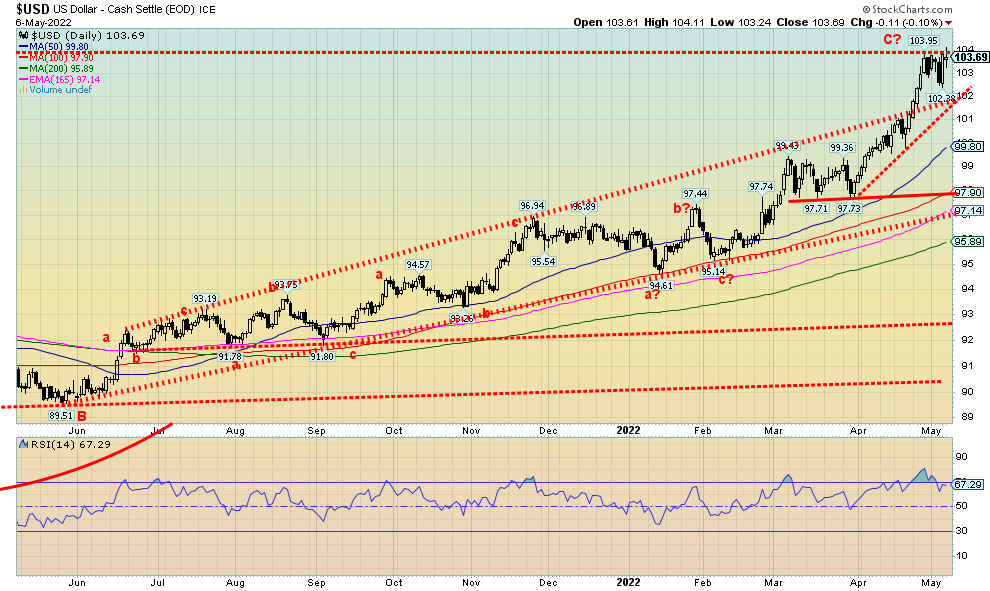
The US$ Index soared to 20-year highs this past week as the U.S. dollar continued to benefit from higher interest rates as capital continues to flee the EU and China, with the U.S. dollar and the U.S. perceived as a safe haven.
G7 Plus China Interest Rates
|
Country |
Major 10-year Bond Yield % |
Central Bank Rate % |
|
U.S.A. |
3.14% |
1.00% |
|
Canada |
3.09% |
1.00% |
|
U.K. |
2.01% |
1.00% |
|
Germany |
1.13% |
0% |
|
France |
1.65% |
0% |
|
Italy |
3.15% |
0% |
|
Japan |
0.25% |
-0.1% |
|
China |
2.83% |
3.7% |
|
ECB |
NA |
0% |
Source: www.tradingeconomics.com
The US$ Index jumped 0.7% this past week, hitting fresh 52-week highs. The euro fell a small 0.1% but avoided fresh 52-week lows. A divergence between the euro and the US$ Index? The Swiss franc didn’t escape as it did make 52-week lows, losing 1.6%. The pound sterling also dropped 1.9% to fresh 52-week lows. The Japanese yen avoided new 52-week lows but still fell 0.6%. The Canadian dollar didn’t escape despite higher oil prices, losing 0.6%. All the major currencies are down on the year.
The one thing holding the US$ Index back is that it is bumping up against resistance in the 103.75/104.00 zone. Highs were seen in this zone in 2020 and earlier in 2016. The last major low for the US$ Index was seen in 2008 and, before that, significant lows were seen in 1978 and 1992. Merriman cycles (www.mmacycles.com) suggests that the US$ Index follows a rough 15-year cycle. If that’s correct, that tells us we are currently 13/14 years into the current cycle (last low in 2008) and that we should soon be seeing the downside to this cycle. A strong U.S. dollar is anathema to gold, but despite the recent strength for the US$ Index, gold has held to the upside thus far in 2022. We have to take that as a positive.
A return back under 102.00 would most likely signal the end of this rally for the US$ Index. Under 101 we could see a sharp downswing get underway. The daily, weekly, and monthly RSIs are above 70, suggesting that the US$ Index is overbought across all major time frames. This past week the US$ Index made fresh 52-week highs but the euro did not make fresh 52-week lows, a possible divergence (unconfirmed). Still, a downswing now is a matter of when, not if.
Russian Ruble
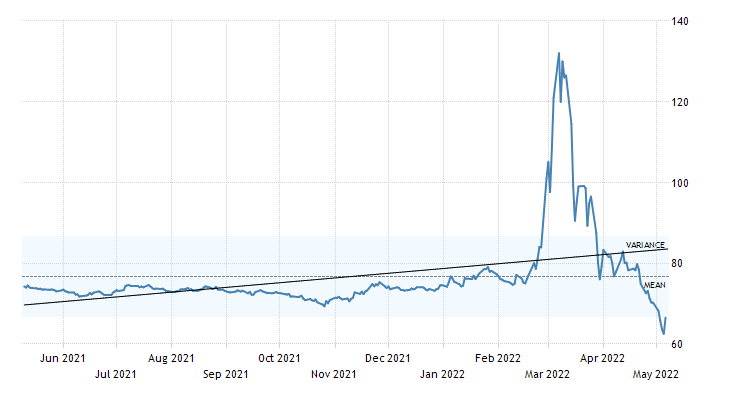
Source: www.tradingeconomics.com, www.cbr.ru
We couldn’t resist this. The Russian ruble is now better than it was when sanctions were imposed. The ruble collapsed to US$1 = 150 rubles in March following the invasion but now, thanks to tough capital controls, higher interest rates, mandated conversions, and foreign capital unable to convert their rubles to U.S. dollars, the ruble is now at a two-year high, currently US$1 = 66.50. So much for sanctions.
Source: www.stockcharts.com
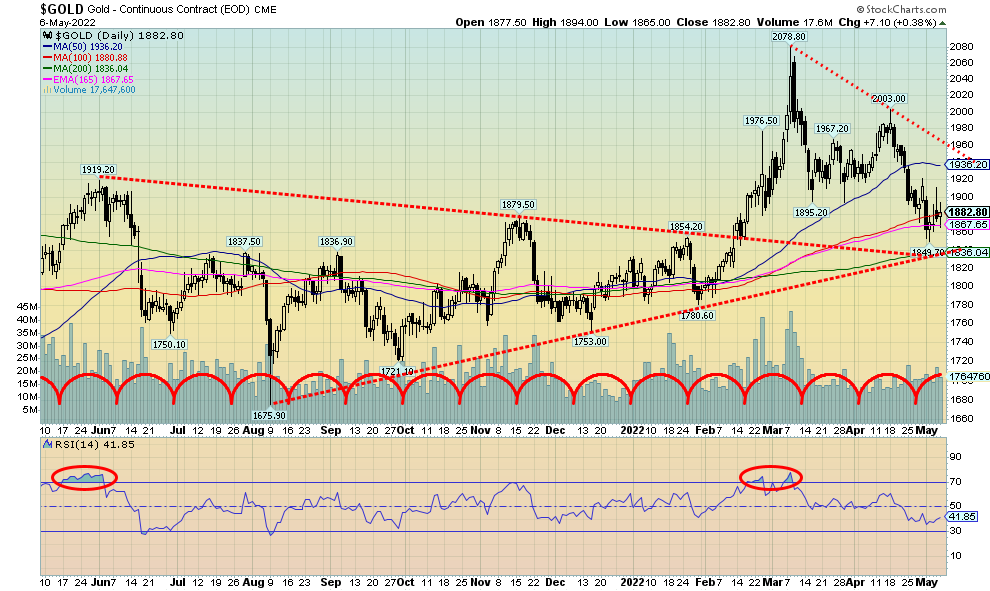
Gold continues to get no respect, due to fears of interest rate hikes and the US$ Index soaring to a 20-year high. Gold fell for the third consecutive week, losing 1.5%, but it remains up in 2022 by almost 3.0%. Silver was dragged down even more, off 3.1%. However, platinum prices surprised to the upside, gaining 1.8%. Near precious metals like palladium and copper fell on fears of demand destruction, sparked mostly by the slowdown in China. Palladium fell a sharp 12.3% while copper was down 3.2%. The gold stock indices also fell with the Gold Bugs Index (HUI) down 2.9% and the TSX Gold Index (TGD) off 1.2%. While gold remains up in 2022, silver has turned down off 4.2% and copper is down 4.4% in 2022. Platinum is still down 1.1% despite this past week’s gains and palladium has had its gains trimmed down to up 5.8% in 2022.
Gold appears to be trying to find some support around the 100-day MA near $1,880. Further support can be seen below down to $1,830 and the 200-day MA and an uptrend line from the August 2021 low. A breakdown under $1,820 would be negative and under $1,780 could be fatal.
The pattern since the recent top at $2,078 appears to be a corrective ABC, but instead we could be working on a third wave to the downside. That’s why it’s important that the market finds some support at current levels or down to $1,830. Gold is being knocked down because of a) the persistently high US$ Index, b) rising interest rates as the 10-year jumped over 3% this past week and the Fed is dedicated to a further interest rate hike, probably another 50 bp at the June meeting, and c) continued signs of economic growth as evidenced by the stronger than expected April job numbers. But the positives for gold are growing as well, given geopolitical
uncertainty, domestic political uncertainty, plus signs that stagflation could set in, especially given the deteriorating situation in China that could also drag down the global economy.
Source: www.cotpricecharts.com
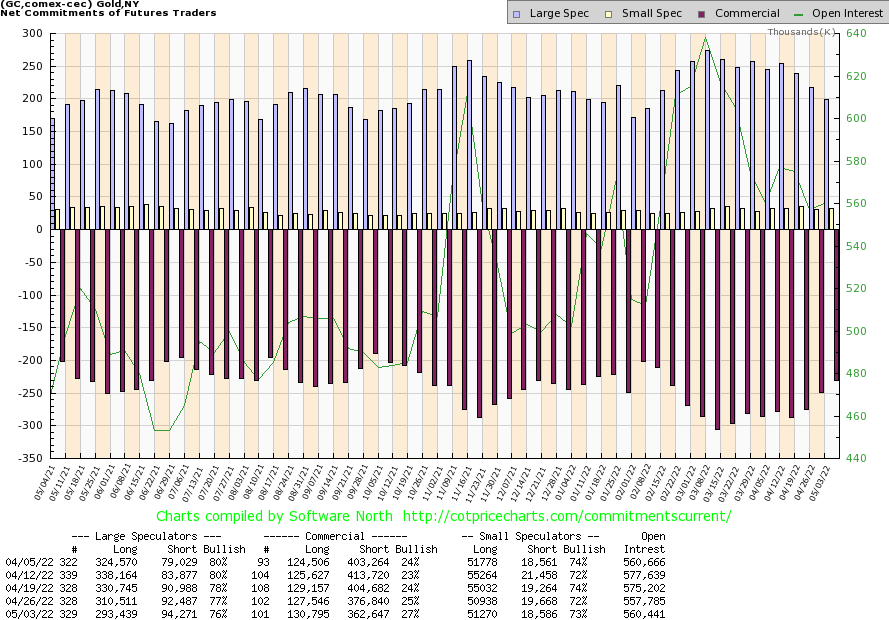
Once again the commercial COT (bullion companies and banks) for gold improved from 25% to 27%, the best level seen late 2021 before a rally got underway. Long open interest rose over 3,000 contracts while short open interest fell about 14,000 contracts. The large speculators COT (hedge funds, managed futures, etc.) slipped to 76% from 77% as they shed about 17,000 longs and added about 2,000 shorts. Overall open interest rose about 3,000 contracts during a down week for gold. We view this report as at least mildly bullish, based on previous positions.
Source: www.stockcharts.com
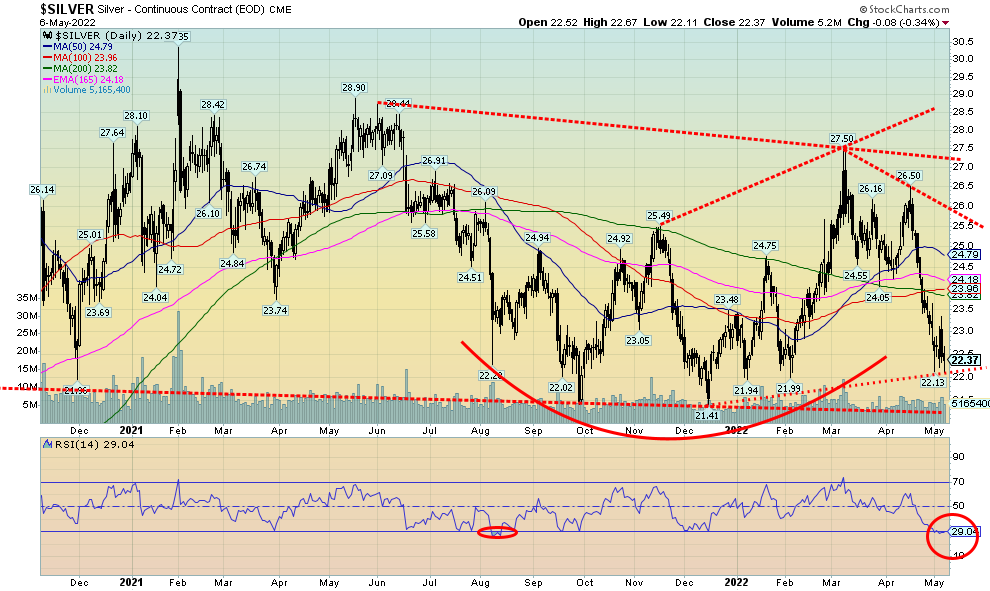
Silver, like gold, was hit this past week as fears of further rate hikes coupled with the strong U.S. dollar pushed silver to its lowest levels since February. It has been a swift decline. Silver lost 3.1% this past week and is now down 4.2% in 2022. Hopefully, silver has seen its low near $22. At $22 silver is at important support as a breakdown under that level could set up a test of the December 2021 low of $21.41. A breakdown under $21.40 could bring an end to the silver bull and signal the onset of a more serious bear. Silver, like gold, has two potential outcomes—one is bullish, the other bearish. Regaining above $23 is positive, but the reality is silver needs to regain above $25 to convince us that a low is in and we could be moving higher. There is then further resistance $26 and $27. So, silver has considerable work cut out for it to convince us we are still in a bull market and that this doesn’t turn into an ugly bear. Overall, the pattern over the past several months appears as a large bottom pattern, but that is not guaranteed and a breakdown under $21.41 and especially under $21 could set us on course for a collapse to around $14/$15. The RSI is currently under 30 and some other indicators are pointing to oversold; however, that is a reminder that just because it is oversold doesn’t guarantee a return to the upside. A short-term buy signal would be seen with a close over $23.
Source: www.cotpricecharts.com
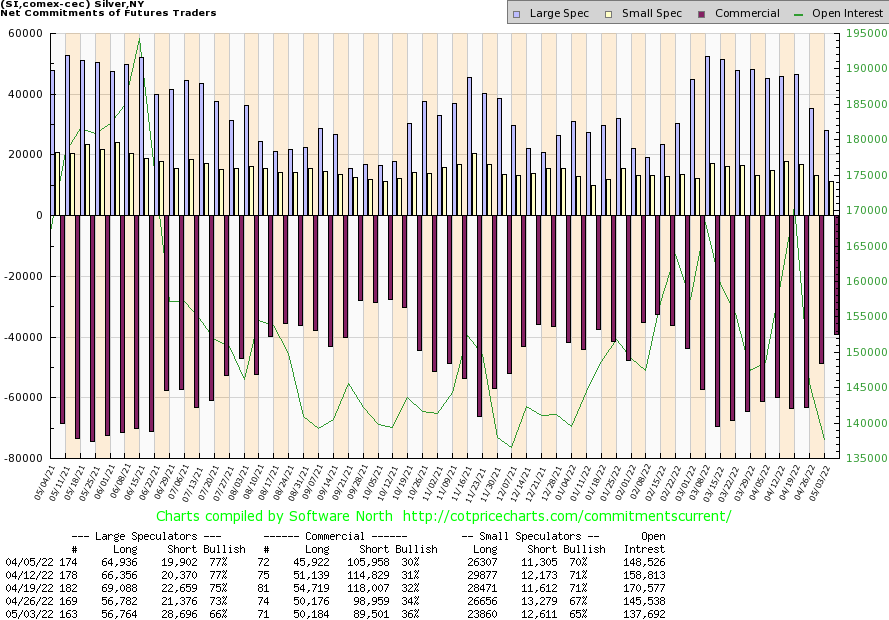
As with the gold commercial COT, the silver commercial COT also improved to 36% from 34%, the best level since December 2021 before an upswing got underway. Long open interest was relatively flat this past week, but the commercials shed around 9,000 shorts. The large speculators COT dropped dramatically to 66% from 73% as they added over 7,000 shorts. Overall open interest fell around 8,000 contracts this past week reflecting short covering as silver prices plunged. As with the gold COT, we view this as at least somewhat friendly.
Source: www.stockcharts.com
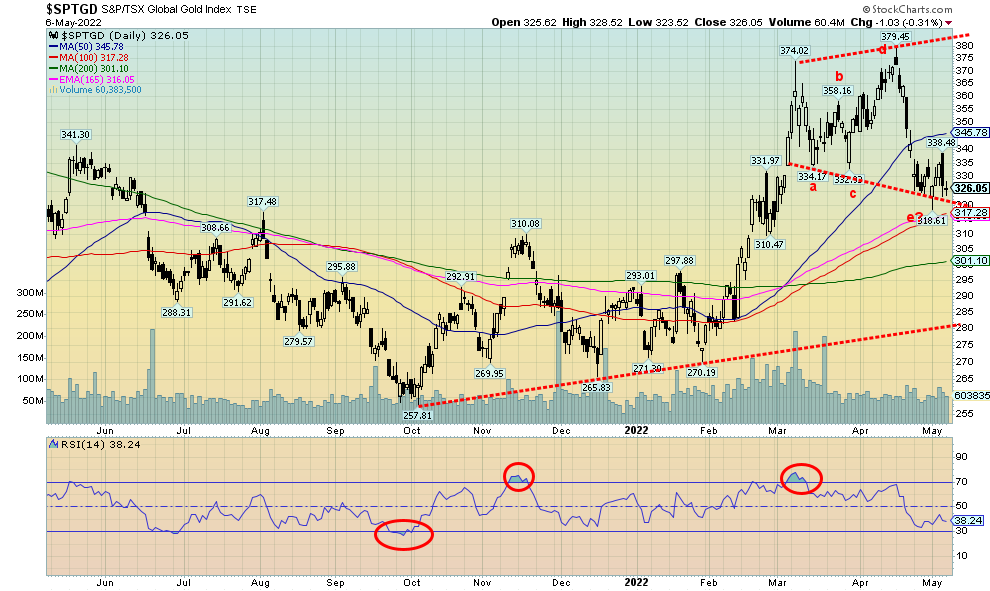
Gold stocks continue to struggle, but there is some sign of light at the end of the tunnel. The TSX Gold Index (TGD) fell again this week, down 1.2% while the Gold Bugs Index (HUI) dropped 2.9%. The TGD remains up 11.6% in 2022 while the HUI is up 5.9%. Sentiment is falling as the Gold Miners Bullish Percent Index (BPGDM) has fallen to 48.3%, down from a recent high of 83.3%. No, that’s not at bear level just yet as we’d have to fall below 25% to push the gold stocks into deeper bear territory. Nonetheless, the TGD saw new lows this past week for the current move to the downside. The TGD appeared to break support on Monday, falling to test the 100-day MA near 317. However, the day actually closed on a positive note and, while there was a nasty reversal on Thursday, there was no follow-through on Friday. All of this action leaves our corrective pattern largely intact and, if we are correct here, we should follow through to the upside this coming week. There is resistance up to 340 and 345, but above 346 the TGD should start to improve. Above 365 new highs are probable. We would, however, be concerned if we broke down under 315 as that could set up a move down to 300 and possibly lower. The current corrective pattern is either an abcde or an abc, all on sharply reduced volume typical of corrections. A buy signal would be seen above 340.
Source: www.stockcharts.com
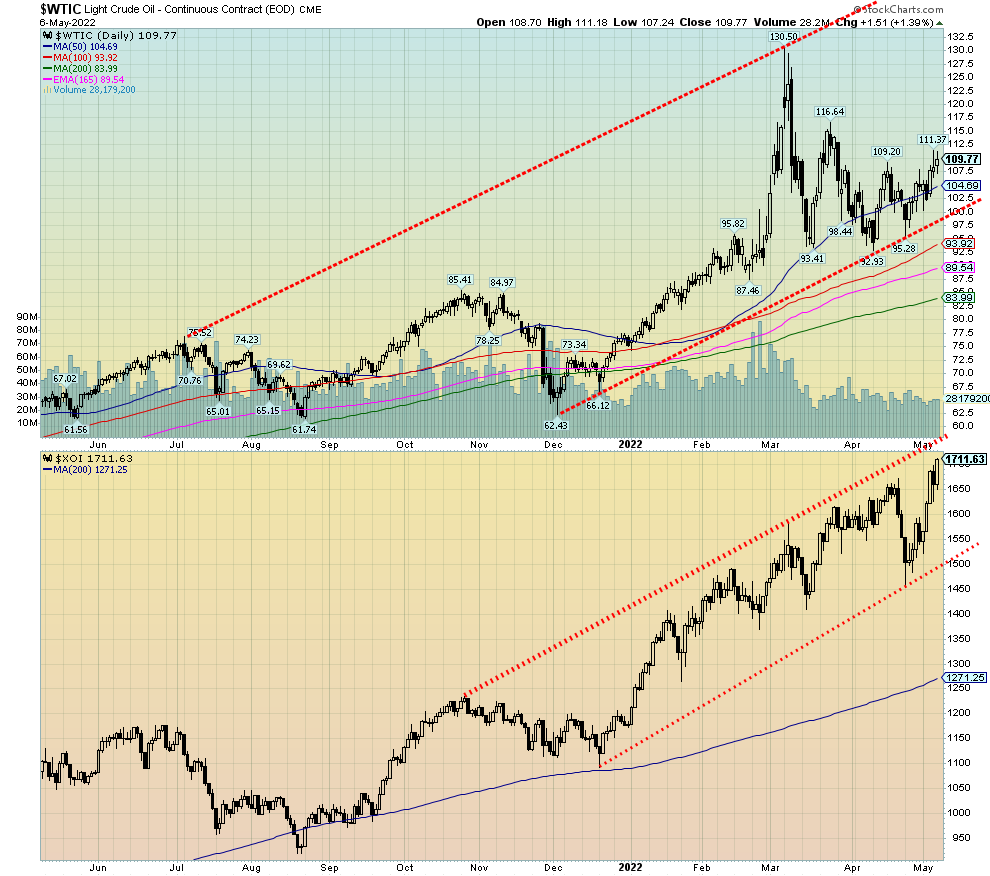
If you think that oil prices are too high now, then as the saying goes, “you ain’t seen nothing yet.” That’s a speculation, of course, but the current course does not engender a great deal of confidence. Oil prices surged again this past week as the EU prepared to ban Russian oil without quite having a back-up plan. Adding to the woes is the U.S. Senate preparing to pass a bill that opens members of the Organization of the Petroleum Exporting Countries (OPEC) and its partners to antitrust lawsuits for orchestrating supply cuts that raise global crude prices. No wonder WTI oil soared $5 or 4.9% this past week. Crunches also coming to natural gas (NG) pushed NG up even further by 11.1% to fresh 52-week highs
Nationwide, the U.S. average price for a gallon of gas is now at $4.32, diesel is $5.06, and in California the highest gas prices in the land now average over $6. In Canada it’s not much better as a litre of gas in Toronto is now around $1.96 and is expected to soar over $2 by the Victoria Day weekend. That’s the equivalent of US$5.80/US gallon. Sanctions have consequences and those consequences are record gas prices. If you want cheap gas, move to Venezuela—only US$0.12/US gallon.
All this at a time when U.S. production is largely at a standstill and reserves of oil are dwindling to their lowest levels in years, below the long-term average. Grant you, the EU has not fully agreed on a comprehensive oil embargo and some members (Hungary, Slovakia) disagree. And the NOPEC bill is largely another exercise in grandstanding as OPEC’s reaction might be to tighten supplies further. Meanwhile, OPEC members like Saudi Arabia are cutting deals with China to sell their oil in yuan instead of dollars and other countries like India continue to buy from Russia despite sanctions. Payment for oil is in rubles or rupees.
All of this continues to play havoc with supply as disruptions dominate. And that translates into higher prices and soaring energy stocks. Both the ARCA Oil & Gas Index (XOI) and the TSX Energy Index (TEN) soared to fresh 52-week highs up 10.7% and 5.1% respectively.
At a time when inflation remains high and stagflation risks setting in, two sectors stand out. One most obviously—energy, as well as commodities in the agriculture groups, metals groups, and eventually also precious metals.
There is resistance for WTI oil up to $116.50/$117.00, but above $122 new highs are highly probable. The XOI is approaching the top of the bull channel. But the bullish move could continue as long as oil and NG keep going up. WTI oil has considerable support down to $100, but below that a more substantial correction could get underway. For the XOI, considerable support is seen down to 1,500.
Copyright David Chapman, 2022
|
GLOSSARY Trends Daily – Short-term trend (For swing traders) Weekly – Intermediate-term trend (For long-term trend followers) Monthly – Long-term secular trend (For long-term trend followers) Up – The trend is up. Down – The trend is down Neutral – Indicators are mostly neutral. A trend change might be in the offing. Weak – The trend is still up or down but it is weakening. It is also a sign that the trend might change. Topping – Indicators are suggesting that while the trend remains up there are considerable signs that suggest that the market is topping. Bottoming – Indicators are suggesting that while the trend is down there are considerable signs that suggest that the market is bottoming.
|
Disclaimer
David Chapman is not a registered advisory service and is not an exempt market dealer (EMD) nor a licensed financial advisor. He does not and cannot give individualised market advice. David Chapman has worked in the financial industry for over 40 years including large financial corporations, banks, and investment dealers. The information in this newsletter is intended only for informational and educational purposes. It should not be construed as an offer, a solicitation of an offer or sale of any security. Every effort is made to provide accurate and complete information. However, we cannot guarantee that there will be no errors. We make no claims, promises or guarantees about the accuracy, completeness, or adequacy of the contents of this commentary and expressly disclaim liability for errors and omissions in the contents of this commentary. David Chapman will always use his best efforts to ensure the accuracy and timeliness of all information. The reader assumes all risk when trading in securities and David Chapman advises consulting a licensed professional financial advisor or portfolio manager such as Enriched Investing Incorporated before proceeding with any trade or idea presented in this newsletter. David Chapman may own shares in companies mentioned in this newsletter. Before making an investment, prospective investors should review each security’s offering documents which summarize the objectives, fees, expenses and associated risks. David Chapman shares his ideas and opinions for informational and educational purposes only and expects the reader to perform due diligence before considering a position in any security. That includes consulting with your own licensed professional financial advisor such as Enriched Investing Incorporated. Performance is not guaranteed, values change frequently, and past performance may not be repeated.
About the author


Website: https://www.enrichedinvesting.com
Disclaimer: David Chapman is not a registered advisory service and is not an exempt market dealer (EMD) nor a licensed financial advisor. We do not and cannot give individualised market advice. David Chapman has worked in the financial industry for over 40 years including large financial corporations, banks, and investment dealers. The information in this newsletter is intended only for informational and educational purposes. It should not be considered a solicitation of an offer or sale of any security. The reader assumes all risk when trading in securities and David Chapman advises consulting a licensed professional financial advisor before proceeding with any trade or idea presented in this newsletter. David Chapman may own shares in companies mentioned in this newsletter. We share our ideas and opinions for informational and educational purposes only and expect the reader to perform due diligence before considering a position in any security. That includes consulting with your own licensed professional financial advisor.