
“We are the first generation to be able to end poverty, and the last generation that can take the steps to avoid the worst impacts of climate change. Future generations will judge us harshly if we fail to uphold our moral and historical responsibilities.”
—Ban Ki-Moon, South Korean politician and diplomat, 8th Secretary-General of the United Nations 2007–2016; b: 1944
“Climate change increasingly poses one of the biggest long-term threats to investments.”
—Christiana Figueres, Costa Rican diplomat, Executive Secretary United Nations Framework Convention on Climate Change UNFCCC 2010–2016; b. 1956
“The climate is changing. The proper political debate would be how to deal with these risks.”
—Steven Chu, American physicist and government official, Nobel Laureate, Professor of Physics and Professor of Molecular and Cellular Physiology Standford University, 12th U.S. Secretary of Energy 2009–2013; b. 1948
Three weeks in another place. We are back from our COVID vacation in Northern Ontario. Three weeks car camping—in a tent. We were outdoors and more than socially distanced from other campers.
Northern Ontario is incredibly beautiful. A land of rocks, trees, forests, rivers, lakes, streams, wetlands, and teeming with wildlife if you are lucky enough to see it. The Boreal Forest covers some 60% of Canada. Ontario. If it were a country, it would be almost as large as Bolivia and would be the 29th largest country in the world. The main industries in Northern Ontario are mining, forestry, hydroelectricity, and tourism.
Northern Ontario makes up 88% of the province but contains less than 6% of the population. The largest city, Sudbury, has 165,000 inhabitants. The largest lake is Lake Superior (although shared with the U.S.). The drive north of Superior is breathtaking, highlighted by Sleeping Giant Provincial Park with, yes, the Sleeping Giant, a series of mesas on the Sibley Peninsula that resembles a giant lying on its back. The Sleeping Giant is based on an Ojibway legend and was voted number one for a list of the Seven Wonders of Canada. The hike to the summit can be daunting and difficult. Distances between towns can be daunting and one can drive for kilometers on roads, barely seeing any traffic let alone even passing through a town, some with fewer than 200 inhabitants and services can be sketchy. But the COVID pandemic gave us a great opportunity to see a part of Ontario and Canada that is visited by few, even if by most measures our trip was roughing it.
And now back to the markets. Go away for three weeks and not much has changed. Internet was spotty to non-existent at times on our journey except for built-up population centres, so writing a report was difficult at best. The S&P 500 did gain 1.5% to new all-time highs in our absence. But gold took a beating on fears of tapering and stronger employment numbers, falling at one point some 7% from where we left off or over $125. The subsequent rebound, however, reminded us of March 2020 and the drop had all the earmarks of a failed takedown. Nonetheless, gold has a lot of work to do to confirm a low.
The Sleeping Giant

Courtesy of David Chapman
The trip gave us time to contemplate what was going on in the world without actually being in the hurly burly of daily life in the big city. There were a number of things that stood out. Despite all the progress being made to combat COVID and get people vaccinated, the so-called Delta variant was now wreaking havoc. Globally, numbers in the current wave are now approaching the levels seen in the first wave back in 2020, even as deaths are lagging. The U.S. is once again leading the world in daily cases, primarily because the mass of unvaccinated people are now catching the surging Delta variant. Despite the unvaccinated accounting for roughly 99% of all new cases, demonstrations by the antivaxxers and clashes with authorities are rising, leading to riots.
There is growing frustration with the disruptions that are being caused by the COVID pandemic. Politicians, like society, are sharply divided over whether there should be mandatory vaccinations or vaccine passports particularly for air, bus, and train travel or for working in sensitive health-related occupations such as hospitals and nursing homes. Many businesses are taking matters into their own hands which is causing disruption of another kind. Many of these same businesses have been attacked by the antivaxxers. Nonetheless, all of this is disruptive to the economy and recent economic gains may soon dissipate or disappear. The most recent Michigan Sentiment Index plunged to 70.2, its lowest level seen since December 2011, due to fears that the pandemic is far from over. It was followed up this past week with a plunge in retail sales, down 1.1%, well below the forecast of a 0.3% decline. Economists are already lowering their forecasts for Q3 and Q4. None of this bodes well for the economy and job growth going forward, even if we are seeing restaurants fill up again.
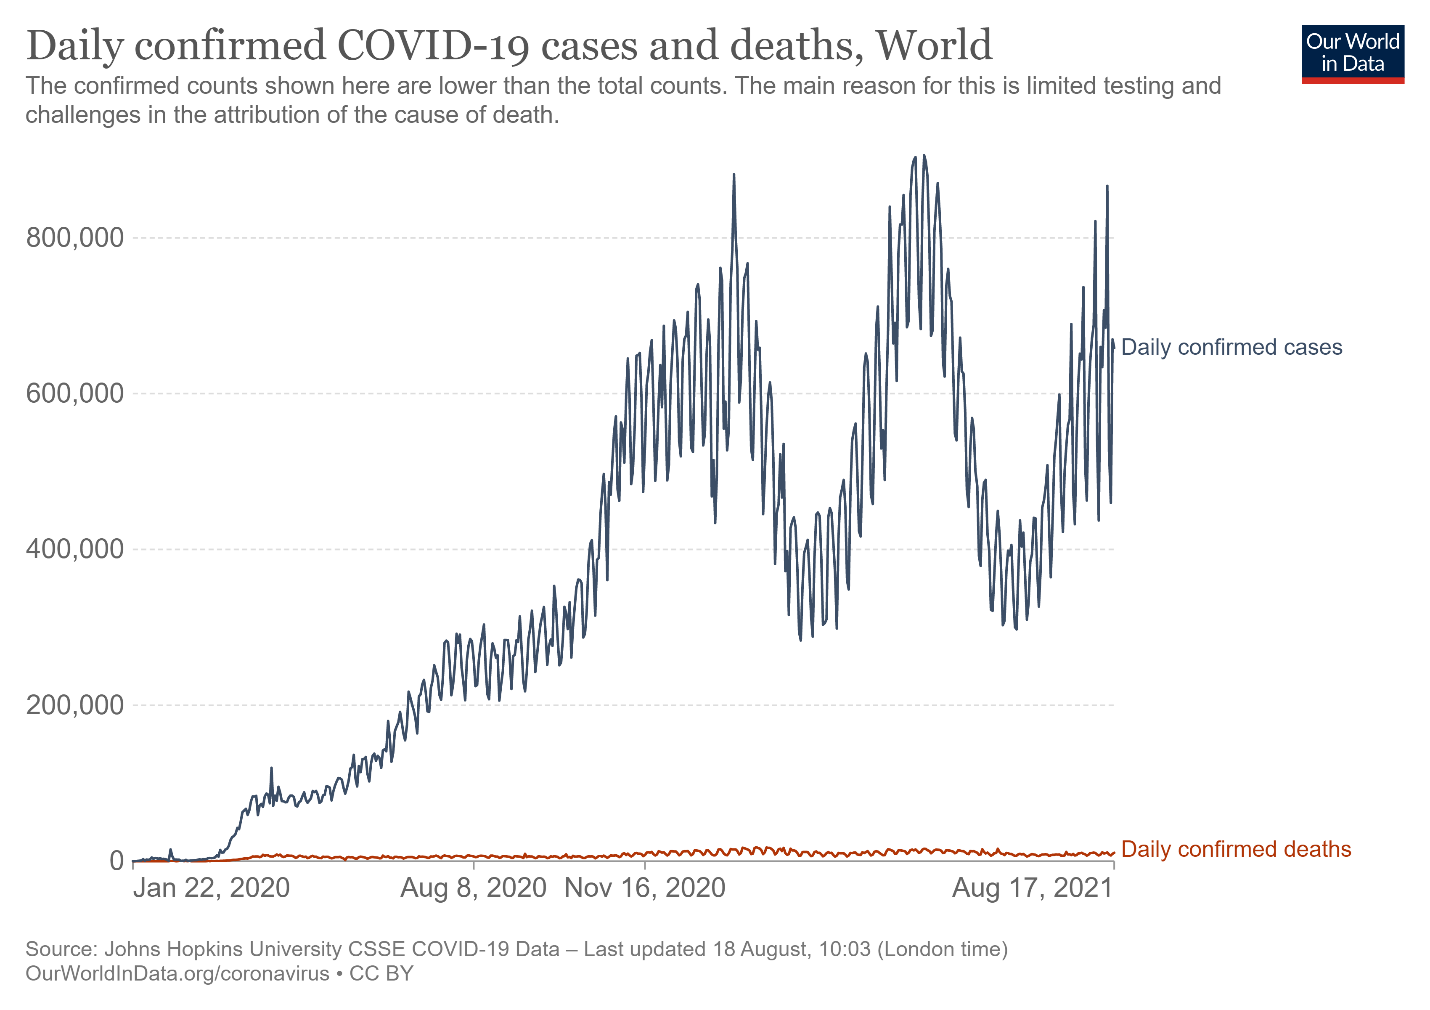
Source: www.ourworldindata.com
But fear of the growing Delta variant is not the only concern. There is a potentially bigger one. The latest report from the Intergovernmental Panel on Climate Change I.P.C.C. released a report showing that global temperatures are the highest in 125,000 years. The past decade has been the hottest on record and the past month also the hottest on record. Temperatures are 1⁰C or 1.8⁰F higher than they were in the pre-industrial era. This puts an exclamation mark on fiercer heat waves, heavier storms, and more violent hurricanes (cyclones) and suggests the coming decades could be hotter and witness worse flooding, wildfires, drought, freak snow storms, strange cold snaps, and more. This past year has seen scenes of destruction as if out of an apocalypse, with towns in Germany torn apart by floods and towns in the Western U.S. (primarily California) and Canada (primarily B.C.) eviscerated in wildfires. Europe too is feeling the heat with record wildfires in the south, including some that devastated entire Greek islands, forcing the inhabitants to flee.
Yet many deny there is even a problem. After all, floods, wildfires, hurricanes, etc. happen all the time. There are proven cycles of warming and cooling. What’s different this time is man’s contribution to what may have been a natural cycle. Glaciers are disappearing and huge chunks of ice are collapsing in both the Arctic and Antarctica, causing the oceans to rise. Already many global cities are feeling the rise of the seas.
Many of them could eventually become uninhabitable or at least partially uninhabitable. These cities include some of the largest in the world across all continents. In Asia, Bangkok, Manilla, Jakarta, and even Tokyo, Hong Kong, Taipei, Kolkata, and Ho Chi Minh City are listed as putting both their populations and ultimately their GDP at risk. Bangkok may be the worst. Many expect Jakarta to become uninhabitable. It’s a city of 33 million including the metro region. In Africa, Lagos, Accra, and Alexandria are amongst many at risk. Venice and Amsterdam are two of the most vulnerable cities in Europe. North America is not exempt as the U.S. cities of Miami, Houston, New Orleans, Charleston, and Virginia Beach are amongst many that could be severely impacted with some particularly Miami, New Orleans, and Houston that could literally disappear beneath the waves. Add this in with wildfires in the west (California) and droughts in the American Southwest where reservoirs are already drying up and you could witness lowered real estate values and declining populations as many are forced to flee. Already parts of the Mid-East are becoming uninhabitable due to drought and collapsing water tables.
Already there are an estimated 55 million or more climate refugees globally. One estimate we saw for the U.S. was 1.2 million displaced. And that is just the beginning as these numbers are sure to rise. One forecast was that the Gulf Stream could change direction (this has happened before) which could put upwards of 50 million at risk in Northern Europe. It is not a case that this can be stopped, but how man can adapt to it and manage the risks and the ultimate economic costs. Irrespective of this, one could see increased droughts and accompanying famines, livelihoods destroyed because of severe heat (you can’t work outside), displacement due to flooding, wildfires and hurricanes and resulting in displaced populations. As well, there would be a rise in deaths globally due to climate change and increased wars as countries fight over dwindling resources. Insurance companies will refuse to insure in the areas most vulnerable, potentially setting up the population with huge financial losses if they are impacted. Populations could actually decline. The risk of deadlier diseases is also real as the earth releases toxins that have been trapped for centuries beneath the melting ice.
Never has any of this happened before with a global population approaching 8 billion. While the impact on the world’s developed nations will be huge, it will be even more devastating in the developing world. Economically China and the U.S. will be most impacted and declines in GDP could be sharp, triggering economic depressions. And then there is the cost, estimated at over $8 trillion a number that is most likely woefully low. In a world already buried in debt, the costs are enormous.
Climate change is the elephant in the room that no one wants to acknowledge. The house is burning but no one is calling the fire department.
The COVID pandemic and climate change are the two ongoing issues that stood out for us. But we also have to note rising political instability, rising inequality, rising disinformation (media) and political polarization, rising racism, and the potential for another financial crisis. This month is the 50th anniversary of end of the gold standard on August 15, 1971. That’s when Nixon closed the gold window following requests from Britain and France for $3 billion of gold. Effectively the U.S. defaulted, wiping out a huge chunk of the U.S.’s gold reserves. Since then, debt has soared and financial crises have occurred more frequently: 1974, 1980–1982, 1990, 1997, 1998, 2000–2002, 2007–2009. How this could end is a matter of speculation.
Economically, things are not quite as rosy as many would like them to be. That suggests to us that inflation, while it has gone up, shouldn’t become a major problem except for growing food shortages that is already putting millions at risk of famine. Even the Fed views the economy as still being uncertain, which could translate into less talk about tapering. The Fed also believes that inflation has most likely topped out. Still, it remains a surprise that the Fed’s reverse repo operations continue because of the necessity to soak up all the extra cash on private banks balance sheets. Problems remain with supply disruption, something that was present for many years up until the pandemic of 2020. There are also attempts to rein in technology from China and that is another potential area of disruption. We have also entered an era where it is “every nation for itself,” as noted by Washington policy expert Bruce Mehlman. What that translates into is that the era of cooperation and friendly engagement between the U.S. and China is over. Finally, all of this is going to bring major changes not as yet defined, just as previous periods of pandemics and wars did. So, is this the best of times or the worst of times?
No Safe Place
The 3⁰C future

Source: www.economist.com – cover of The Economist July 24–July 30, 2021
Chart of the Week
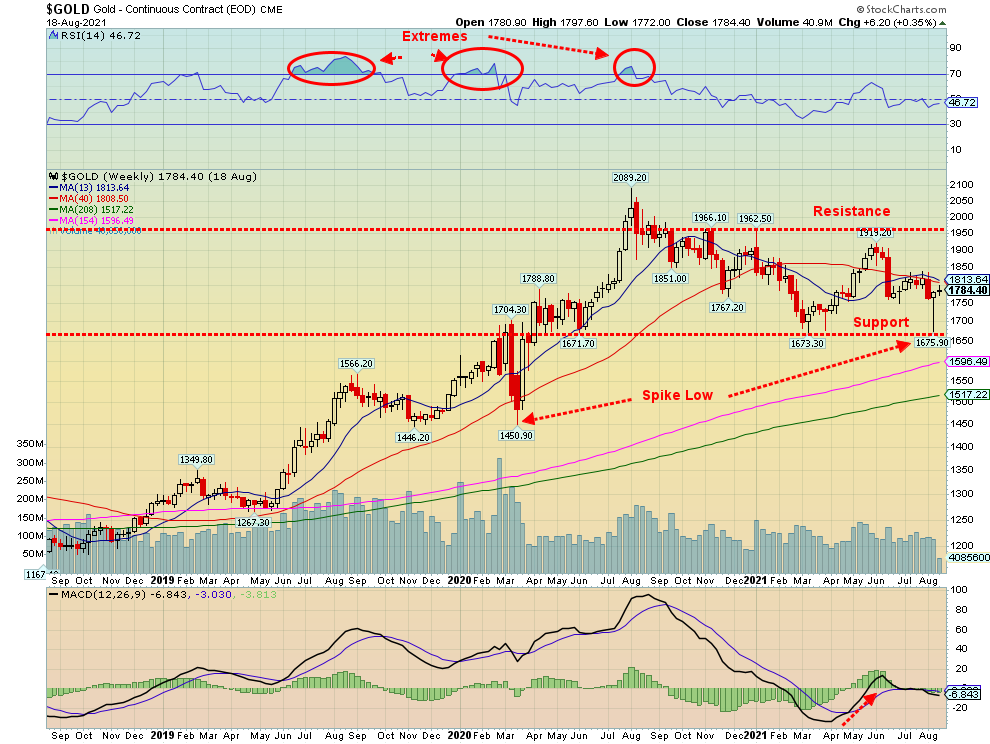
Source: www.stockcharts.com
Gold (and silver) left a rather interesting spike to lows on August 9 with silver taking out its March 2021 low while gold did not—a divergence. Even the gold stock indices have diverged. The Gold Bugs Index (HUI) did eventually take out its March low but the TSX Gold Index (TGD) did not. Numerous indicators—daily and weekly but not the monthly—also diverged with the price action. Finally, we couldn’t help but notice a sudden improvement in the commercial Commitment of Traders (COT) report, suggesting the commercials were covering short while the large speculators COT showed them adding to their short positions and cutting long positions. (See COTs in our gold/silver comments later.) Another positive potential set-up for a low.
The weekly gold MACD crossed over to the upside in late April and while it is wavering now it is not convincingly breaking lower. It is also making a higher low than that seen in March 2021. The wild card is the U.S. dollar.
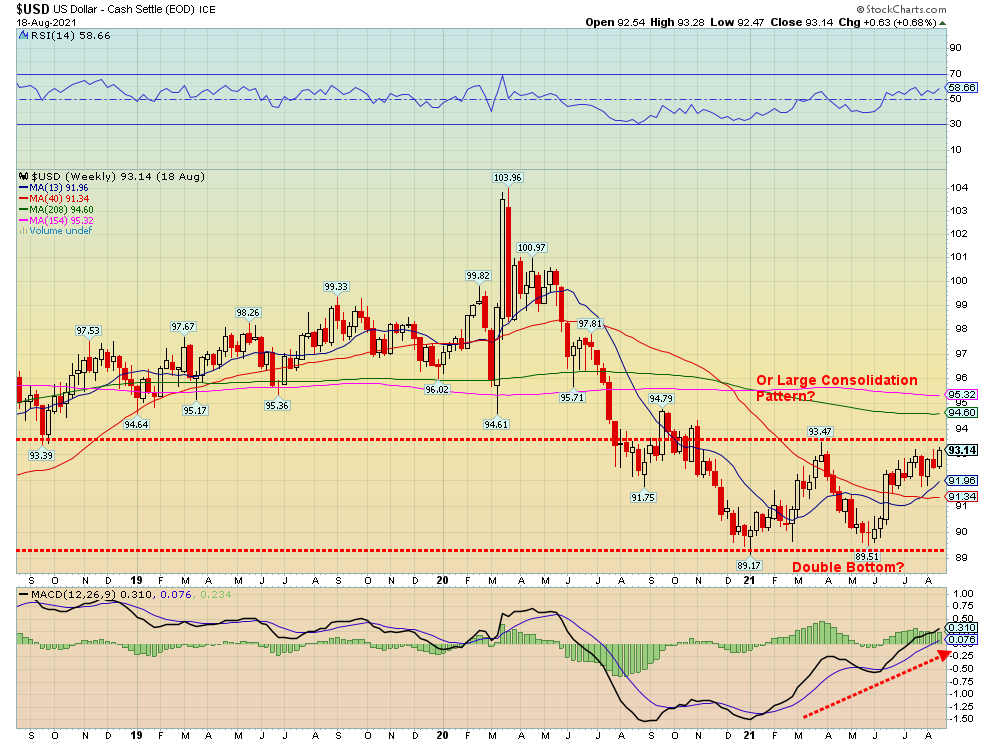
Source: www.stockcharts.com
With the US$ Index the story is ambiguous. Is that a double bottom? Or is it just a large consolidation pattern before the US$ Index moves lower once again? There remains considerable resistance up to around 95.25/95.50, assuming it gets that far. To the downside a breakdown under 91.25 could set up a break below the January and May lows between 89.17–89.51. In the interim we are caught in between and await resolution. We have now taken out that 93.47 high seen in late March but not by much so far. But then we haven’t broken down under 92 yet, either.
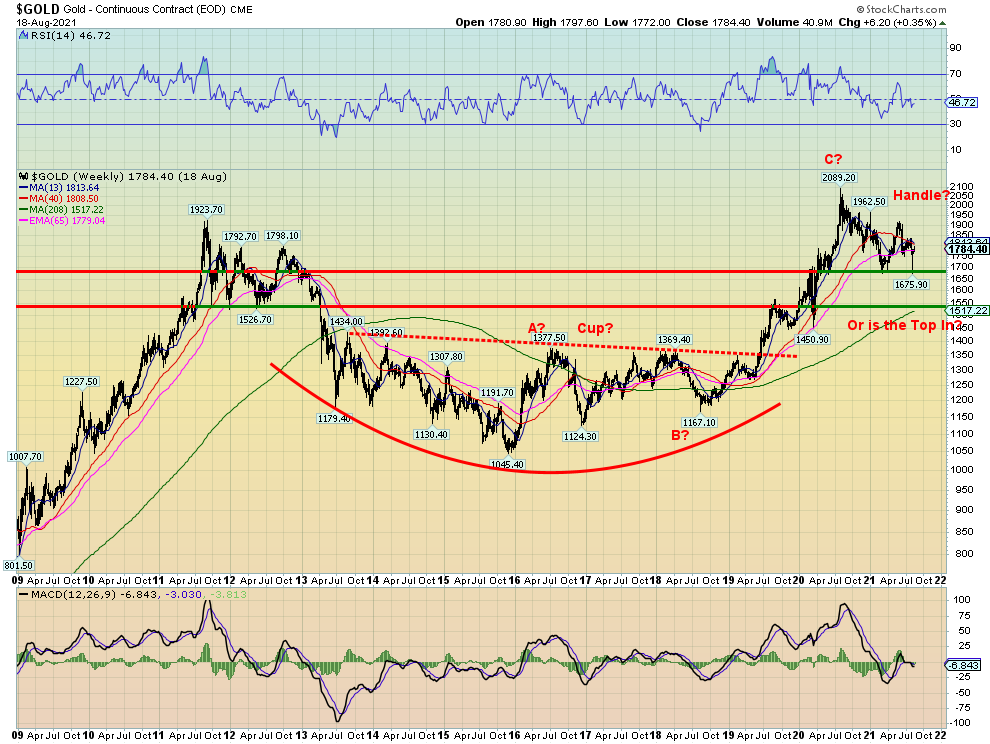
Our final chart below shows gold going back to 2009. Gold went through a multi-year correction following the huge 2000s run-up that took gold from $252 to $1,923. The absolute low was seen in December 2015, coinciding with a probable 7.83-year cycle low dating from the low of October 2008. By that measurement the next 7.83-year cycle low is most likely due sometime in 2022–2024, according to cycles analyst Ray Merriman (www.mmacycles.com). That would also coincide with the 23.5-year, 25-year cycle due more broadly in 2020–2027. We are already in that time frame. The question is, was the $2,089 top in August 2020 the top for the cycle or was it another temporary top? We have the appearance of a potential cup and handle pattern with the consolidation forming since August 2020, giving the appearance of a potential handle. But is it?
Source: www.stockcharts.com
We were also looking for a potential 31.3-month cycle low which was due April 2021 +/- 5 months or anywhere from November 2020 to September 2021. The low in March 2021 would appear to satisfy that. However, we have not seen the rise from the 31.3-month cycle low. The question is, will it be a weak rise that fails to take out the $2,089 high of August 2020 or will it be a final rush to potential highs that could see gold run to $2,300/$2,400? Three resistance areas need to be cleared to suggest that we are going higher. First, the $1,820/$1,830 resistance which coincides with a recent high; second, around $1,900 which coincides with a high in June 2021; and, finally, the $1,962 high seen in January 2021. Once that high is taken out, then the August 2020 looks more likely to fall but is clearly not guaranteed as we painfully learned in late 2012 when gold gave us a false breakout. What’s key now is that $1,675 low just seen. We don’t want to see that level taken out.
Many believe gold is ready for a moonshot. But that is not guaranteed, given all the mixed signals we are currently seeing. While the set-up for a rally appears to be in the cards, the key will be the strength of this rally. Failure to make new highs above $2,089 would have to be viewed as a negative and then we should be prepared to eventually see that 7.83-year and 23.5-year cycle low. It most likely could occur concurrently with a stock market collapse.
MARKETS AND TRENDS
|
|
|
|
% Gains (Losses) Trends
|
|||||
|
|
Close Dec 31/20 |
Close Aug 20/21 |
Week |
YTD |
Daily (Short Term) |
Weekly (Intermediate) |
Monthly (Long Term) |
|
|
Stock Market Indices |
|
|
|
|
|
|
|
|
|
S&P 500 |
3,756.07 |
4,441.67 (new highs) |
(0.6)% |
18.3% |
up |
up |
up |
|
|
Dow Jones Industrials |
30,606.48 |
35,120.08 (new highs) |
(1.1)% |
13.3% |
up |
up |
up |
|
|
Dow Jones Transports |
12,506.93 |
14,554.71 |
(2.5)% |
16.4% |
down (weak) |
up (weak) |
up |
|
|
NASDAQ |
12,888.28 |
14,714.66 |
(0.7)% |
14.2% |
up |
up |
up |
|
|
S&P/TSX Composite |
17,433.36 |
20,339.02 |
(0.9)% |
16.7% |
up |
up |
up |
|
|
S&P/TSX Venture (CDNX) |
875.36 |
864.51 |
(6.3)% |
(1.2)% |
down |
down |
up |
|
|
S&P 600 |
1,118.93 |
1,320.96 |
(2.1)% |
18.1% |
down |
up (weak) |
up |
|
|
MSCI World Index |
2,140.71 |
2,318.00 |
(2.4)% |
8.3% |
down |
up |
up |
|
|
NYSE Bitcoin Index |
28,775.36 |
48,398.38 |
4.1% |
68.2% |
up |
up (weak) |
up |
|
|
|
|
|
|
|
|
|
|
|
|
Gold Mining Stock Indices |
|
|
|
|
|
|
|
|
|
Gold Bugs Index (HUI) |
299.64 |
240.02 (new lows) |
(5.9)% |
(19.9)% |
down |
down |
up (weak) |
|
|
TSX Gold Index (TGD) |
315.29 |
280.86 |
(3.1)% |
(10.9)% |
down |
down |
up (weak) |
|
|
|
|
|
|
|
|
|
|
|
|
Fixed Income Yields/Spreads |
|
|
|
|
|
|
|
|
|
U.S. 10-Year Treasury Bond yield |
0.91 |
1.26% |
(1.6)% |
38.5% |
|
|
|
|
|
Cdn. 10-Year Bond CGB yield |
0.68 |
1.15% |
(2.5)% |
69.1 |
|
|
|
|
|
Recession Watch Spreads |
|
|
|
|
|
|
|
|
|
U.S. 2-year 10-year Treasury spread |
0.79 |
1.03% |
(4.6)% |
30.4% |
|
|
|
|
|
Cdn 2-year 10-year CGB spread |
0.48 |
0.71% |
(2.7)% |
47.9% |
|
|
|
|
|
|
|
|
|
|
|
|
|
|
|
Currencies |
|
|
|
|
|
|
|
|
|
US$ Index |
89.89 |
93.51 |
1.1% |
4.0% |
up |
up |
down |
|
|
Canadian $ |
0.7830 |
0.7784 |
(2.6)% |
(0.6)% |
down |
down |
up |
|
|
Euro |
122.39 |
117.03 |
(0.8)% |
(4.4)% |
down |
down |
up |
|
|
Swiss Franc |
113.14 |
109.07 |
(0.1)% |
(3.6)% |
down |
down (weak) |
up |
|
|
British Pound |
136.72 |
136.26 |
(1.8)% |
(0.3)% |
down |
down (weak) |
up |
|
|
Japanese Yen |
96.87 |
91.08 |
(0.2)% |
(6.0)% |
down |
down |
down |
|
|
|
|
|
|
|
|
|
|
|
|
Precious Metals |
|
|
|
|
|
|
|
|
|
Gold |
1,895.10 |
1,784.00 |
0.3% |
(5.9)% |
down |
down (weak) |
up |
|
|
Silver |
26.41 |
23.11 |
(2.8)% |
(12.5)% |
down |
down |
up |
|
|
Platinum |
1,079.20 |
994.20 |
(3.1)% |
(7.9)% |
down |
down |
up |
|
|
|
|
|
|
|
|
|
|
|
|
Base Metals |
|
|
|
|
|
|
|
|
|
Palladium |
2,453.80 |
2,276.50 |
(14.3)% |
(7.2)% |
down |
down |
up |
|
|
Copper |
3.52 |
4.14 |
(5.7)% |
17.6% |
down |
neutral |
up |
|
|
|
|
|
|
|
|
|
|
|
|
Energy |
|
|
|
|
|
|
|
|
|
WTI Oil |
48.52 |
62.14 |
(9.2)% |
28.1% |
down |
up (weak) |
up |
|
|
Natural Gas |
2.54 |
3.87 |
(0.3)% |
52.4% |
neutral |
up |
up |
|
Source: www.stockcharts.com, David Chapman
Note: For an explanation of the trends, see the glossary at the end of this article.
New highs/lows refer to new 52-week highs/lows and in some cases all-time highs.
Source: www.stockcharts.com
The S&P 500 continues to make new all-time highs despite a weakening background. This past week the S&P 500 made the new all-time highs but closed the week down, off 0.6%. The Dow Jones Industrials (DJI) joined them but it too fell 1.1% on the week. These are reversals. Do they mean anything? We’ll have to wait and see. Previous reversal days have amounted to naught. Universally, all who made new all-time highs this past week closed lower on the week. Others making new all-time were the S&P 100 (OEX), Russell 1000, and the Russell 3000. The big Dow Theory divergence continues with the Dow Jones Transportations (DJT) down 2.5% this past week. The DJT is now down 10% from its all-time high seen in May 2021. The DJI is down 1.4% from its high seen last Monday, August 16. This has been an ongoing divergence and every time we have seen this classic Dow Theory divergence it has signaled a change in direction. Notably, as well, the S&P 500 Equal Weight Index did not make a new all-time high this past week. That happened in the previous week.
The NASDAQ lost 0.7%, the TSX Composite reversed as well falling 0.9%, while the TSX Venture Exchange (CDNX) dropped 6.3% and appears poised to go lower. The S&P 600 small cap index lost 2.1%. Overseas, the MSCI World Index fell 2.4%. In the EU, the London FTSE lost 0.7%, the Paris CAC 40 was off 3.9%, and the German DAX dropped 1.1%. In Asia, China’s Shanghai Index (SSEC) dropped 2.5% and the Tokyo Nikkei Dow (TKN) was down 3.5%. Asia was particularly daunting as the SSEC and Hong Kong’s Hang Seng Index dropped over $500 billion in value. The Hang Seng Index is down over 20% from its all-time high in February, the first major index to move into an official bear market. The TKN is poised to fall further.
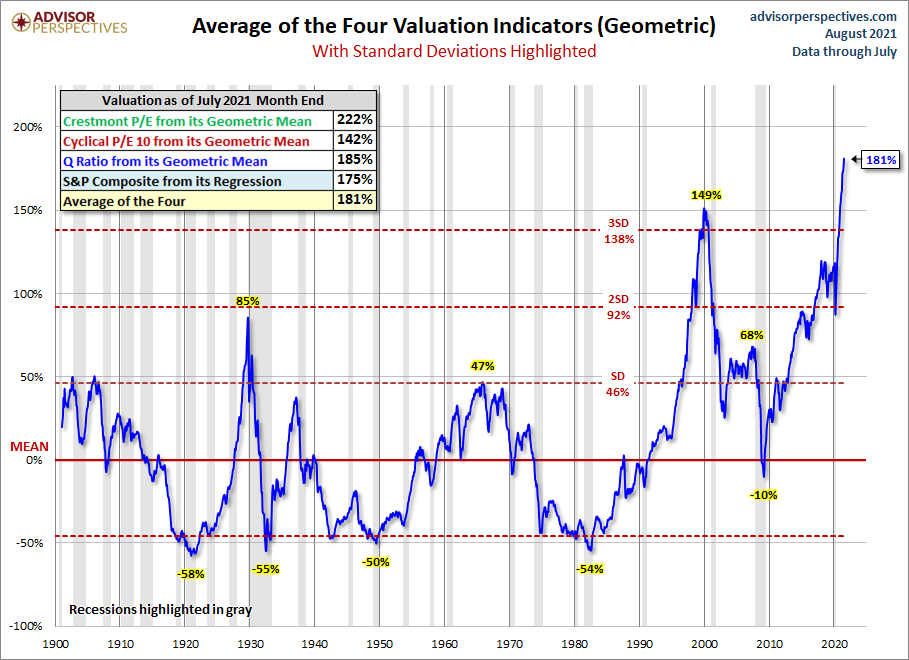
All of this continues to point to a potential decline for the markets going into the September/October period. Valuations continue to be at or near extremes. We picked up this chart of four key valuation indicators from Advisor Perspectives. The combined valuation is at 181%. It combines the Crestmont P/E Geometric Mean, the Cyclical P/E 10, the Q Ratio, and the S&P 500 composite from its regression and averages the four. As Advisor Perspectives notes, the markets appear to be partying like it is 1999. However, keep in mind that massive monetary stimulus with M1, M2, and the Fed’s balance sheet up in the stratosphere has helped push the markets higher. All that money has to go somewhere and it has gone into the stock market. Too much money chasing too few goods: the classic definition of inflation.
Source: www.advisorperspectives.com
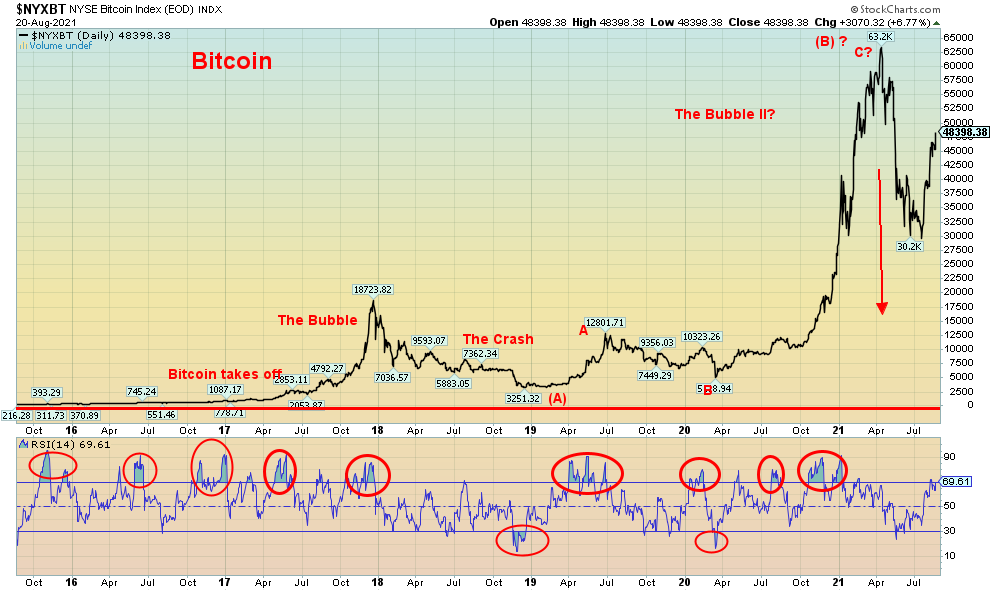
If there has been a star, it has been Bitcoin and the cryptos. Just as Bitcoin appeared poised to collapse, it did the opposite by recovering and is now up almost 58% from its recent low seen in mid-July to close at $48,398 this past week. It has been a dramatic turnaround. Even Dogecoin has soared back. However, Bitcoin has now become overbought, although not as overbought as we have seen in the past. Does that mean it is poised to drop? Well, maybe not until it breaks back under $40,000. Still, the surge in Bitcoin has the crypto bulls screaming Bitcoin $100,000 here we come once again. A head fake? We’ll find out.
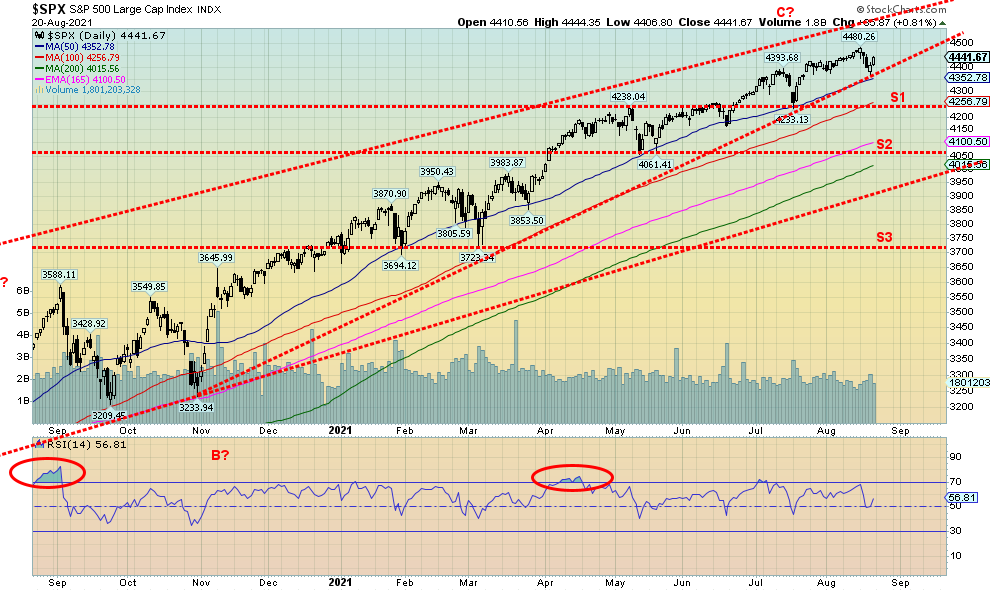
Buy the dip mentality is still dominating the markets. But could the Delta variant and more negative economic news change the tune? And breadth is waning as fewer and fewer stocks are participating in the rally. So, it is now caveat emptor. The S&P 500 breaks under 4,350 and the next stop would be down around 4,250. Major support is seen down around 3,900 and the 200-day MA is at 4,015. A drop to 3,900 would be a 13% drop from the high. So, no, we are not expecting a bear market (20% plus) at this time but the seasonal weakness and surprises to the downside (see Jackson Hole symposium this coming week for the FOMC) could change the mood and spark a correction. There is support at 4,250 then again just below 4,100. New highs above 4,480 will keep the bulls chortling.
Source: www.stockcharts.com
Source: www.stockcharts.com
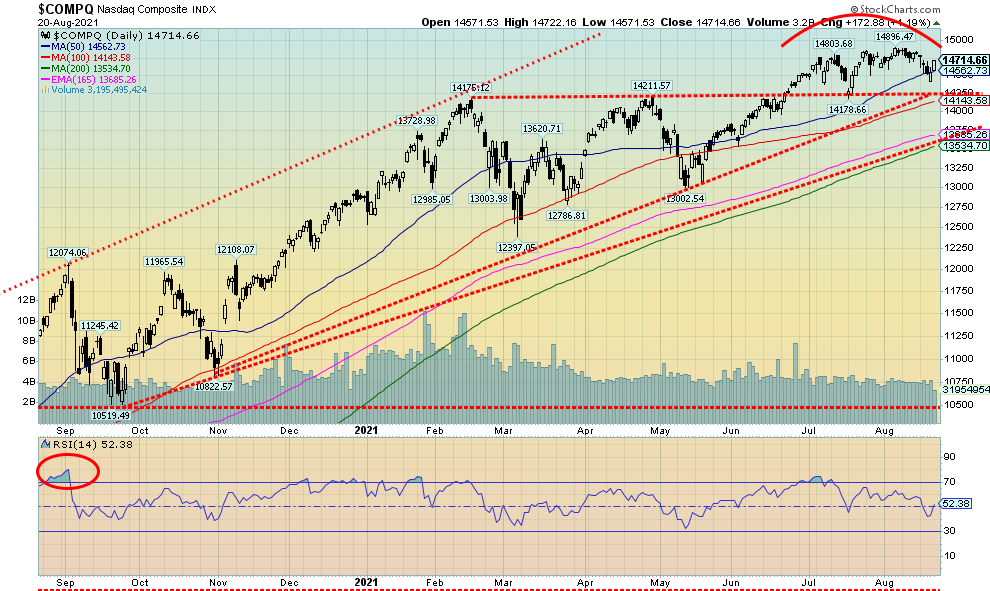
The Dow Jones Industrials (DJI) and the S&P 500 moved to new all-time highs again this week, but this time the NASDAQ did not join them. A divergence? The NASDAQ fell 0.7% this past week. As we note next, the rise in the NASDAQ has become narrower and narrower as it is being held up by a few heavyweights. The biggies are the FAANGS—we saw Facebook lose 1.1% this past week, Apple fall 0.6% after making new all-time highs, Amazon get dumped off 2.9%, Netflix soar up 6%, while Google was flat on the week. Microsoft was a star, up 3.9% to new all-time highs. Tesla was being dumped, down 5.2%, Twitter fell 3.6%, and the Chinese darlings fell with Baidu down 9.7% and Alibaba dumped, down 16.3%. But Nvidia gained 3.1%. The NASDAQ continues to appear to be making a top (note the rounding) but the break doesn’t come until we are under 14,250. If that happens, then the NASDAQ could project down to 13,500 for a total decline of about 10%. The 13,500 area also coincides with the 200-day MA currently at 13,535. New highs above 14,900 could change this scenario.
Source: www.stockcharts.com
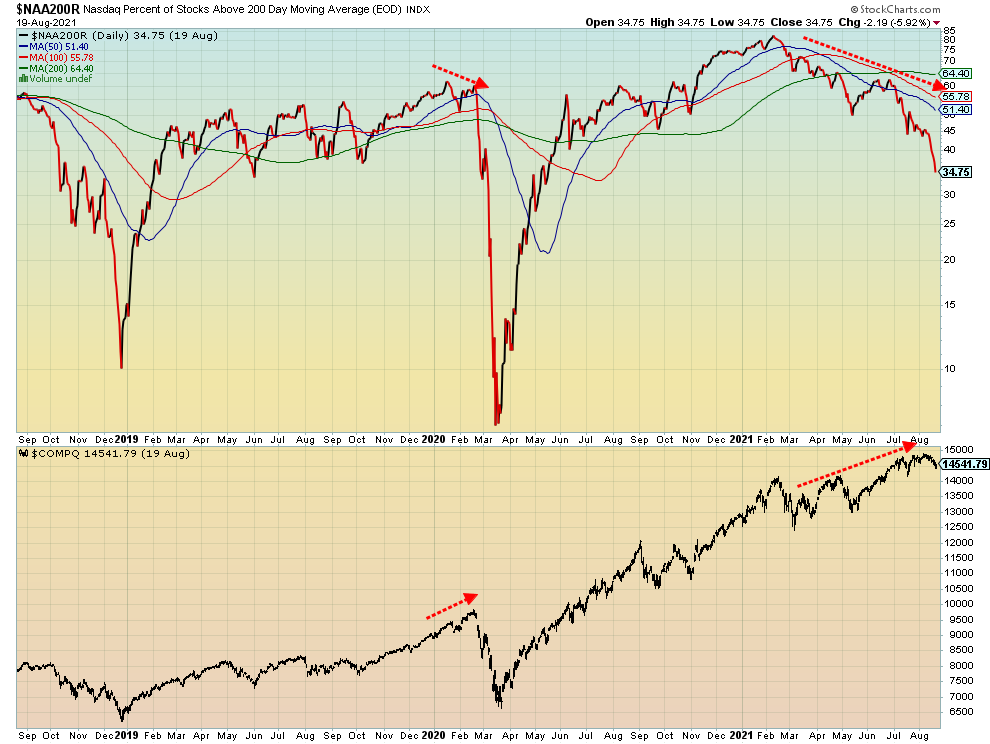
Here’s another divergence. The percentage of stocks on the NASDAQ trading above their 200-day MA has been in a steady decline since topping way back in February 2021 at almost 82%. Now it is at 37% yet the NASDAQ kept rising making new all-time highs as recently as early August. What this tells us is that the rise in the NASDAQ has become narrower and narrower as most stocks are being sold even as a few biggies (FAANGS?) are taking the NASDAQ higher. Another divergence to note.
Source: www.stockcharts.com
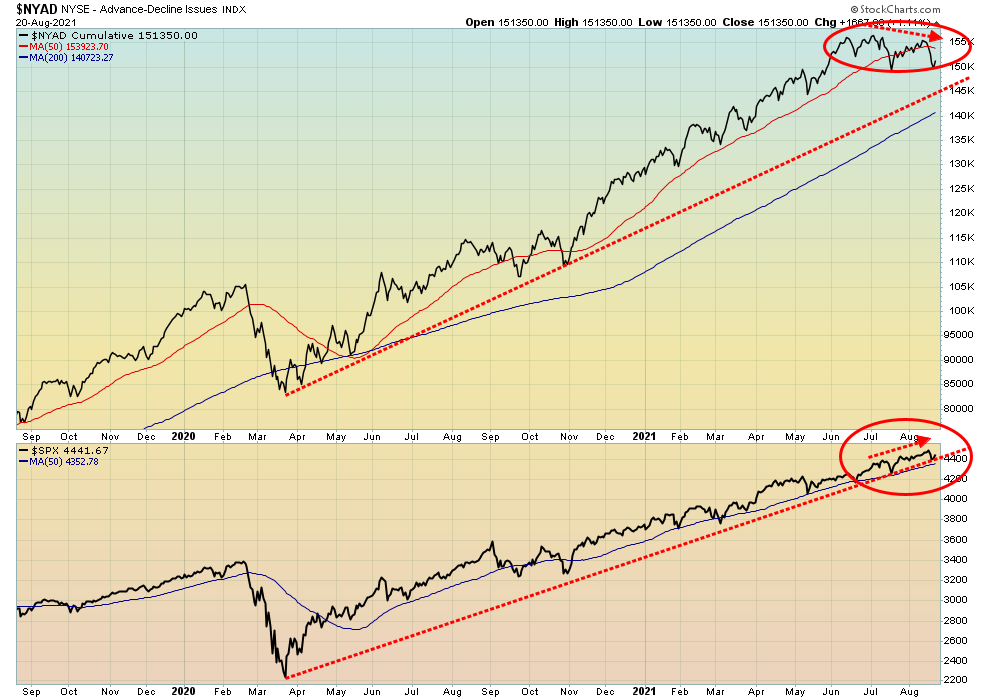
Divergences abound in the NYSE advance-decline line. The NYSE advance-decline has been sliding steadily since highs in June/July but the S&P 500 continued to rise making new all-time highs in August—a divergence. Granted, it is again merely a sign but we have often seen this translated into an eventual decline for the stock indices.
Source: www.stockcharts.com
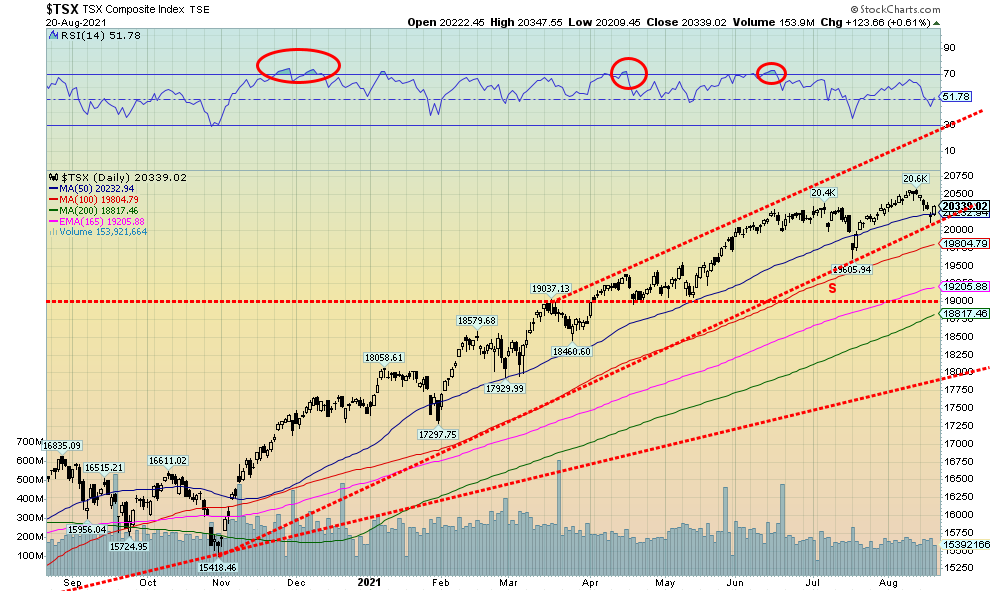
We continue to believe the TSX Composite has topped, at least temporarily. A rise to new highs the previous week saw no follow-through and the TSX fell this past week, losing 0.9%. The small cap TSX Venture Exchange (CDNX) fared worse, down 6.3% and it is has now turned negative for the year, off 1.2%. Many of the junior gold mining stocks that dominate the index were hit this past week, albeit on low volume. The CDNX looks tippy and a break of 850 could send it tumbling further. A possible descending triangle has been forming with lower highs (1001, 982, 926) and a relatively flat series of lows (867, 868, 860). Potential targets could be down to 720.
This past week only 5 of the 14 sub-indices saw gains on the week. And all 5 made new all-time highs. But they weren’t enough to push the TSX higher as the dominant TSX Energy Index (TEN) took a 6.5% hit. The biggest loser was Metals & Mining (TGM) down 7.8%. Other big losers were Materials (TMT), off 5.4% and Golds (TGD), down 3.1%. The big winners were Information Technology (TKK) +1.7% and Consumer Staples (TCS) +1.3%. Other winners were Industrials (TIN) +0.8%, Telecommunications (TTS) +1.1% and Utilities (TUT) +1.2%. The heavily weighted Financials (TFS) were down a small 0.1%.
The TSX did hit support this past week near 20,100 but a solid break under that level would send it down to 19,800. A break of the previous low near 19,605 would be negative and could project the TSX down to 18,600/18,650. That would actually be slightly below the 200-day MA, currently at 18,817. New highs above 20,567 would change this scenario. A decline to the target levels would put the TSX down around 10% from the high which about fits our expectations at this time. Things wouldn’t really unravel until we broke under 17,930. We have no expectation of that at this time.
The major banks that dominate the TSX Financials (TFS) all announced to varying degrees mandatory vaccines to return to the office. We’ll see if that has a negative or positive impact on their stocks this coming week. We saw considerable debate online this weekend with some threatening to move their accounts. Interesting.
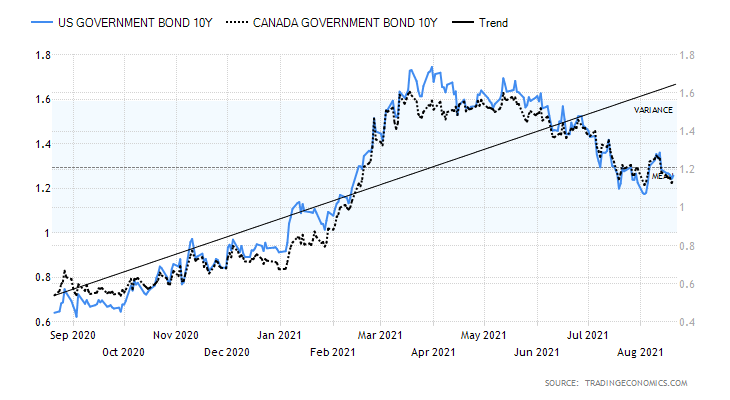
U.S. 10-year Treasury Bond/Canadian 10-year Government Bond (CGB)
Source: www.tradingeconomics.com, www.home.treasury.gov, www.bankofcanada.ca
Despite taper talks, bond yields fell this past week. The 10-year U.S. treasury note dropped to 1.26% from 1.28% and the Canadian 10-year Government of Canada (CGB) fell to 1.15% from 1.18% despite a falling Canadian dollar. The reason yields fell is because of concerns over the rising Delta variant and some economic numbers showing weakness that overshadowed taper talks. One Fed official even mused that he is rethinking his view on tapering. Well, Fed officials will get a further chance to discuss tapering and the economy at the Jackson Hole symposium to be held August 26–28 at Jackson Hole, Wyoming. Previously, most members were in favour of tapering but maybe that’s changed. Taking front stage is the Delta variant and economists are already lowering their Q3 and Q4 GDP forecasts. Inflation has also taken center stage but then one discovers that commodity prices, rather than rising further are actually falling—lumber and oil are the two most visible in decline. Although food prices are staying high and there have been reports of shortages in some developing countries.
FOMC minutes were published this past week but didn’t reveal much more than what everyone already knew--that “taper” was on the Fed officials’ tongues and some expected tapering could begin by year-end. But now, with the rising Delta variant, that may change. Jobless claims continue to slide slowly 348,000 in the latest week down, from 377,000 the previous week. Housing starts fell 7% in July which was more than expected, although building permits were up 2.6%. The biggie was retail sales for July: down 1.1%, well below the expected 0.3% decline. Year over year though, retail sales were up 15.8% but that was from a very deep hole. Industrial production rose 6.6% year over year but below expectations but for July it was up 0.9% above expectations. Capacity utilization continues to be below where it should be at 76.1%. The NY Empire Manufacturing Index was at 18.3, below the expected 29 and the previous 43. More signs things are weakening, not strengthening.
This week we get Q2 second estimate GDP. Consensus is 6.1% vs. previously 4.3%. But the big story is the Jackson Hole symposium. Many still believe another run-up in bond yields is inevitable because of taper talk and inflation. But we see a weakening economy, a rise in the Delta variant, and the potential for taper talk to ease. Hence the importance of this week’s Jackson Hole symposium.
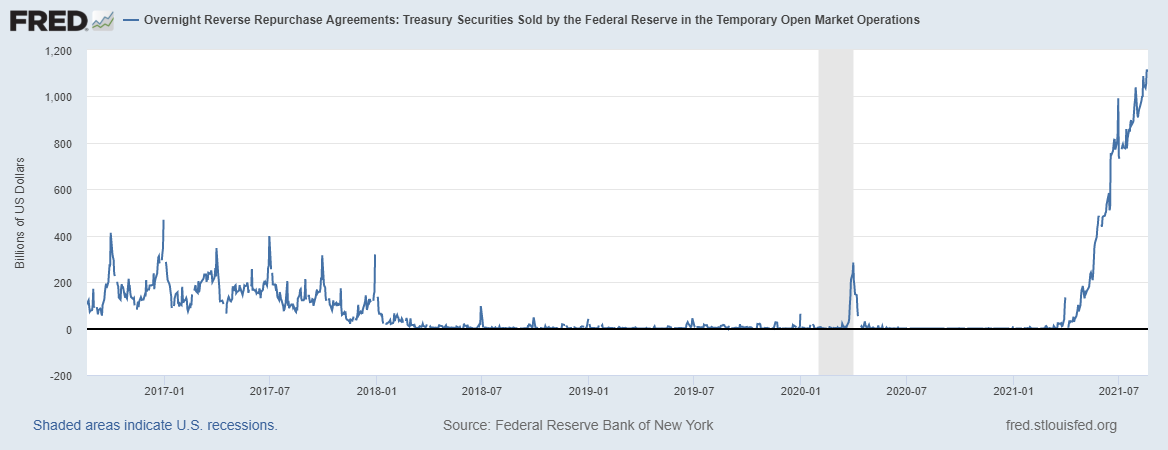
Source: www.stlouisfed.org
The Fed’s bizarre reverse repo program continues. The daily amounts are now up to $1.1 trillion daily. Okay, reverse repos are paid back the next day. But this has become an ongoing exercise. This is being done to soak up all the excess cash that has accumulated at the banks as they don’t know what to do with it due to soft loan demand. Never before have we seen an ongoing reverse repo program like this. No wonder there is taper talk as that is pouring fuel on the fire as banks on one hand sell bonds and MBSs to the Fed and then place them back with the Fed in the form of reverse repos. Strange goings-on.
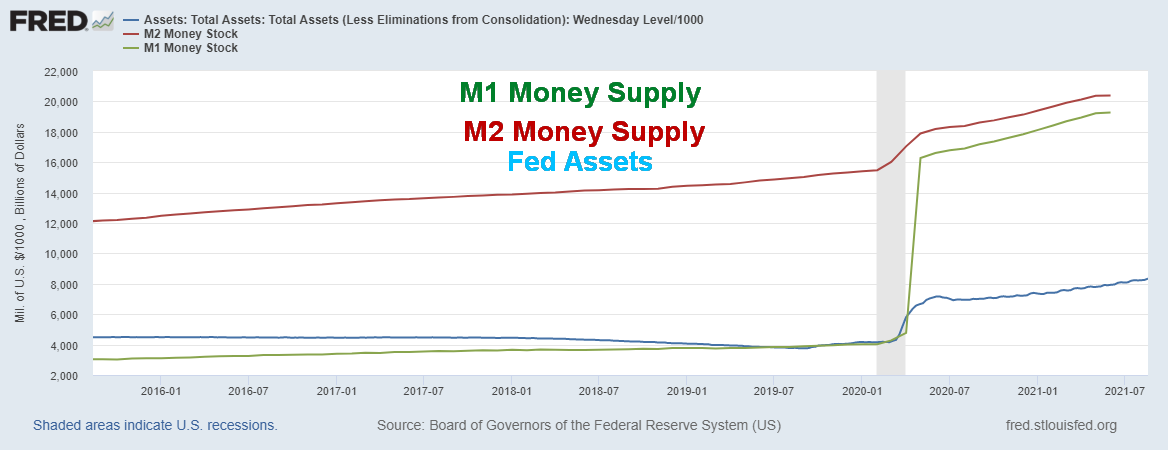
Source: www.stlouisfed.org
Up, up, and away. Money M1 supply up $15.2 trillion since February 2020 or 378%, while M2 up $4.6 trillion or 30%, and the Fed balance sheet up $4.2 trillion or 100%—all since February 2020. And we wonder why the stock market (and housing market) have soared? Too much money (printed) chasing too few assets. Here is the real inflation.
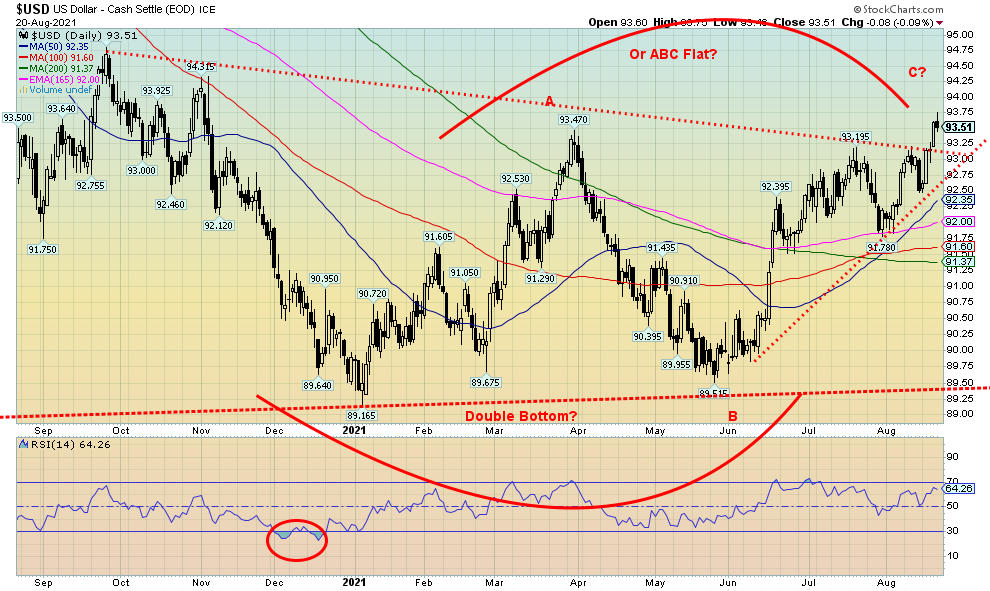
Source: www.stockcharts.com
So, is this it? The US$ Index is poised to take off into the stratosphere? This week the US$ Index rose 1.1% and busted through, taking out the March high of 93.47—closing at 93.51 after hitting a high of 93.60. Taper talk has been helping to propel the U.S. dollar higher along with safe-haven status because of the growing fear of the Delta variant. The euro fell 0.8%, the Swiss franc was down a small 0.1%, the pound sterling dropped 1.8%, and the Japanese yen was off about 0.2%. The Canadian dollar was getting hit because of the fall in commodity prices, particularly oil as it fell 2.6% to 77.84, its lowest level since December 2020 and down 6.6% from its 83.28 high. The US$ Index is now up 4.0% on the year while all the major currencies and components of the index are down on the year.
The question is, will the US$ Index have follow-through to the upside? Signs of a weakening economy and the Jackson Hole symposium this coming week could change things, especially if the FOMC starts easing its taper talk that so many are expecting. The next target could be the September 2020 high of 93.79 or even up to major resistance at 94.60 to 95.00. That would have negative ramifications for gold and commodities. The double bottom scenario is still in play and it potentially projects up to 98.90. Or this could be a false breakout and the ABC flat pattern is still in play. The euro appears to be nearing the end of a downward zig-zag pattern, but the reality is we need taper talk to ease and more negative news to come out on the Delta variant and economic numbers. Support is at 93 but a break below that could set the stage for more losses. A break of 92.75 would most likely confirm the dollar rally is over for now. But after that there remains considerable support down to 91.50.
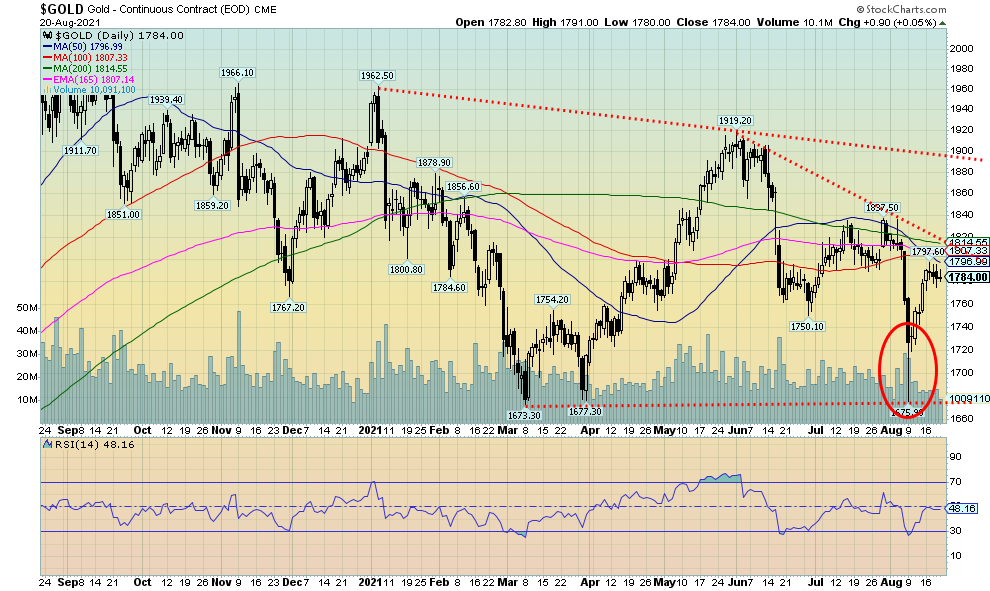
Source: www.stockcharts.com
Gold prices have recouped over $100 from gold’s failed shakedown on August 9. While gold collapsed some $142 on August 8 and 9, the actual close on August 9 was some $50 off the low. Since then, gold has rallied another $70 but failed just under $1,800 and has waffled since then. Gold actually gained on the week, up a small 0.3%. That was better than the 2.8% loss for silver, the 3.1% decline for platinum, the 14.3% drop for palladium, and the 5.7% decline for copper. Gold diverged with silver on August 9 as gold failed to break under its March 2020 low of $1,673, but silver fell under its March 2020 low of $23.74. Divergences of this nature are often seen at lows and highs. We covered a number of things for gold in our “Chart of the week” so no point in repetition.
Gold has been weak because of fear of tapering and a strong U.S. dollar. While there were signs of an improving U.S. economy, even that is dissipating so that might be now helping gold. That, along with the rise of the Delta variant which threatens to derail the economic recovery. Like silver, we are now questioning whether gold could be forming a descending triangle which is bearish. The absolute high was $2,089 seen in August 2020, but since then highs were seen at $1,966 in November, $1,962 in January, $1,919 in May, and $1,837 in July. Our relatively flat bottom is the $1,673 in March and the $1,675 in August. One has to beware that this actually might be a descending triangle. A firm breakdown under $1,675 could target gold down to $1,400/$1,450. To the upside, gold first needs to regain $1,800, then break above $1,820/$1,830 and finally above $1,900 to convince us that we have made our low. Above $1,960 would put the August 2020 high in sight.
The big problem is the surging U.S. dollar and until the US$ Index drops off, the pressure on gold is to the downside. If the Fed would end taper talks, then that would be a big help for gold. The fact that the 10-year U.S. treasury note has a negative yield of almost 400 basis points (bp) should favour gold. Even less food and energy the negative spread is close to 300 bp. The 10-year breakeven rate is around 2.27%. So, the 10-year has a nearly a 100 bp deficit to that number. All that should favour gold. We’ll see what comes out of the Jackson Hole symposium this coming week and whether it could help gold.
A competitor against gold has been the sudden resurgence of Bitcoin that has soared from around $30,000 to $48,000. Some easing of Bitcoin and the cryptos would also be helpful for gold. While gold is a safe haven, the U.S. dollar could also be a safe haven. We note that platinum and palladium fell this past week and they could be negatively impacted by all the supply chain disruptions that are also plaguing Asian stock markets. One good note is we have seen some central bank buying of gold lately, particularly from Russia.
Gold has been frustratingly weak of late and we see little relief until we can regain key levels above. Otherwise, the risk remains to the downside.
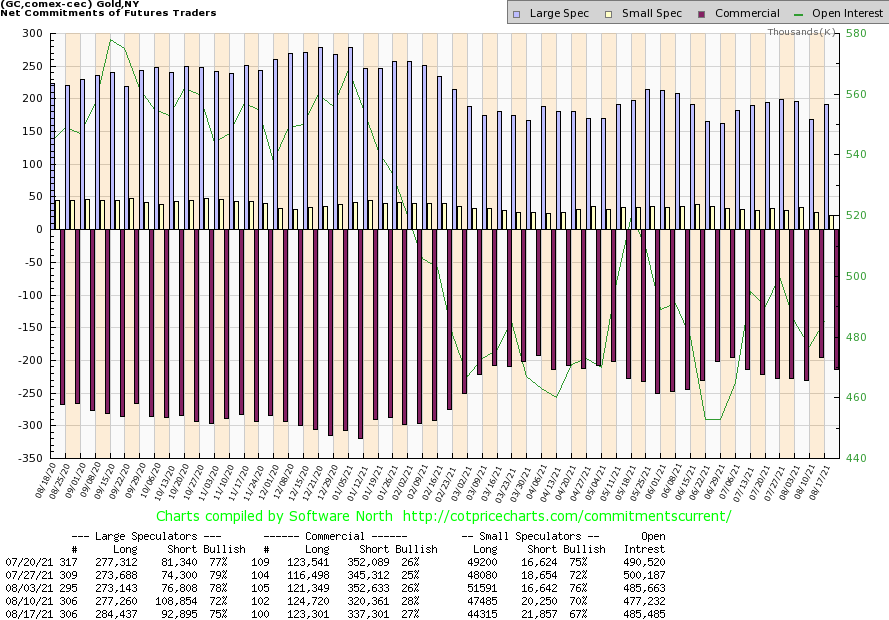
Source: www.cotpricecharts.com
The gold commercial COT (bullion companies and banks) slipped to 27% this past week from 28%. Short open interest rose roughly 17,000 contracts while long open interest slipped just over 1,000 contracts. Since we saw resistance develop near $1,800 it could be that the commercials came back in as sellers near that level. The large speculators COT (hedge funds, managed futures, etc.) rose to 75% from 72% as they added about 7,000 longs and slashed their shorts by roughly 16,000 contracts. We suspect here that the large speculators are getting ahead of themselves, which raises the potential for another shakedown for gold.
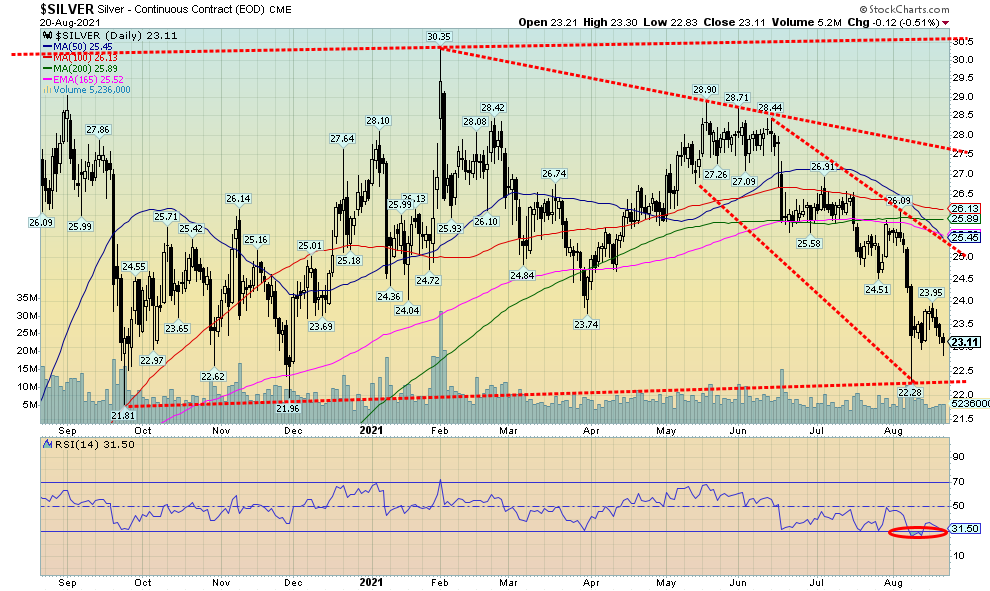
Source: www.stockcharts.com
Silver prices are struggling. Strange for a sector in supply deficits. Like gold, silver spiked sharply downward on August 9, hitting a low of $22.28 that was perilously close to the November 2020 low of $21.96 and the September 2020 low of $21.81. We view those areas as key support. The spike down on August 9 was followed by a strong rebound the same day and silver closed the day at $23.27 a good $1 higher. Since then, silver has waffled, failing to get back over $24 and this past week fell 2.8%, leaving silver down 12.5% on the year and down about 24% from its high seen in February 2021. Like gold, we could argue two things here but it is the bear case that is dominating. Silver is forming a potentially huge descending triangle with a relatively flat bottom along $22 and declining highs with the key on the high at $30.35, but since then highs were seen at $28.90, next at $26.91, and then lastly at $26.09. A firm breakdown under $22 could in theory target silver to collapse to $14. If that happened, and we can’t rule it out, then that would, we believe, coincide with the key cycle lows we are looking at for gold. Silver generally follows gold but its cycles are slightly different. Our concern here is that silver tends to lead, both up and down, and right now silver is outperforming to the downside. Silver’s RSI has fallen under 30 or just around that level so a rebound could be in the offing. But there is strong resistance up to $25 with interim resistance at $24. Failure to break over those levels would be quite negative and we have to look out below. Ultimately, silver needs to break over $27.50 to convince us that this is over. Right now, the bear case is dominating despite the desires of the letter writers.
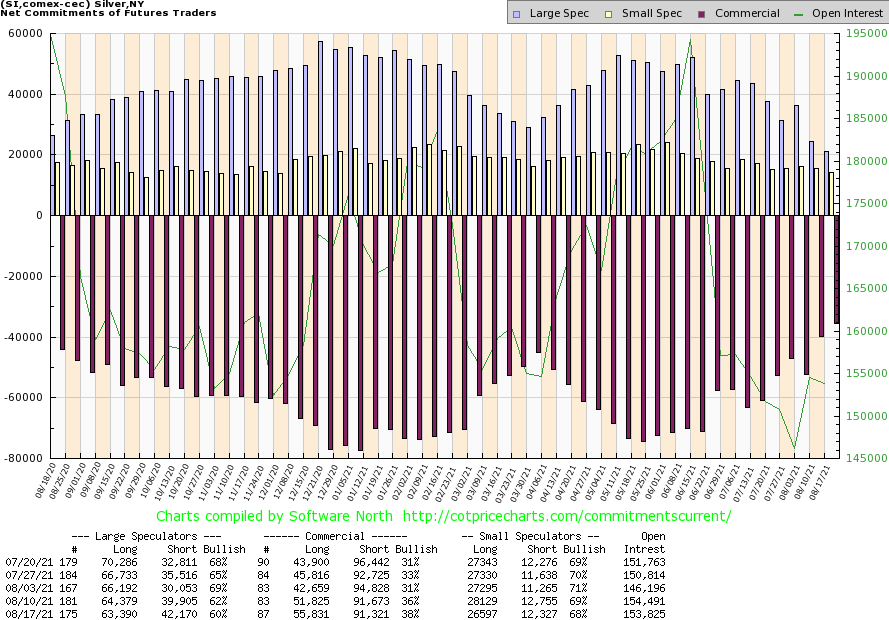
Source: www.cotpricecharts.com
Further improvement for the silver commercial COT that jumped to 38% this past week from 36% the previous week. While the short open interest position was relatively unchanged, long open interest rose roughly 4,000 contracts. The large speculators COT got more bearish, falling to 60% from 62% as the large speculators added almost 3,000 contracts to their short open interest while long open interest fell about 1,000 contracts. At significant lows the commercial COT is usually rising while the large speculators COT is falling. We’d love to see the commercial COT over 40% to help convince us that low could be nigh.
Source: www.stockcharts.com
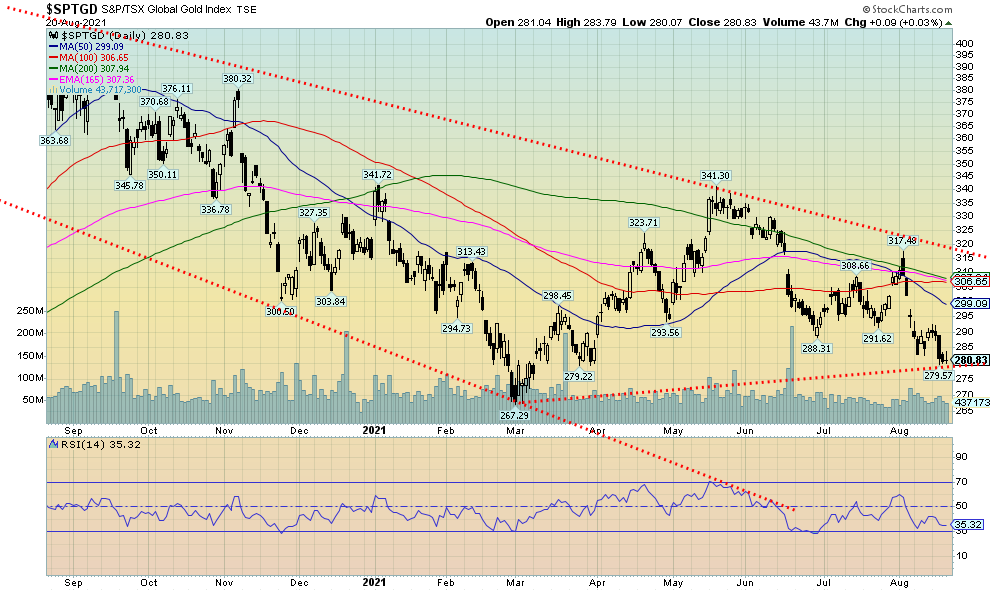
Woe is the gold stocks. They are in a real bear market. And now that bear market in the intermediate and senior gold stocks is flowing into the junior exploration market where we saw a number of small juniors get hit this past week on what we believe was profit-taking, which it was done on very low volume. The TSX Venture Exchange (CDNX), an index more than 50% of which are junior mining stocks, is down 22% from its recent high but a number of junior exploration gold stocks are down 30% to 50% from their highs. The drop in the gold stocks has been on low or at least receding volume. The Gold Bugs Index (HUI) fell 5.9% this past week and is now down almost 20% on the year. The HUI also made a fresh 52-week low. Overall, the HUI is down almost 36% from its August 2020 high. The TSX Gold Index (TGD) is actually faring better, down only 3.1% this past week, down 10.9% on the year and down about 33% from the August 2020 high. The HUI, as noted, made new lows, while the TGD did not—a divergence. Yes, they do have different components with the HUI having more of an international bent whereas the TGD is primarily Canadian-based gold stocks.
With the gold stocks entrenched in bear territory, one is naturally seeking a low. Both indices are treading in oversold territory for many indicators. Sentiment, as measured by the Gold Miners Bullish Percent Index (BPGDM), is at 30%, nowhere near the low of 24.14% seen at the March lows and definitely nowhere near the 7.69% seen in March 2020 or the absolute 0% in December 2015. The BPGDM has room to move lower. Numerous gold letter writers remain upbeat and bullish, but the reality is the gold stocks have been in a bear market for a number of months now. The TGD needs to regain back above 300 for some sign of relief. The TGD doesn’t fully break out until it is firmly over 315, some distance from the current 280. Support is down to the March low at 267, a level that should provide solid support.
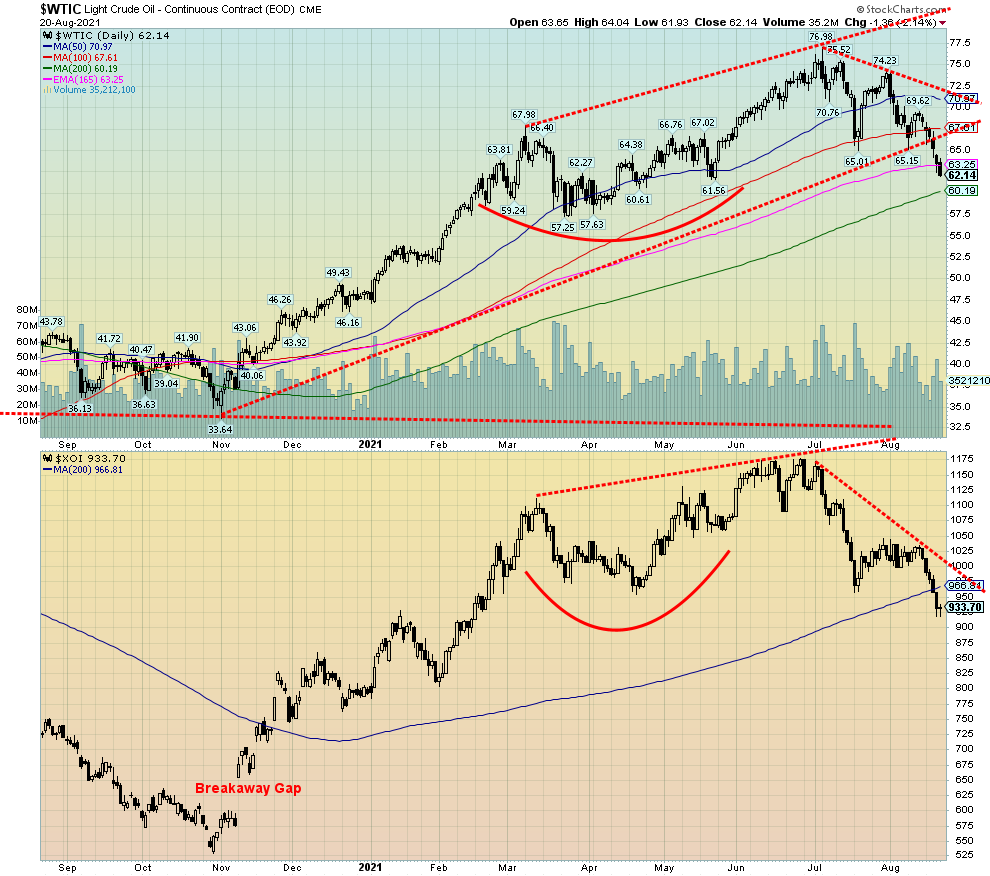
Source: www.stockcharts.com
Oil prices appear to be in the throes of a breakdown. WTI oil has now fallen almost 19% from its high in July. The ARCA Oil & Gas Index (XOI) is down about 21%, officially in bear market territory. The TSX Energy Index (TEN) has dropped 22% from its July high, also in bear territory. Both indices have fallen under the key 200-day MA; however, WTI oil is holding, so far, just above that key level.
This past week WTI oil fell 9.2% while the XOI was down 7.8% and the TEN down 6.5%. The driver? The rising COVID numbers in the U.S. and globally, a strengthening U.S. dollar, primarily due to all the taper talk, and signs that the economy may be weakening. Natural gas (NG) is faring better, off only a small 0.3% this past week.
An interesting tidbit we picked up in all the discussions with OPEC about supply increases was that OPEC produced 109% of target production quotas in July. Overall, compliance in July was 116%, primarily due to Saudi Arabia rolling back its supply cut.
The question now is, will oil prices fall further? Drivers should soon start seeing some benefit at the pumps because of the price drop. Gasoline futures have seen a decline of almost 20% from their high of late July. But, like WTI oil, it is at/near its 200-day MA and a bounce might be expected this coming week. However, both could quickly run into resistance. WTI oil at $63/$65 and gasoline at $2. As to the XOI and TEN the 200-day and 100-day MAs could soon act as resistance. XOI resistance at 967 and up to 1,000 while the TEN’s resistance would come in at 118/120.
Everyone thought that oil prices were soon going to be at $100. Our original targets were somewhere between $75 to $80 and the high near $77 met that objective. Now, how far will it fall? Support is easily seen at $60, but below that level support could range all the way down to $52. A normal correction of the move from November 2020 to the high in July 2021 would be $60, but if we were to go much deeper then WTI oil could fall to somewhere between $50 to $55. The RSI for WTI oil has fallen under 30 and that oversold level has often signaled a potential rebound, which is one reason we might see a rebound rally this coming week.
Copyright David Chapman, 2021
|
Charts and commentary by David Chapman Chief Strategist, Enriched Investing Inc. Phone: 416-523-5454 Email: david@davidchapman.com dchapman@enrichedinvesting.com Twitter: @Davcha12 August 23, 2021 |
Disclaimer
|
GLOSSARY Trends Daily – Short-term trend (For swing traders) Weekly – Intermediate-term trend (For long-term trend followers) Monthly – Long-term secular trend (For long-term trend followers) Up – The trend is up. Down – The trend is down Neutral – Indicators are mostly neutral. A trend change might be in the offing. Weak – The trend is still up or down but it is weakening. It is also a sign that the trend might change. Topping – Indicators are suggesting that while the trend remains up there are considerable signs that suggest that the market is topping. Bottoming – Indicators are suggesting that while the trend is down there are considerable signs that suggest that the market is bottoming.
|
David Chapman is not a registered advisory service and is not an exempt market dealer (EMD) nor a licensed financial advisor. We do not and cannot give individualised market advice. David Chapman has worked in the financial industry for over 40 years including large financial corporations, banks, and investment dealers. The information in this newsletter is intended only for informational and educational purposes. It should not be considered a solicitation of an offer or sale of any security. Every effort is made to provide accurate and complete information. However, we cannot guarantee that there will be no errors. We make no claims, promises or guarantees about the accuracy, completeness, or adequacy of the contents of this commentary and expressly disclaim liability for errors and omissions in the contents of this commentary. David Chapman will always use his best efforts to ensure the accuracy and timeliness of all information. The reader assumes all risk when trading in securities and David Chapman advises consulting a licensed professional financial advisor before proceeding with any trade or idea presented in this newsletter. David Chapman may own shares in companies mentioned in this newsletter. We share our ideas and opinions for informational and educational purposes only and expect the reader to perform due diligence before considering a position in any security. That includes consulting with your own licensed professional financial advisor.
About the author


Website: https://www.enrichedinvesting.com
Disclaimer: David Chapman is not a registered advisory service and is not an exempt market dealer (EMD) nor a licensed financial advisor. We do not and cannot give individualised market advice. David Chapman has worked in the financial industry for over 40 years including large financial corporations, banks, and investment dealers. The information in this newsletter is intended only for informational and educational purposes. It should not be considered a solicitation of an offer or sale of any security. The reader assumes all risk when trading in securities and David Chapman advises consulting a licensed professional financial advisor before proceeding with any trade or idea presented in this newsletter. David Chapman may own shares in companies mentioned in this newsletter. We share our ideas and opinions for informational and educational purposes only and expect the reader to perform due diligence before considering a position in any security. That includes consulting with your own licensed professional financial advisor.