
"Some things are so unexpected that no one is prepared for them. "
—Leo Rosten, American humourist, political scientist, from Rome Wasn’t Burned in a Day: The Mischief of Language (1972); 1908–1997
“An economist is an expert who will know tomorrow why the things he predicted yesterday didn’t happen today. “
—Evan Esar, American humourist who wrote Esar’s Comic Dictionary (1943); 1899–1995
"If you can look into the seeds of time, and say which grain will grow and which will not, speak then unto me. "
—William Shakespeare, English playwright, poet, actor, from Macbeth; 1564–1616
“Many forms of Government have been tried, and will be tried in this world of sin and woe. No one pretends that democracy is perfect or all-wise. Indeed, it has been said that democracy is the worst form of Government except for all those other forms that have been tried from time to time…”
—Winston S. Churchill, British statesman, army officer, writer, Prime Minister United Kingdom 1940–1945, 1951–1955, November 11, 1947; 1874–1965
It feels as if there are no words to describe what was supposed to be the unthinkable. That a mob would storm the U.S. Capital to reject the legitimacy of a duly elected president in the heart of what is supposed to be the world’s leader of liberal democracies. Despite the many flaws in our democratic societies, winners generally assume their rightful powers and losers step down graciously and voluntarily leave office. But there it was for the world to see. An assault on democracy itself. It is a stark demonstration of how a democracy can suddenly slip into anarchy. The next step would be autocracy. Ask Germany, Italy, Japan, and Spain what happened in the 1930s.
And, against this backdrop, a record number of Americans (over 300,000) were diagnosed with COVID-19 and a record number (4,200) died in one day alone at about the same time a mob was attacking Capital Hill. Is America out of control?
Despite all of this, that is not supposed to be our focus. Our focus is supposed to be markets and the economy and explaining what takes place there, not the political and the daily case and death load of the COVID-19. They are, however, all entwined. Just as the markets are inseparable from the economy, the economy is also attached to the political, and the political watches the markets and the economy. Markets respond to the economy, but they watch the political. And the COVID-19 is totally intertwined with both the political and the economy and in turn connected to the markets.
There is also the media. The media reports, analyzes, and opines about markets, the economy, the political, and the pandemic. But there was little to prepare any of us for what happened on January 6, 2021. The day of the Epiphany. A contested election is not supposed to end in mob insurrection in the world’s supposed leader of liberal democracies. But it did. Where we go from here is not yet written.
And what did the markets do? Shrug. Yawn. The Dow Jones Industrials (DJI) rose 438 points, 1.4%. It added more the next day and the day after that. Risk assets were back on. An insurrection? Pfft!
So, what gives? Markets are concerned about the economy. Their focus is, where will we be after the pandemic passes and people get vaccinated? Where will we be once all of the economic and monetary stimulus sinks in and these annoyances of the pandemic and the strife on the streets have passed?
The U.S. has a long history of civil strife. It was born in revolution and its people fought four years of a devastating civil war that, 155 years later, still lingers. U.S. history is also about slavery, the trail of tears, Jim Crow laws, segregation, McCarthyism. The U.S. fought in two world wars and emerged as the economic and political leader of the world—America, the beacon of light and democracy that attracted millions of immigrants from other countries. But they also entered into wars they shouldn’t have and overthrew governments, including elected governments, to install groups favourable to them.
But do the markets care? Not really. In the middle of the Civil War, the North (Union) lost a battle called the Battle of the Chancellorsville where over 17,000 men died in April/May 1863. The markets rallied on the belief that more money would have to be spent on arms, thus boosting the profits of the arms manufacturers.
Flash-forward to today. An insurrection? Little impact. But the election of two Democrat senators in Georgia was viewed positively as it potentially spelled more relief funds, including the long-desired payment of $2,000 to Americans. They are also looking at the potential for economic recovery in Q2 and Q3.
We took a look at some significant events of civil strife over the past 60 years. The 60s were quite tumultuous with the assassination of President John F. Kennedy, Martin Luther King, Robert Kennedy, and Malcolm X. The period was also dominated by race riots and Vietnam War protests. While the markets topped in 1966, overall, the decade saw the DJI rise almost 18%. Not great, but considering there were four sharp corrections in 1960, 1962, 1966, and 1969 ranging from 17% to 36%, the overall gain was positive.
The 1970s, 1980s, and even the 1990s were not as strife-filled, for whatever reason. The most notable events during the 1970s were the Wounded Knee Incident in 1973, the New York blackout riots in 1977, and the Greensboro massacre in 1979. The 1980s saw race riots in Miami in 1980, 1982, and 1989. The 1990s did see the Rodney King riots and at the end of the decade there was the famous “Battle in Seattle” in 1999 which was a part of a global protest against the WTO. Canada even caught the bug with the “Battle of Quebec” in 2000 which also included protests against the G20 and the Summit of the Americas that were being held in the city at the time.
The 2000s were also relatively quiet. One of the most notable events was the civil strife during Hurricane Katrina in New Orleans 2005. The decade ended with the shooting by BART police in Oakland, California, triggering race riots. Racial strife and the rise of Black Lives Matter (BLM) have since dominated the past decade.
In our table below we outline some of those significant events of civil strife and look at how the stock market performed. No surprise—the stock market largely ignored the ongoing street battles. Which is why the market has also largely ignored the storming of Capital Hill in Washington on January 6. Unless the current civil strife spreads and triggers a potential civil war as some have postulated, the market will most likely continue to set the civil unrest aside. America is deeply divided. There is a level of polarization not seen since the Civil War of 1861–1865. Nobody believed that a war would start back then. There is the same feeling today. Could the unthinkable happen? And then what would the markets do?
|
Significant events of civil unrest: 1960–present |
What happened in the stock market |
|
1963 – assassination of John F. Kennedy |
DJI rose roughly 1.7% into year end |
|
1960s – race riots that primarily got underway in 1964 and lasted through the assassination of Martin Luther King in 1968 |
DJI rose 24% 1964 to 1968. There was a sharp correction in 1966 when the DJI fell 25% during February–October |
|
Vietnam war protests occurred primarily between 1967 and culminated after the Kent State riots/shootings in May 1970. The period included the Democratic National Convention riots in August 1968. |
DJI rose 10.5% 1967 to 1970. There was a relatively mild recession from December 1969 to November 1970. DJI fell 36% from December 1968 to May 1970, but that came after a long expansion, rising interest rates, inflation, and rising budget deficits due to the Vietnam war. |
|
Rodney King race riots April–May 1992. |
DJI rose 4.6% April–May 1992 |
|
The birth of Black Lives Matter (BLM) got underway following the killing of teenager Michael Brown in Ferguson, Missouri, August 2014. But racial unrest was underway earlier following the killing of Oscar Brant by BART police Oakland, California in January 2009. The past decade has witnessed upwards of 40 significant riots and protests, primarily due to race but also including the Occupy Wall Street protests in 2011 and the Dakota pipeline protests in 2016. Racial unrest has continued into 2020, particularly following the killing of George Floyd in Minneapolis, May 2020. These clashes are ongoing. |
DJI is up 380% March 2009 to present. Coming out of the 2008 financial crisis the monetary authorities dropped interest rates to zero and flooded the financial system with liquidity through quantitative easing (QE). While there have been corrections along the way in 2011, 2015–2016, and 2018, none were because of civil unrest in America. The most recent sharp correction in March 2020 was sparked by the onset of a pandemic. |
|
U.S. election protests November 2020 to present. Previously there was the Unite the Right rally and protests in Charlottesville, Virginia August 2017 that culminated in clashes between right wing attendees and counter protestors. Many of the recent clashes have included clashes between both Trump supporters and counter protestors. |
DJI is up 13% since November 3
|
|
The storming of Capital Hill January 6 by pro-Trump supporters to stop Electoral Vote certification by U.S. Congress |
DJI is up over 2% |
Source: www.wikipedia.org, www.stockcharts.com
Chart of the Week
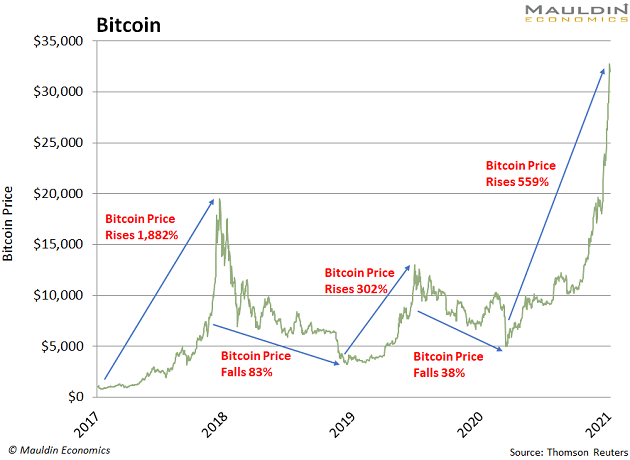
Source: www.maudlineconomics.com, www.thomsonreuters.com
This chart barely came out and it was soon overwhelmed by even higher prices for Bitcoin. Bitcoin has now crossed $41,000. Of course, it has a way to go percentage-wise to equal that manic run in 2017. But it is trying awfully hard. It is always spectacular to see not one mania but two in such a short period of time. We are not sure we have ever seen that. At least there were 70 years between the “Roaring Twenties” stock market bubble and the NASDAQ dot.com/high-tech bubble mania. Like all bubbles or manias, however, they do not end well.
One of my favourite investment books is Extraordinary Popular Delusions and the Madness of Crowds, originally published in 1841 written by Charles MacKay. It is an extraordinary work of social history, highlighted by the description of “Tulipomania” (1636–1637), a period that saw the price of tulips rise a mind-boggling 5,900%. There is even a film about it, appropriately called “Tulip Fever” (2017). It’s a love story set against the backdrop of tulipomania. Beautifully mounted but historically inaccurate and a flop at the box office. Still, we guess does it matter, especially if he gets the girl (no spoilers).
Tulipomania saw the price of tulips eventually fall anywhere from 82% to 99%, wiping out a few fortunes along the way. Since then, we have seen numerous bubbles (i.e., gold and silver in 1979–1980, Japanese land and stock market in 1980–1990, and others) and even bubbles in individual stocks (eDigital (EDIG) 1999–2000 +45,400% or Bre-X (BXM) 1995–1996 +13,305%). Some might argue we are in another bubble when one considers that Amazon (AMZN) has gone up 10,142% since 2008. But it is rare to see two bubbles for the same stock/index/instrument, etc. in such a short period of time. We are not sure it has ever happened.
Many will say this is not a bubble. It is legitimate. Some describe Bitcoin as “rat poison squared” (Warren Buffett). Some believe its real value is 0. Others are conservatively calling for a move to $100,000. The question is, do digital currencies have a longer shelf life? Governments are getting involved. So are the corporations, especially the financial corporations. There are even futures contracts you can trade on the Chicago Mercantile Exchange (CME) and the Intercontinental Exchange (ICE). As well, we note that both CME and ICE are listed on a stock exchange, making both potential proxies and a less volatile way of trading Bitcoin. So, is Bitcoin an investment or merely a speculative trading instrument? You can’t really use it for much, although there is a raft of places that will accept Bitcoin as payment, it and the other digital currencies (8,200 of them according Coin Market Cap www.coinmarketcap.com) are not useful for much outside of speculation. And speculate they do.
After all, there is limited supply. Circulating supply of Bitcoin (BTC) is 18,593,612, making it as rare as, well, gold. There are apparently no plans to issue more. You can buy it in little pieces so you don’t have to plunk your money down and buy 1 Bitcoin. Bitcoin dominates the crypto market. Bitcoin currently has a market cap of $741.1 billion, making it by market cap one of the biggest in the world now. That puts Bitcoin in roughly the same company as Facebook (FB) or Tesla (TSLA) but well short of the biggies Apple (AAPL), Microsoft (MSFT), Amazon (AMZN), and Alphabet (GOOG). Apple is the biggest with a market cap of about $2.1 trillion. Bitcoin is so dominant amongst the cryptos it makes up some 69% of what has become a trillion-dollar market.
So where is Bitcoin going? Predictions that it is going to $30,000 are barely out and it has quickly surpassed that. Of course, now we hear $100,000 and even higher. Who knows? What we do know is that governments are and will get into the crypto universe (note: governments control currency), tax enforcement will increase, and Blockchain, the technology behind Bitcoin, will expand. In the interim, Bitcoin is in a bubble/mania. It is not for the faint of heart and it will remain extremely volatile.
But does Bitcoin remind you of another possible bubble mania?
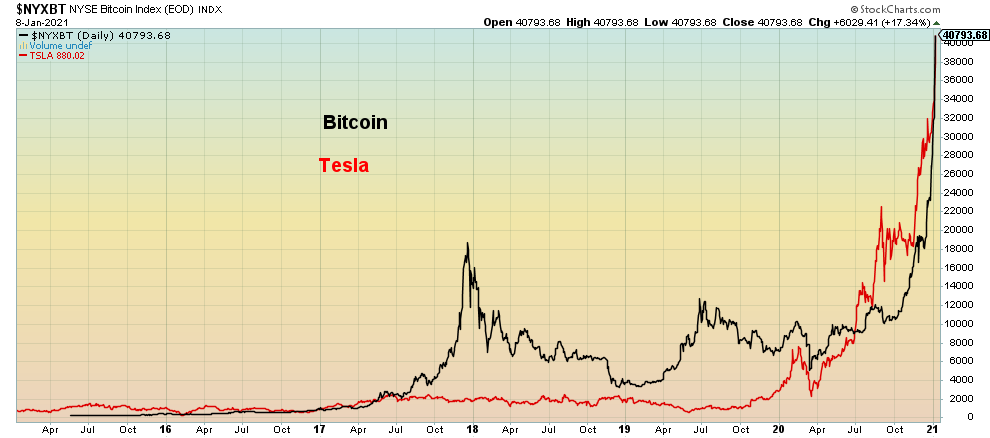
Source: www.stockcharts.com
MARKETS AND TRENDS
|
|
|
|
% Gains (Losses) Trends
|
|||||
|
|
Close Dec 31/20 |
Close Jan 8/21 |
Week |
YTD |
Daily (Short Term) |
Weekly (Intermediate) |
Monthly (Long Term) |
|
|
Stock Market Indices |
|
|
|
|
|
|
|
|
|
S&P 500 |
3,756.07 |
3,824.68 (new highs) |
1.8% |
1.8% |
up |
up |
up |
|
|
Dow Jones Industrials |
30,606.48 |
31097.97 (new highs) |
1.6% |
1.6% |
up |
up |
up |
|
|
Dow Jones Transports |
12,506.93 |
12,875.66 (new highs) |
3.0% |
3.0% |
up |
up |
up |
|
|
NASDAQ |
12,888.28 |
13,201.98 (new highs) |
2.4% |
2.4% |
up |
up |
up |
|
|
S&P/TSX Composite |
17,433.36 |
18,042.07 (new highs) |
3.5% |
3.5% |
up |
up |
up |
|
|
S&P/TSX Venture (CDNX) |
875.36 |
896.71 (new highs) |
2.4% |
2.4% |
up |
up |
up |
|
|
S&P 600 |
1,118.93 |
1,190.26 (new highs) |
6.4% |
6.4% |
up |
up |
up |
|
|
MSCI World Index |
2,140.71 |
2,209.69 (new highs) |
3.2% |
3.2% |
up |
up |
up |
|
|
NYSE Bitcoin Index |
28,775.36 |
40,793.68 (new highs) |
41.8% |
41.8% |
up |
up |
up |
|
|
|
|
|
|
|
|
|
|
|
|
Gold Mining Stock Indices |
|
|
|
|
|
|
|
|
|
Gold Bugs Index (HUI) |
299.64 |
302.48 |
1.0% |
1.0% |
up (weak) |
neutral |
up |
|
|
TSX Gold Index (TGD) |
315.29 |
321.14 |
1.9% |
1.9% |
neutral |
down (weak) |
up |
|
|
|
|
|
|
|
|
|
|
|
|
Fixed Income Yields/Spreads |
|
|
|
|
|
|
|
|
|
U.S. 10-Year Treasury yield |
0.91 |
1.12% |
23.1% |
23.1% |
|
|
|
|
|
Cdn. 10-Year Bond yield |
0.68 |
0.82% |
20.6% |
20.6% |
|
|
|
|
|
Recession Watch Spreads |
|
|
|
|
|
|
|
|
|
U.S. 2-year 10-year Treasury spread |
0.79 |
0.98% |
24.1% |
24.1% |
|
|
|
|
|
Cdn 2-year 10-year CGB spread |
0.48 |
0.62% |
29.2% |
29.2% |
|
|
|
|
|
|
|
|
|
|
|
|
|
|
|
Currencies |
|
|
|
|
|
|
|
|
|
US$ Index |
89.89 |
90.07 (new lows) |
0.2% |
0.2% |
down |
down |
down |
|
|
Canadian $ |
0.7830 |
0.7870 (new highs) |
0.5% |
0.5% |
up |
up |
neutral |
|
|
Euro |
122.39 |
122.21 (new highs) |
(0.2)% |
(0.2)% |
up |
up |
up |
|
|
Swiss Franc |
113.14 |
112.96 (new highs) |
(0.2)% |
(0.2)% |
up |
up |
up |
|
|
British Pound |
136.72 |
135.63 |
(0.8)% |
(0.8)% |
neutral |
up |
up |
|
|
Japanese Yen |
96.87 |
96.19 (new highs) |
(0.7)% |
(0.7)% |
up |
up |
up |
|
|
|
|
|
|
|
|
|
|
|
|
Precious Metals |
|
|
|
|
|
|
|
|
|
Gold |
1,895.10 |
1,835.40 |
(3.2)% |
(3.2)% |
neutral |
neutral |
up |
|
|
Silver |
26.41 |
24.64 |
(6.7)% |
(6.7)% |
up (weak) |
up |
up |
|
|
Platinum |
1,079.20 |
1,071.30 (new highs) |
(0.7)% |
(0.7)% |
up |
up |
up |
|
|
|
|
|
|
|
|
|
|
|
|
Base Metals |
|
|
|
|
|
|
|
|
|
Palladium |
2,453.80 |
2,365.00 |
(3.6)% |
(3.6)% |
up |
up |
up |
|
|
Copper |
3.52 |
3.67 (new highs) |
4.3% |
4.3% |
up |
up |
up |
|
|
|
|
|
|
|
|
|
|
|
|
Energy |
|
|
|
|
|
|
|
|
|
WTI Oil |
48.52 |
52.24 |
7.7% |
7.7% |
up |
up |
neutral |
|
|
Natural Gas |
2.54 |
2.70 |
6.3% |
6.3% |
neutral |
up |
neutral |
|
Source: www.stockcharts.com, David Chapman
Note: For an explanation of the trends, see the glossary at the end of this article.
New highs/lows refer to new 52-week highs/lows.
Source: www.stockcharts.com
Insurrections and an attempted putsch are of little concern to the stock market, it seems. It shrugged it off. Some better-than-expected economic data with the various PMIs, however, does help. As well, knowing that monetary and fiscal policies should continue to keep the grease on the wheels and that the vaccine might help put the nightmare on Main Street behind us keeps the stock markets focused to the upside. This past week the S&P 500 started the new year off on the right foot, gaining 1.8%. The Dow Jones Industrials (DJI) was up 1.6% and the Dow Jones Transportations (DJT) jumped almost 3.0%. The NASDAQ rose 2.4%. But a big surprise winner was the small cap S&P 600, rising 6.4%. With small caps rising like they are, we know two things. First, the markets should keep on rising; however, small caps are signalling we could be in the final stages as they are always the last ones to really rocket higher. Second, everybody made new all-time highs once again this past week. Well almost everybody. The Dow Jones Utilities (DJU) and the AMEX did not.
Elsewhere, the TSX Composite joined the all-time highs, rising 3.5% while the TSX Venture Exchange (CDNX) continued to rise up 2.4%. Overseas in the EU the London FTSE was up 5.7%, the Paris CAC 40 jumped 2.8% while the German DAX hit new all-time highs, up 2.4%. In Asia, China’s Shanghai Index (SSEC) hit fresh 52-week highs, up 2.8% and Japan’s Nikkei Dow (TKN) also hit new 52-week highs. up 2.5%. The TKN is now within 11,000 of its all-time high seen back in 1990.
The big star of the week was, of course, Bitcoin up an astounding 41.8% to start the year. But as our chart of the week shows, Bitcoin could be in a huge bubble once again. Where it ends, we don’t know. But will the others follow? It is possible given new stimulus to come.
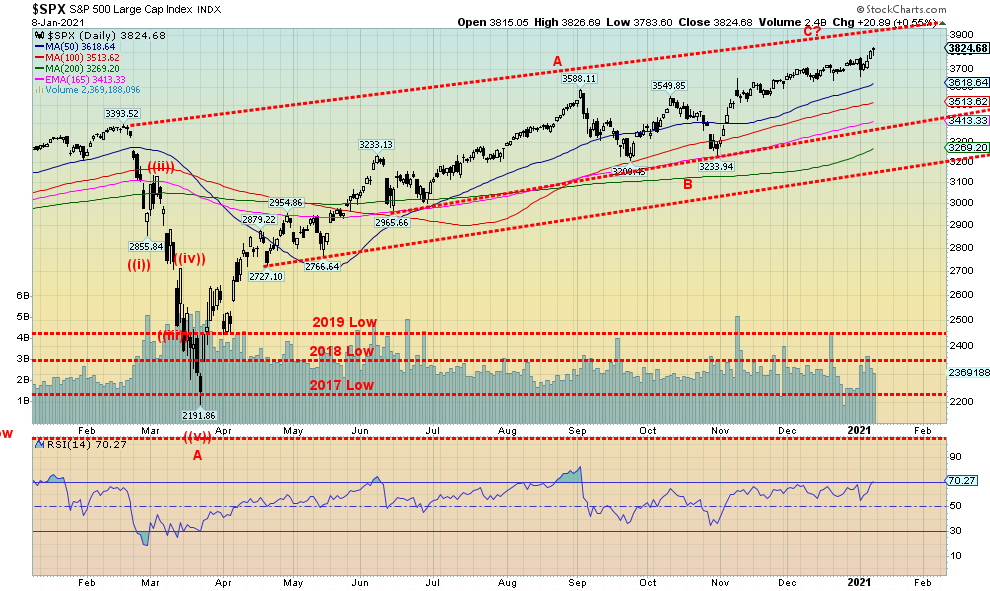
We continue to rise towards potential targets up to 4,100. The top of that channel is over 3,900. We cleared 3,700, a possible resistance point. The RSI is high but can go higher. It is not yet over 70. Small caps appear to be leading the way as we would expect at this juncture. Just be aware that a sudden correction could come at any time. First sign would be a break and close under 3,600. Second sign would be a break and close under 3,500. The major breakdown point and possible panic cycle is under 3,200. But we just don’t see that happening right now. The inauguration is the 20th and it is around the 21st anniversary of the DJI top in 2000. 21 is a Fibonacci number. But if we can get through there still rising, we could continue into February. We live in interesting times.
Source: www.stockcharts.com
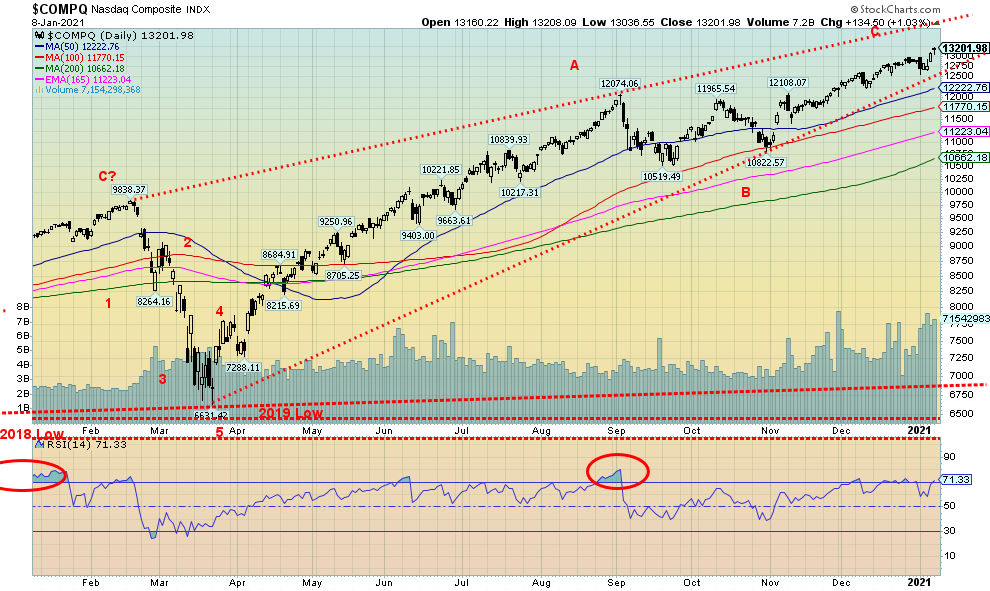
As with everyone, the NASDAQ continued into record territory this past week. But the leadership has changed. No longer does it appear to be the FAANGs. Indeed, Facebook fell 2.1% this past week, Apple was off 0.5%, Amazon dropped 2.3%, Netflix fell 5.6% but Google gained 3.2%. Microsoft fell 1.3% but the big star Tesla continued its Bitcoin rampage, rising 24.7% and making Elon Musk the richest man in the world. At the boring end, Berkshire Hathaway, the plodder, rose 1.2%. The RSI for the NASDAQ is once again over 70 but even a small pullback would help ease overbought conditions. We are in a rising channel and not too concerned unless we were to break and fall under 12,500, although a break of 13,000 could signal the end of the current rise. That channel still has room for the NASDAQ to rise to around 14,000. It’s been quite a run since that low in October, so a pullback would be healthy if this rise is to continue.
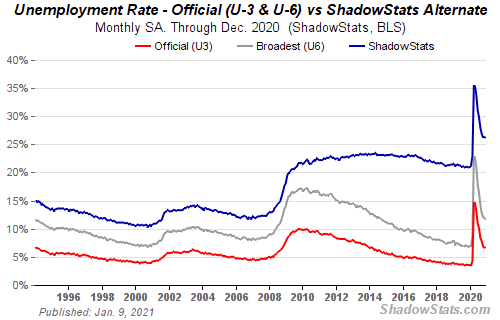
Source: www.shadowstats.com
The U.S. jobs machine ground to a halt in December as the U.S. economy shed 140,000 jobs. That was well below an expected rise of 71,000. This was the first major setback since the big job losses seen in March and April 2020. The U.S. lost 22,160 thousand jobs in that 2-month period but gained back 12,461 thousand over the next seven months or 56%. The December job loss now leaves them at only 12,321 with some expectations that January will be worse. The big decline was in leisure and hospitality, down 498 thousand and government down 45 thousand. Professional and business services gained 161 thousand, retail was up 121 thousand, construction gained 51 thousand, and transportation and warehousing jumped 47 thousand. The number of people working full-time rose 397 thousand but the number of people working part-time fell 456 thousand. Those not in the labour force rose to 100,663 thousand from 100,548 thousand. Of those 55.4 million are retirees and 9.6 million are disabled. The number of people unemployed more than 27 weeks rose 27 thousand. The percentage of those unemployed 27 weeks rose to 37.1% from 36.8%. That number had peaked in May 2010 at 44.9%.
The unemployment rate (U3) was unchanged at 6.7%. The market had expected a rise to 6.8%. The Bureau of Labour Statistics (BLS) reported that the labour force participation rate was unchanged at 61.5%. The employment population rate was also unchanged at 57.4%. The U6 unemployment rate was 11.7% vs. 12.0% in November. The U6 rate is the U3 rate plus short-term discouraged workers under one year and marginally attached workers plus part-time workers forced to work part-time because they can’t find full-time. The Shadow Stats (www.shadowstats.com) unemployment number which is U6 plus long term discouraged/displaced workers over one year and those legislated out of existence in 1994 fell to 26.2% from 26.3%.
It was also not a surprise to learn that the BLS once again understated its U3 number for the tenth straight month. The BLS acknowledges that some workers classified as employed are actually unemployed. In December that number was 952,000 up from 629,000 in November and 562,000 in October. This would have hiked the U3 unemployment number to 7.3% from 6.7%.
Overall, what this is showing is bad for Main Street as the deep recession continues. The recovery from the pandemic is just not happening. With the number of COVID-19 cases expanding, there remains the potential for further lockdowns or at least restrictions that will negatively impact employment. However, with the new administration coming in on January 20, 2020, help will be on its way for the millions negatively impacted. One positive, if you want to call it that, is average hourly earnings rose 5.1% year over year and 0.8% in December. This is largely due to the fact that a big chunk of the jobs lost were lower-paying jobs, leaving higher-paying jobs in place. Overall, there is little to be joyful about in this report. The hope is the vaccine will get things back again. But, realistically, that is going to take some time.
Canada Employment Change
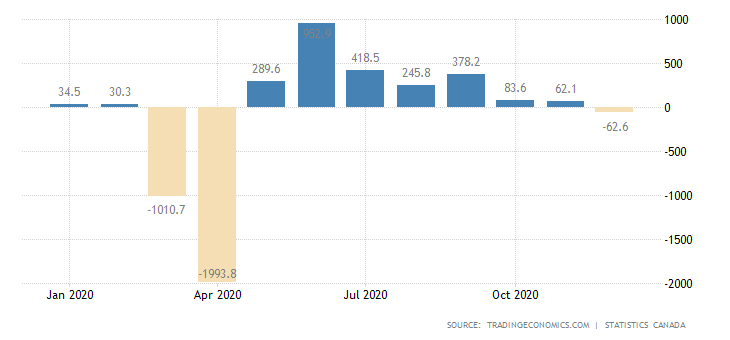
Source: www.tradingeconomics.com, www.statcan.gc.ca
For the first time since April Canada lost jobs. The December employment fell 62,600 jobs when the market had only expected a decline of 27,500. In November the Canadian economy gained 62,100 jobs. Part-time jobs lost 99,000 but full-time jobs unexpectedly gained 36,500. Hard hit in part-time job losses were those under 25 and over 55. Full-time jobs tend to be better paying with benefits. Self-employed also fell 62,000 but public and private sector employees were little changed. Negatively impacting the numbers was the sharp rise in COVID-19 numbers and the subsequent lockdowns. The number of people working from home rose to 28.6%. The unemployment rate was steady at 8.6% despite the drop in jobs. The participation rate did fall, however, to 64.9% from 65.1%. A lower participation rate helps to lower the unemployment rate. The biggest losers were in accommodation and food services, culture and recreation services, and information services. They were losers primarily because of the COVID-19. The R8 unemployment rate ticked up to 11.1% from 11.0%. That rate is the regular unemployment rate plus discouraged workers and involuntary part-timers.
Canada lost 3,004,500 jobs in March and April. The next seven months recouped 2,430,700 or almost 81% of the jobs lost. Despite the setback in December, Canada is still ahead by 2,368,100 or about 79% of the jobs lost. The question is, will January be worse as the COVID-19 crisis deepens?
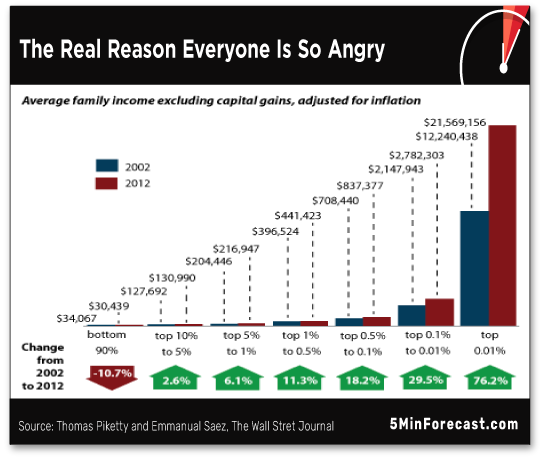
Source: www.5minuteforecast.com, www.wsj.com, Thomas Piketty and Emmanuel Saez
One reason we are facing so much turmoil on the street is encompassed in the above chart. Overall, the bottom 90% of society has seen their income decline. This only goes to 2012. It has steepened even more since then. But it is interesting that the trouble started following the 2008 financial crash. The massive liquidity bailout from the Fed primarily benefitted the top 10% and even more so the top 1%. Then came the Trump tax cuts that added to the widening gap. This builds up resentment and culminates in the social unrest we have witnessed over the past decade. The incoming administration has a difficult job on its hands.
Here’s another look at the same problem from The Economist in November 2019. All of it shows that the rich got richer and the middle class shrunk. And then we wonder at the election of someone like Trump and what happened on January 6, 2021.
See chart on next page
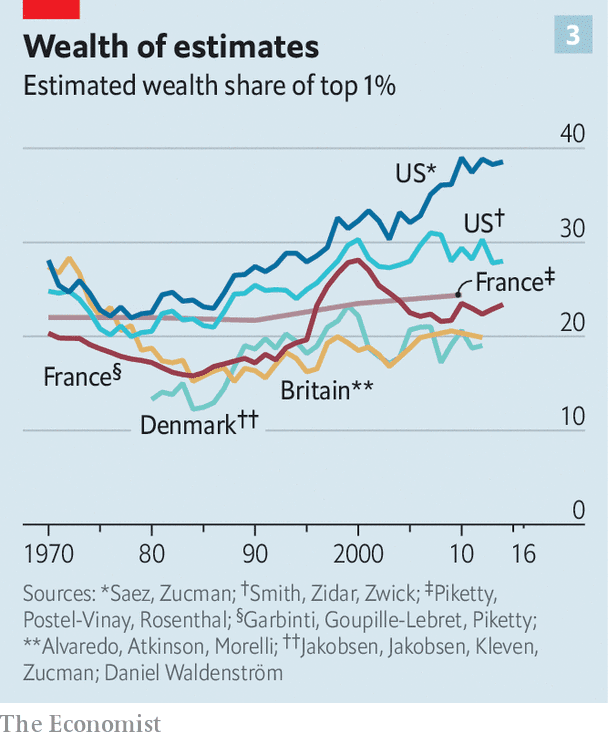
Source: www.economist.com
Source: www.stockcharts.com
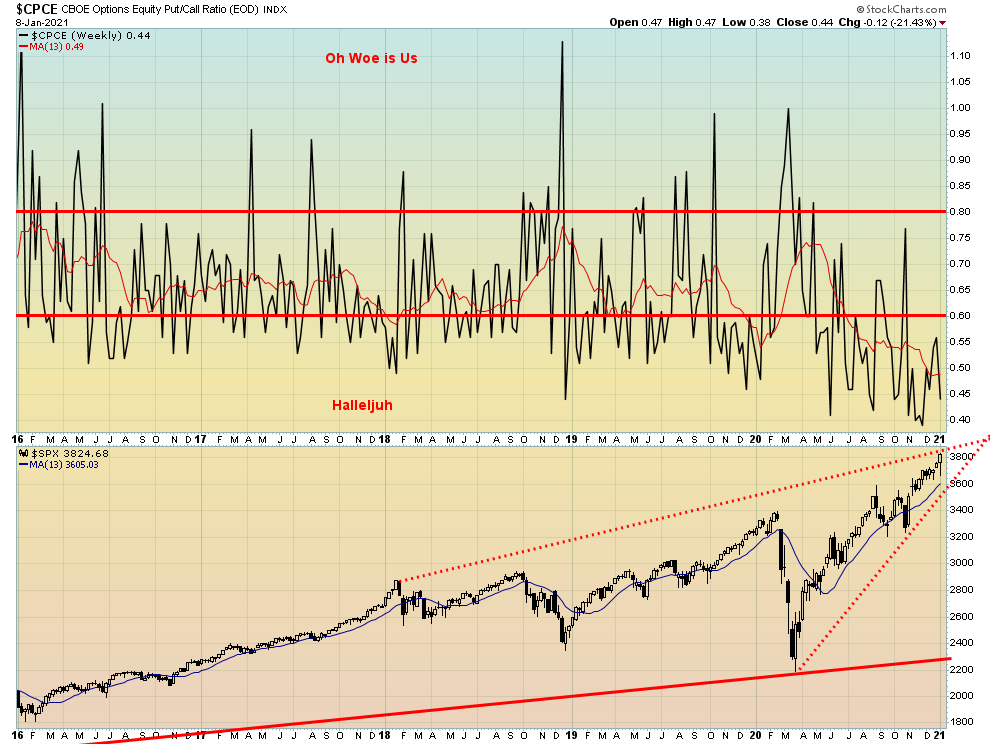
We are not going to spend a lot of time on the indicators as many of them remain quite bullish but thought we’d note the put/call ratio that still remains well in favour of calls over puts. We have rarely ever seen a period like this where the CBOE put/call ratio remains consistently below 0.60 as it has done since April 2020. We know it is all the effect of ultra-low interest rates and oodles of liquidity through QE and stimulus packages. There is more to come and that’s about all one needs to know.
Source: www.stockcharts.com
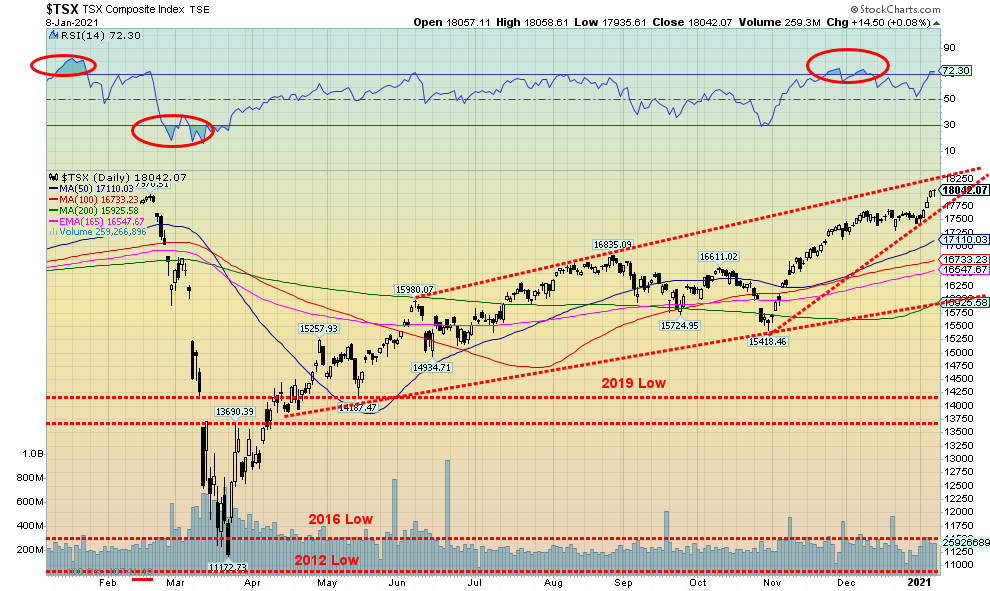
Well, the TSX Composite finally did it: new record highs in the first week of 2021. The TSX 60 joined the party as did the sub-indices Consumer Discretionary, Metals & Mining, Industrials and Utilities. This past week saw the TSX rise 3.7%. All of the sub-indices joined the rise led by Health Care (THC) up 13.3% and Energy (TEN) up 10.1%. With no losers, the weakest sub-index was Consumer Staples up 1.5%. In looking back on 2020, the March 2020 collapse proved difficult for some to overcome. The TSX eked out only a 2.2% gain for the entire year. Six of the 14 sub-indices finished down on the year led by Energy (TEN) down 37.6%. But the TEN is off to a good start in 2021 as are Financials (TFS) who fell 2.9% in 2020. Higher yields are good for the financials. Other interest rate sensitive sectors also lost. Income Trusts (TCM) was down 6.8%, Real Estate (TRE) dropped 13.8%, and Telecommunications (TTS) was off 8.6%. But Utilities (TUT) gained 10.6%. Health Care (THC) was also a big loser, off 21.3%. Going into 2021 we’d be good lookers at Health Care and Financials in particular. Of the gainers, the biggest was Information Technology (TKK), up 54.6%. Metals & Mining (TGM) gained 23.4%, Golds (TGD) jumped 20.7%, and Materials (TMT) was up 19.5%. Consumer Discretionary (TCD) was up 16.0% while Consumer Staples (TCS) was up a small 2.2%. Industrials (TIN) jumped 15.0%. Also having a good year was the small cap TSX Venture Exchange (CDNX). The CDNX is 50% dominated by junior mining companies. The CDNX gained a healthy 49.0% in 2020, its best performance in years.
The TSX could be approaching the top of a bull channel so we’d be a little cautious now going forward. The RSI is now over 70. The current uptrend would break at around 17,750. Under 17,250 further declines could be seen. There are considerable support points all the way down to 16,000.
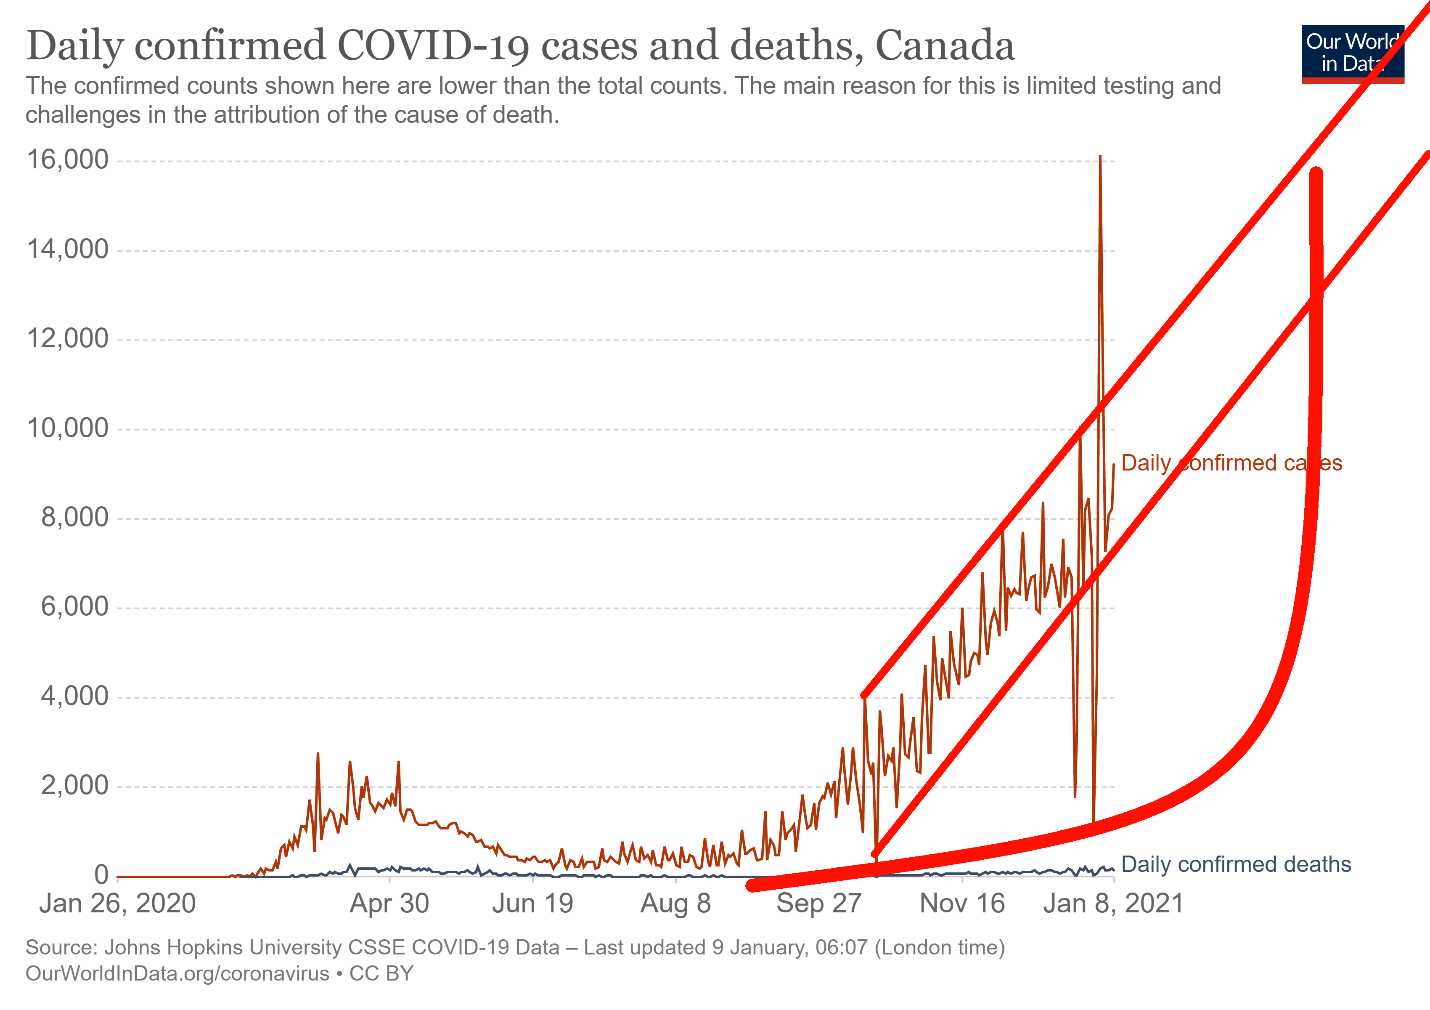
Source: www.ourworldindata.org/coronavirus
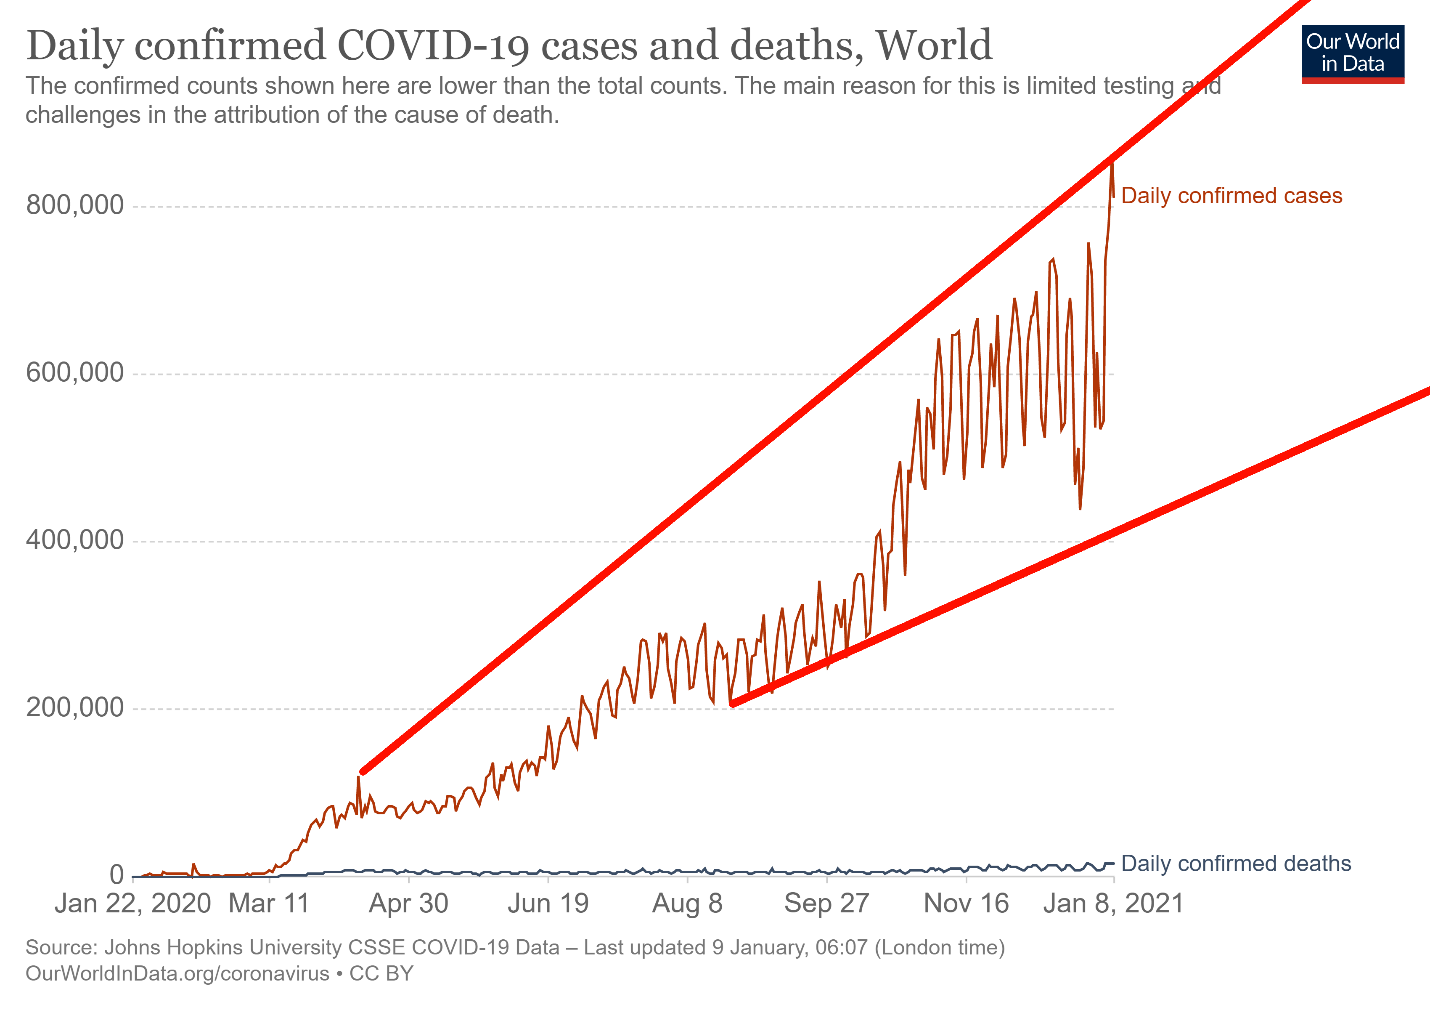
Onward and upward. That is the COVID-19. Globally, cases leaped over 800,000/day this past week. Can a million-case day be far behind? The 7-day average is around 690,000. Deaths are rising as well with over 12,000 dead every day becoming normal. The 7-day average is over 12,000 dead every day. Cases are over 90 million and we add roughly a million cases every other day. The dead keep on rising as well and globally it is over 1.9 million with 2 million looming. Eighteen countries have over a million cases and the Netherlands and Czechia are closing in on that number. Still, only four countries have reported over 100,000 dead, led, of course, by the U.S. with over 375,000 dead. Brazil is now over 200,000, India over 150,000, and Mexico over 130,000. The U.K. is rapidly closing in on 100,000 dead now with over 80,000. At the other end of the spectrum, Taiwan who closed their borders almost immediately has still only recorded 828 cases and 7 dead. Would that we could all have been Taiwan, but the Western countries were not prepared or willing to go the lengths Taiwan did. While Taiwan is pretty normal today, the Western-developed countries remain in chaos.
COVID-19 Coronavirus Cases: Sunday January 10, 2021 16:19 GMT
Number of Cases: 90,338,068
Number of Deaths: 1,938,726
Source: www.ourworldindata.org/coronavirus
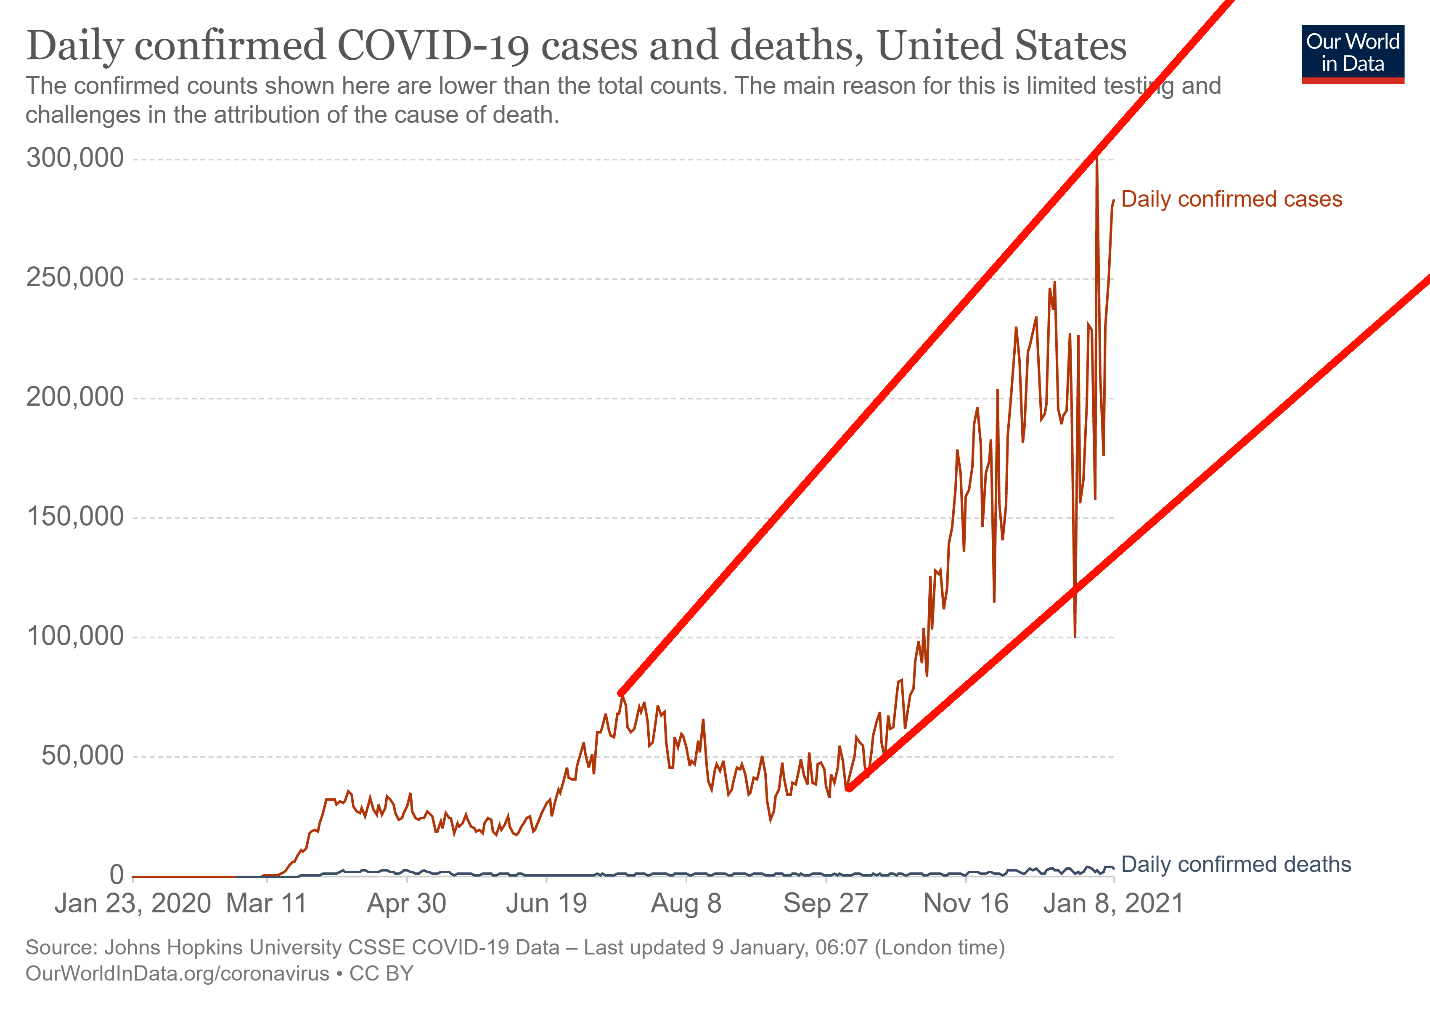
There are no words to describe the horror show that is the U.S.—over 22.7 million cases (and adding to that at an horrendous rate every day) and over 380,000 dead. We are rapidly approaching the number killed in World War II of 438,000. The 1918–1920 Spanish flu killed 675,000 and the Civil War saw 600,000 to 800,000 dead. The current death toll now ranks as the fourth worst disaster for the U.S. Hospitals are overwhelmed, with bodies stacked in corridors and hospitals even advising to only bring in those that can be saved. We are rising in what we call a funnel pattern and we do not see any signs of a top. So, was that a spike when it hit 300,000 in a day or will it become the new norm? The U.S. has also seen over 4,000 dead in a day. In terms of deaths, it is now the second deadliest day in U.S. history. They have a way to go to equal the 8,000 killed in the Galveston Hurricane in 1900. But with over 4,000 dead in a day, it has now beaten the 3,600 killed in one day on the battlefields of Antietam during the Civil War.
COVID-19 Coronavirus Cases: Sunday January 10, 2021 16:19 GMT
Number of Cases: 22,714,728
Number of Deaths: 381,557
Source: www.ourworldindata.org/coronavirus
Canada’s toll keeps on rising. There are now over 650,000 cases and almost 17,000 dead. Days when there are over 10,000 cases have become a norm. Canada, which at one time ranked past 30th in the world is now ranked 24th in cases and 22nd in deaths. Still, we can take some solace in that we rank 81st in terms of cases per million population and 52nd in terms of deaths per million population. We’re not sure it is worth bragging that we are better than the U.S. We appear to be in a nice rising bull channel, setting aside those odd spike days some of which may be misreported numbers. On the good news front, deaths for the most part remain below the first wave reported back in March–June.
COVID-19 Coronavirus Cases: Sunday January 10, 2021 16:19 GMT
Number of Cases: 656,418
Number of Deaths: 16,894
US 10-Year Treasury Note, Canada 10-Year Government Bond (CGB)
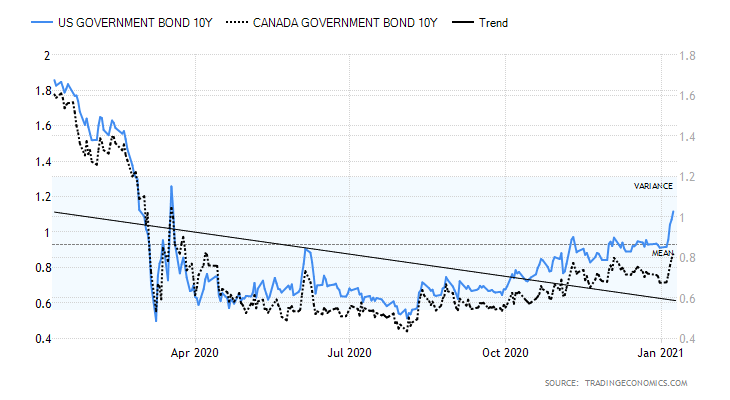
Source: www.tradingeconomics.com
Following a few months of speculation, the U.S. 10-year treasury note finally broke above 1.00%, closing the week at 1.12%. The Canadian Government of Canada 10-year bond (CGB) also rose, gaining 14 bp to 0.82%. Odds now favour a rise to 1.20% and possibly even up to 1.50% where there would be more significant resistance. Some backing and filling would not be surprising. Yields are rising on inflation expectations due to the weak U.S. dollar. As well, despite the drop in the nonfarm payrolls this past week, other economic indicators have been somewhat more positive, particularly in manufacturing. The Markit Manufacturing PMI came in at 57.1 when they expected a reading of 56; the New York ISM was 61.3, far above the 44.2 recorded in November and above expectations of 48.5; ISM Manufacturing prices were 77.6 well above November’s 65.4 and expectations of 56.4; the Markit Composite PMI was 55.3, about as expected; new car sales were unexpectedly robust in December at 16.3 million units; initial jobless claims were a bit lower than expected at 787 thousand vs. an expectation of 800 thousand; and consumer credit jumped unexpectedly to $15.27 billion in November, well above October’s $4.54 billion a forecast of $9 billion. So, the drop in the nonfarm payrolls might have been considered a blip rather than the start of something new. All that weighed on treasuries which took the path of least resistance and rose (prices that move inversely to yields fell). Treasuries, as with so much else, largely ignored the goings-on in Washington.
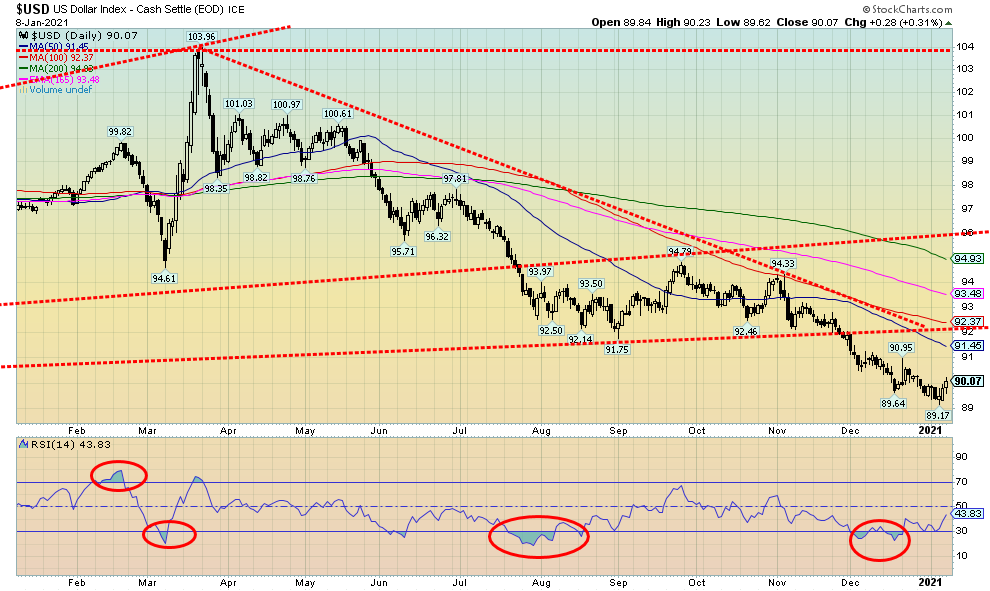
Source: www.stockcharts.com
The US$ Index put in a reversal week as we saw new 52-week lows at 89.17 and then a positive close at 90.07 as the US$ Index gained 0.2% on the week. It was a reversal week, not a key reversal week. So, while of significance, it is not a signal to us that the decline in the US$ is over. The bear trade in the US$ had become quite overcrowded so a potential rebound was most likely going to happen. This past week the euro fell 0.2%, the Canadian dollar was up 0.5%, but the pound sterling was down 0.8%, the Swiss franc was off 0.2%, and the Japanese yen dropped 0.7%. The Cdn$, the euro, the Swiss franc, and the Japanese yen all saw fresh 52-week highs. Given the good reversal week for the US$ Index, our expectations are for higher prices. Potential is up to resistance near 91.50. Above that, level a rise to 92.50 would not be a surprise. A rising US$ Index could weigh on gold. A return back under 89.50 would, however, be negative and suggest that new lows lie ahead. Given the high probability of increasing stimulus from the U.S. government, the odds favour an eventual return to the downside. The start of a new year often sees a rebound in the U.S. dollar.
Source: www.stockcharts.com
Ouch! While stock markets continue to hit record highs, the precious metals market took it on the chin this past week. Gold fell 3.2%, including a nasty 4.1% drop on Friday. Silver was off 6.7% on the week, and platinum was down 0.7% (held in, all things considered). Near-precious metals like palladium dropped 3.6% but copper once again defied everybody, rising 4.3%. We note that copper and gold usually go in the same direction together. The gold stocks also held with both the TSX Gold Index (TGD) and the Gold Bugs Index (HUI) up 1.9% and 1.0% respectively.
So, what happened? Well, technical points were triggered in the futures market when gold fell back under $1,900. Treasury yields, as represented by the U.S. 10-year treasury note, rose to over 1.0% for the first time in months thus taking some shine off gold as a safe-haven; the U.S. dollar rebounded as the overcrowded bear trade in the US$ reversed and the US$ Index closed back over 90; there were hopes for the economy despite the drop in nonfarm payrolls on Friday; and, some say Bitcoin is becoming a significant competitor as it soars into the stratosphere. Bitcoin? A virtual currency vs. gold a real currency? Anyway. As to the action on the week at Capital Hill, gold like the stock market effectively yawned.
The selling was all in the futures market. This wasn’t holders of real gold unloading. It was driven by the huge short position from the commercial players (banks, dealers, etc.) whose short COT positions have been well noted. Will we see significant covering in next week’s COT report? That remains to be seen.
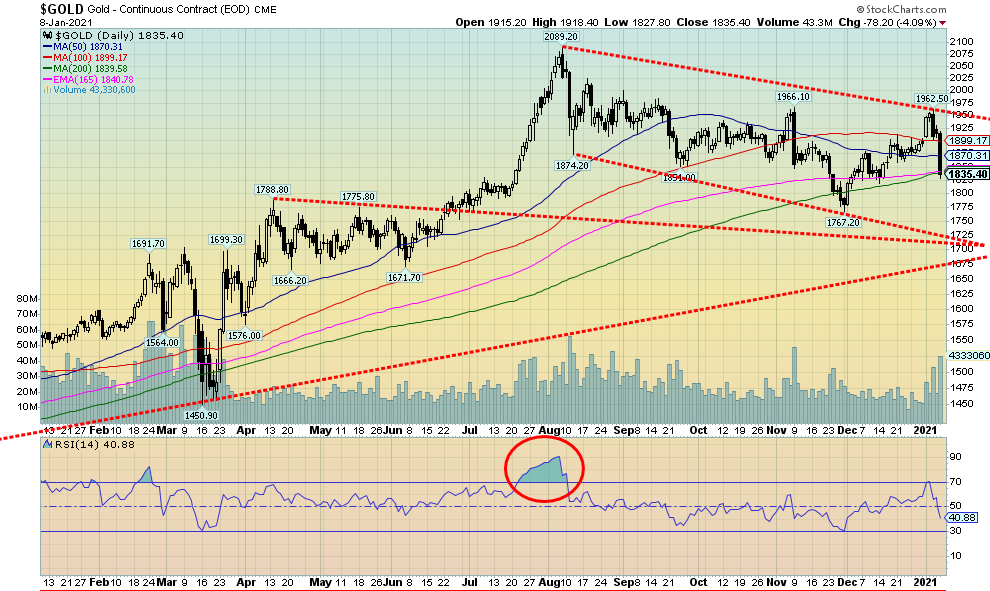
Gold hit a recent high of $1,962.50, nicely forming a nice bear channel down from the high seen in August at $2,089. Gold closed the week on the 200-day MA. Will it hold? Friday at one point saw gold down a good $100. The seemingly false breakout to the $1,962 high reminded us a little of the fake breakout way back in 2012 before the debacle of April 2013. Can gold fall sharply again? The answer, of course, is yes. We have noted that we are in the period where we are looking for our 31.3-month cycle low. We thought we might have made it on November 30 at $1,767. The potential for that low was actually centered around April 2021 so it is possible that was not our cycle low. Seasonally, we should be rising now and the runup over the past month seemed to fit the seasonals. Failure to follow through to the downside on Monday would be positive, but we don’t want to get ahead of ourselves. We were also encouraged that the gold stocks actually managed to register gains this past week and did not collapse with gold and silver. The high seen on Wednesday at $1,962 now becomes important resistance. We had earlier acknowledged that $1,950 was a resistance point and important to close over, so effectively we failed at that zone. Now we have to shift some focus to the downside. There is some interim support at $1,820 but a break below $1,800 would probably signal that the $1,767 low could also fall. The bottom of that channel is down around $1,725 and that could be a legitimate target.
Volume picked up on Friday’s break. There is seemingly little reason for gold to fall, given that continued debt growth, continued QE, and stimulus are almost guaranteed and would be happening no matter who is in power. All we can postulate right now is that our 31.3-month cycle low may not yet be in place. We still believe we are too early for our 7.83 year and 23–25-year cycle lows as we believe they will occur more out into 2023–2024. Lows in January/February are rare, but we have seen them in the past so we can’t rule them out. Key is $1,800 as below that level new lows are highly probable. Regaining $1,900 would be a start in rebuilding the bullish case.
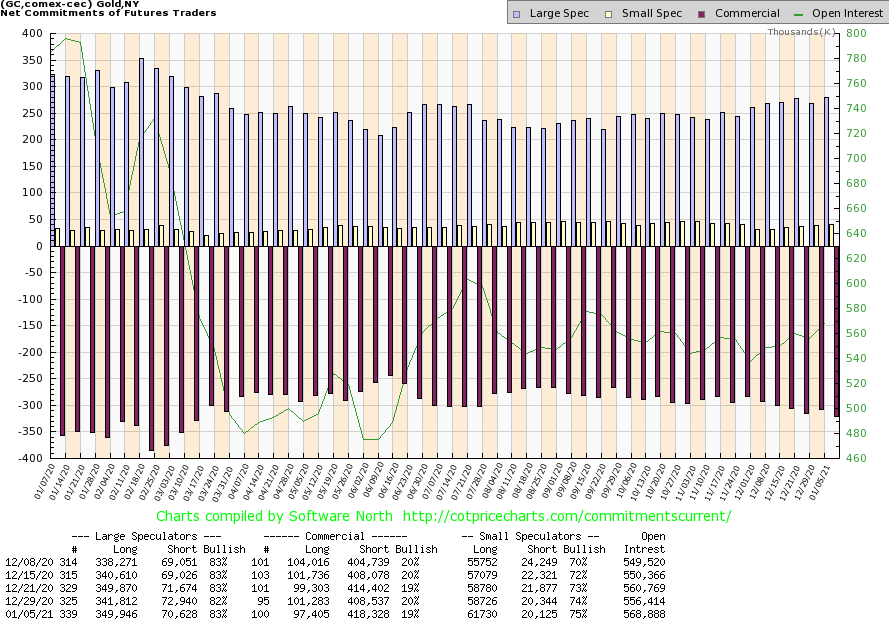
Source: www.cotpricecharts.com
We can’t say that this week’s COT is particularly encouraging. The commercial COT for gold slipped to 19% this past week from 20% the previous week. That’s bearish, although not as bearish as we say last February 2020. But even when gold was turning around during the March madness rout the commercial COT struggled above 30%. Long open interest fell about 4,000 contracts this past week while short open interest rose roughly 10,000 contracts. Open interest rose over 12,000 contracts on a down week confirming the drop. The large speculators COT (hedge funds, managed futures, etc.) rose slightly to 83% from 82%. They even increased their long positions, up roughly 8,000 contracts, while shedding their short open interest, down over 2,000 contracts. Naturally these numbers do not reflect Friday’s sharp drop so we could be encouraged if next week’s COT shows the commercials having covered some shorts into this week’s sharp drop.
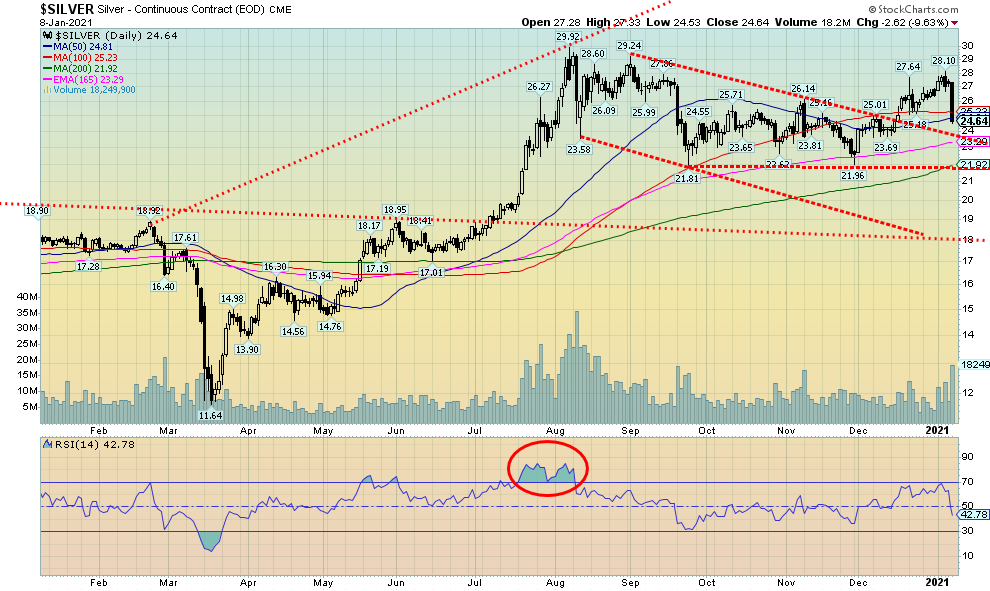
Source: www.stockcharts.com
Silver took it on the chin on Friday along with gold getting clobbered, down $2.62 and falling 9.6% in one day. Ouch! As with gold, it was quite unexpected. Silver finished the week down 6.7%. That’s the bad news. The good news is that silver closed the week on the 50-day MA support near $24.80. As well, it was only a few weeks ago that the 100-day MA crossed above the 50-day MA, giving us an interesting buy signal. The 200-day MA and the 165-day EMA are both still rising. Last February, in front of the March meltdown, silver fell 7.2% on February 28. But we note then the MAs were all pretty flat and converging and silver quickly fell below all of them, closing below the 200-day MA. Yes, there was a small rebound for the next five or six days, and then came the March madness deluge. So, we need to watch what silver does from here. No downside follow-through on Monday would be a start. Silver is going to have resistance up to $26 and again at $27. Above $27 the next time and we should start the move to over $28. If silver has turned bearish then we need to watch $24 then $22. A break of those levels would signal that we are definitely headed lower. The recent lows were at $21.81 and $21.96. Silver is hanging just above the breakout point of the bear channel. So, all this drop might be is a test of the breakout level. The breakout level came in here around Friday’s close at $24.66. If it was a double bottom, potential targets were up to at least $29. So far, we have fallen short of that target. The high on Wednesday was $28.10 and that is now a key level for any bullish case. The drop Friday was nasty. But if there is a failure in follow-through and we can regain back above $26 that would be a start that Friday was nothing more than a nasty little pullback within the context of a new uptrend. But we shouldn’t be complacent because if we do break under $24 then we do have to focus to the downside.
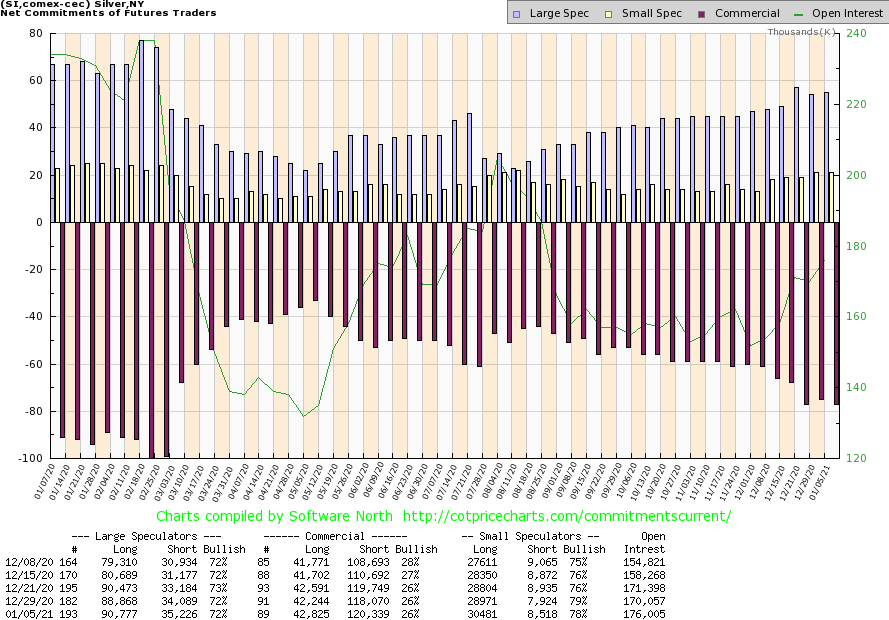
Source: www.cotpricecharts.com
Like the gold COT, the silver commercial COT is not particularly encouraging. For the third successive week the silver commercial COT is stuck at 26%. The best we can say is that it is not as negative as it was back in February 2020. Long open interest rose a small 600 contracts this past week while short open interest was up over 2,000 contracts. The large speculators COT was also steady at 72%. Overall open interest rose roughly 6,000 contracts this past week on what was an up week. We would prefer to see the commercial COT up around 40% which is where it was during the March 2020 meltdown.
Source: www.stockcharts.com
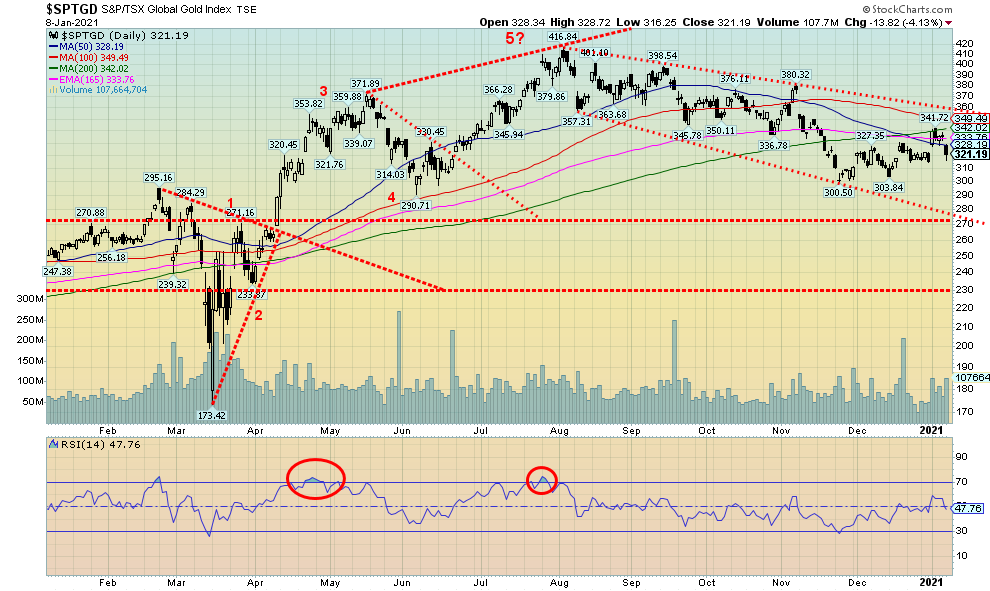
Despite the rather nasty down week for both gold and silver the gold stocks held their ground. The TSX Gold Index (TGD) finished the week up 1.9% while the Gold Bugs Index (HUI) gained about 1.0%. The sentiment indices for gold stocks are pretty neutral here with the Gold Miners Bullish Percent Index (BPGDM) currently at about 52. Naturally, it could go lower before this is done. The TGD has held nicely above its recent lows of 300 and 304. A break of 300 would naturally be negative and a break of 270/280 would be quite negative, signalling the bull market for gold stocks is over. The TGD ran into resistance at 340 so that is an area that needs to be overhauled if we are going higher. The bull market only fully resumes over 360; otherwise, the TGD remains in a down bear channel. We continue to view the current pullback that got underway with the top at 417 in August as a corrective move following the runup from the March 2020 low at 173. A fairly normal correction would see the TGD retrace back to Fibonacci points at 323, 295, and even down to 265. Only below 230 would we say the March 2020 low at 173 is to be challenged. Indicators are fairly neutral here with the RSI at 48. Volumes have not been strong, indicative of the corrective nature of the recent action. It is possible the low at 300 was it for the correction as we can detect a 5-point ABCDE-type pattern traced downward from the August top. Ergo, that’s why holding these lines on any pullback now is important.
Source: www.stockcharts.com
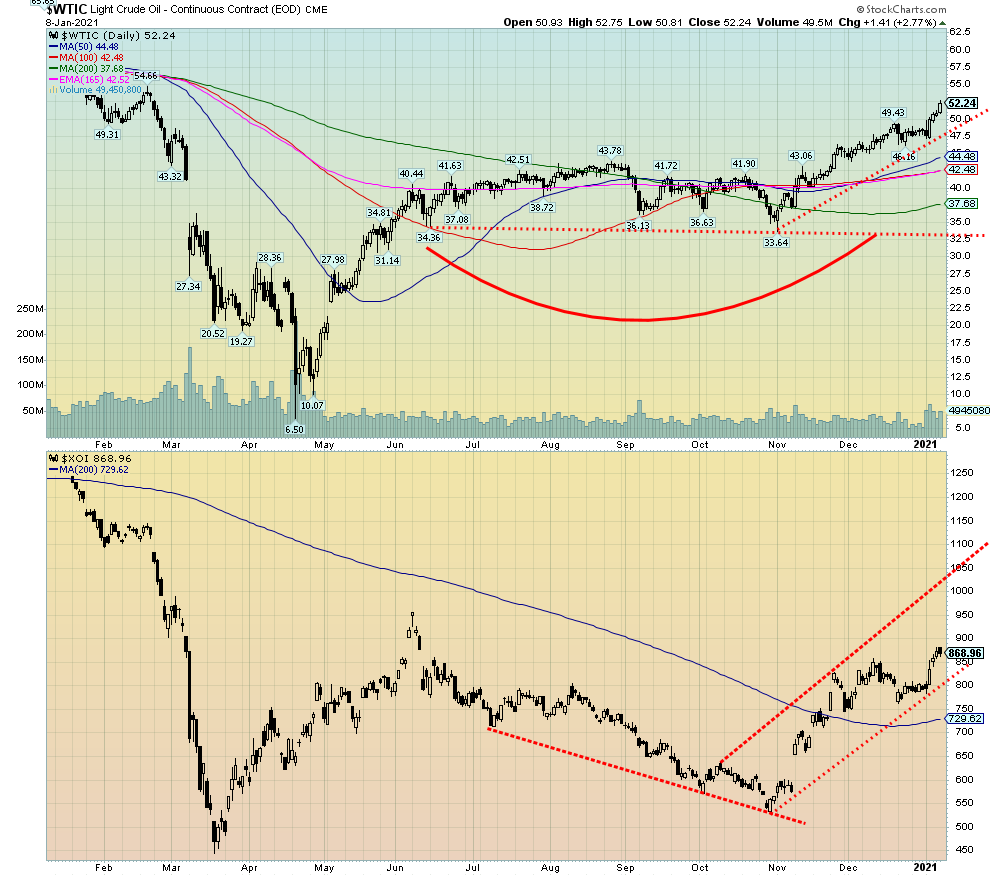
For weeks we mused as to which direction oil prices could take as they traded in a range of roughly between $43 and $36. Yes, it could have gone either way. Corrective waves unfold normally as an ABC-type pattern. And odds did favour that this was B wave up from the major low seen in March 2020. Now we know it was a B wave as we have broken out to the upside once we firmly took out $43. We are now embarking on the C wave. In theory, we could make an argument that technical targets could be as high as $80. This C wave should be at least as long as the A wave up that in theory topped at $43.78 in August. But then that bump to $43.78 may have also been just a part of the B wave. There is further resistance up to $60 and $65. As it turned out, that drop to just under $34 in November was the last gasp of the B wave and the bears.
Markets responded positively to Saudi Arabia’s cuts, even if Russia and others bumped their output somewhat. Helping as well is the coming vaccine and pledges for more fiscal stimulus. An interesting aspect of the year just past was that it was the warmest recorded year on record and, as well, costs to deal with natural disasters more than doubled from the previous year. Hurricanes and wildfires dominated the headlines. Costs for the disasters topped $95 billion in the U.S. Given the Senate wins of the Democrats in Georgia, the odds now favour a more aggressive approach to climate issues going forward. Many things like the opening of the Arctic National Wildlife Refuge are likely to be closed once again. Even recent sales were pitifully low and the state of Alaska itself was the major buyer. Most players wisely took a wait-and-see approach.
This past week WTI oil rose 7.7%. The energy indices did quite well. The ARCA Oil & Gas Index (XOI) rose 9.7% while the TSX Energy Index (TEN) was up 10.1%. Natural gas (NG) also benefitted, gaining 6.3%. A great start to the new year for the energy sector following a miserable 2020. We are in the midst of strong seasonals that can last on and off until around June. That helps. The energy indices and WTI oil are both in nice rising channels with no sign of any topping action. That suggests to us that we should continue higher. There is resistance here at around $54/$56, then up to $60 as well. The XOI might run into some resistance at 900/950. Breakdown levels are at $48 for WTI oil and 800 for the XOI. Numerous individual oil and gas stocks are in uptrends and appear poised to move higher as well.
|
Charts and commentary by David Chapman Chief Strategist, Enriched Investing Inc. Phone: 416-523-5454 Email: david@davidchapman.com dchapman@enrichedinvesting.com Twitter: @Davcha12 January 11, 2021 |
Disclaimer
David Chapman is not a registered advisory service and is not an exempt market dealer (EMD) nor a licensed financial advisor. We do not and cannot give individualised market advice. David Chapman has worked in the financial industry for over 40 years including large financial corporations, banks, and investment dealers. The information in this newsletter is intended only for informational and educational purposes. It should not be considered a solicitation of an offer or sale of any security. The reader assumes all risk when trading in securities and David Chapman advises consulting a licensed professional financial advisor before proceeding with any trade or idea presented in this newsletter. David Chapman may own shares in companies mentioned in this newsletter. We share our ideas and opinions for informational and educational purposes only and expect the reader to perform due diligence before considering a position in any security. That includes consulting with your own licensed professional financial advisor
About the author


Website: https://www.enrichedinvesting.com
Disclaimer: David Chapman is not a registered advisory service and is not an exempt market dealer (EMD) nor a licensed financial advisor. We do not and cannot give individualised market advice. David Chapman has worked in the financial industry for over 40 years including large financial corporations, banks, and investment dealers. The information in this newsletter is intended only for informational and educational purposes. It should not be considered a solicitation of an offer or sale of any security. The reader assumes all risk when trading in securities and David Chapman advises consulting a licensed professional financial advisor before proceeding with any trade or idea presented in this newsletter. David Chapman may own shares in companies mentioned in this newsletter. We share our ideas and opinions for informational and educational purposes only and expect the reader to perform due diligence before considering a position in any security. That includes consulting with your own licensed professional financial advisor.