
“Gold, unlike all other commodities, is a currency…and the major thrust in the demand for gold is not for jewelry. It’s not for anything other than an escape from what is perceived to be a fiat money system, paper money, that seems to be deteriorating.”
—Alan Greenspan, American economist, 13th Chair of the Federal Reserve 1987–2006, private advisor, consulting company Greenspan and Associates LLC, quote from a speech August 23, 2011; b. 1926
“It is a sobering fact that the prominence of central banks in this century has coincided with a general tendency towards more inflation, not less. [I]f the overriding objective is price stability, we did better with the nineteenth-century gold standard and passive central banks, with currency boards, or even with 'free banking.' The truly unique power of a central bank, after all, is the power to create money, and ultimately the power to create is the power to destroy.”
—Paul Volker, American economist, 12th Chair of the Federal Reserve 1979–1987, Chair of President’s Economic Recovery Advisory Board 2009–2011; 1927–2019
“Importantly, in the 1930s, in the Great Depression, the Federal Reserve, despite its mandate, was quite passive and, as a result, financial crisis became very severe, lasted essentially from 1929 to 1933.”
—Ben Bernanke, American economist, 14th Chair of the Federal Reserve 2006–2014, 23rd Chair of the Council of Economic Advisors 2005–2006; b. 1953
The U.S. Federal Reserve Act, which created the central banking system of the U.S., came into being in December 1913. The creation of the Federal Reserve was the culmination of meetings that started in 1910 when the U.S. Senate, led by Republican leader Nelson Aldrich, met with the executives of a number of banks including J.P. Morgan, Rockefeller and Kuhn, Loeb & Co. on Jekyll Island, Georgia. The calls for a central bank intensified following the crash of 1907 when a run began on the Knickerbocker Trust Co., one of the largest banks in the U.S. at the time, which led to a severe monetary contraction and recession. The 1907 crash came following a series of panics and crashes seen in 1893, 1896, 1901, 1903, and one that came after in 1910. All resulted in recessions of varying degrees.
The U.S. Federal Reserve was patterned after European central banks that had been in existence since 1668 when the Swedish Riksbank was found. Many other European countries followed. The Bank of England came into being in 1694. Canada’s Bank of Canada by comparison is a “Johnny come lately” formed by the Bank of Canada Act in 1934. The Federal Reserve wasn’t even the U.S.’s first central bank. The U.S. had two central banks in the 19th century: first, the Bank of the United States 1791–1811 and then the second Bank of the United States 1816–1936. A national banking system was created during the U.S. Civil War 1861–1865. But it was the Panic of 1907 that broke the camel’s back. Up until then J.P. Morgan had acted like a central bank, bailing out the financial system.
The Fed is an agency of the U.S. government and reports to Congress. The U.S. government holds 20% of the stock in the Federal Reserve with the remaining 80% held by private banks who are members of the Federal Reserve system. The stock pays dividends but cannot be sold—it is permanent capital—nor can it be pledged for loans, nor do the stockholders have any say in the policy-making decisions of the Fed. The private banks do not have any financial control of the Fed. The President appoints the Fed Chair. The government elects three of the nine governors while the member banks elect the remaining six. All have to be confirmed by the Senate.
The Fed’s main objectives are maximizing employment, stabilizing prices, and moderating long-term interest rates. One could also say the Fed’s role is to help deal with financial panics and economic crisis. After all, it was a series of financial panics that sparked the creation of the Fed. The Fed has played a role in all financial and economic crises since 1913. It has also been criticized for its handling of these crises, from not doing enough during the Great Depression to doing too much out of the Great Recession. Many have called to abolish the Fed. Criticisms have centered around the lack of transparency and that they are not sufficiently audited. Many have accused the Fed of being behind the current inflation, pumping too much money into the financial system through QE, holding interest rates down for too long and, of course, not acting fast enough to hike interest rates to tame inflation or pay down its bloated balance sheet.
The Fed’s balance sheet has seen incredible growth since the 2008 financial crisis. In August 2008 the Fed’s balance sheet totaled $910 billion. Today it is $8,942 billion an 883% increase.
The Fed’s Balance Sheet 2003–2022
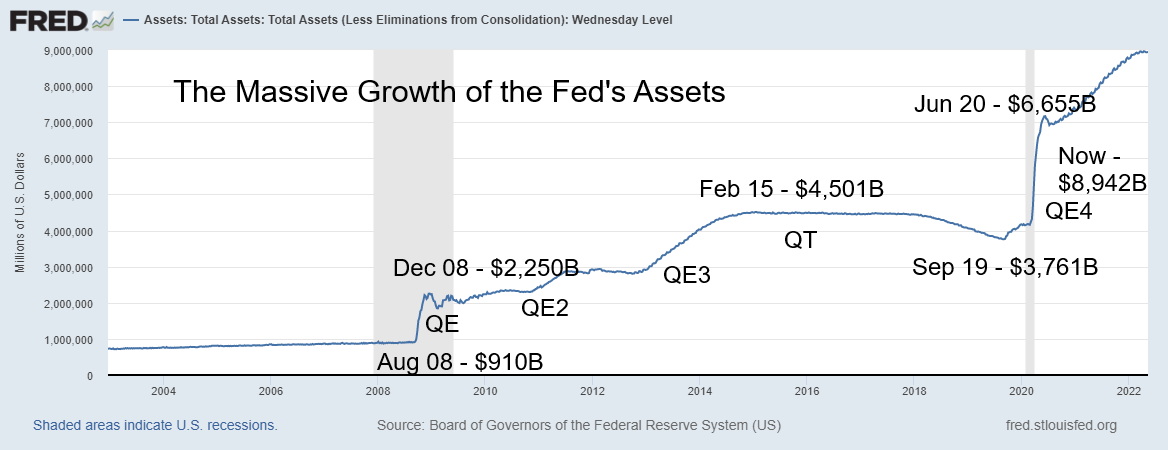
Source: www.stlouisfed.org
The Fed’s balance sheet growth has been nothing but phenomenal. But it hasn’t just been all U.S. treasury securities. Since the financial crisis of 2008 the Fed has grown its balance sheet, first through QE1, then QE2, and then QE3, followed by a period of QT when they ran off their balance sheet. Then, in response to the pandemic of 2020, the Fed followed with QE4, giving us the most explosive growth ever seen.
But the growth was uneven. U.S. treasury holdings of course went up from $480 billion in August 2008 to $5,764 billion today, an increase of 1,100%. However, their purchases of mortgage-backed securities (MBS) exploded from none in August 2008 to $2,715 billion today. What that tells us is a very high number of U.S. mortgages are now held by the Fed. Now the Fed wants to shrink its balance sheet along with hiking interest rates. The plan is $95 billion a month $1,140 billion per year. Of that, $60 billion/month is U.S. treasuries and $35 billion is MBS. The latter could be a major problem. When you are now one of the largest mortgage holders in the country, how do you unload all those mortgages onto someone else without potentially causing dislocations?
The Fed’s Holdings of Securities 2008–2022
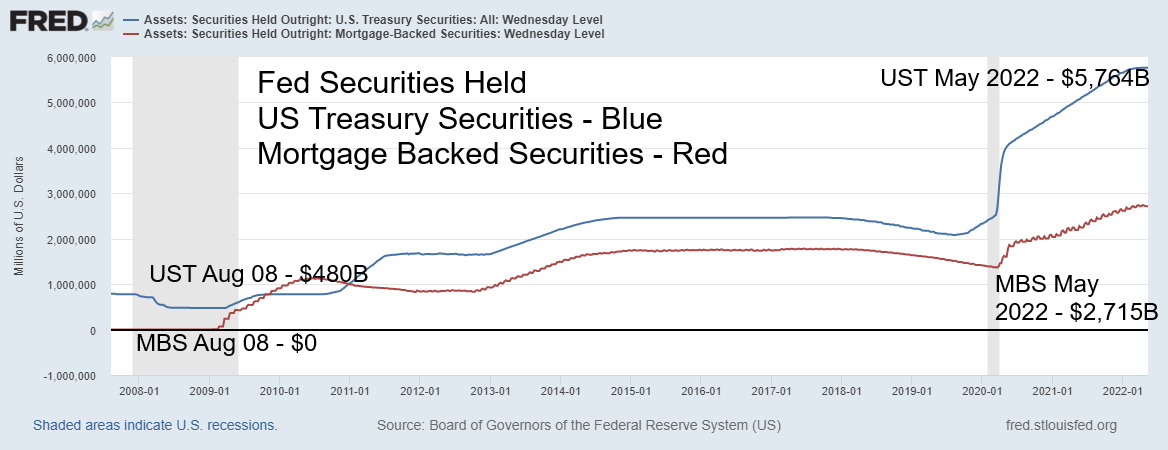
Source: www.stlouisfed.org
Well, it is tricky, as a recent article in Axios states (https://www.axios.com/2022/05/18/fed-mortgage-portfolio).
With interest rates rising and housing prices starting to wobble, mortgages may remain with the Fed much longer than the Fed wants. And if the Fed does try to sell these MBSs on the open market, where will the bids be? Much lower, we suspect. Could the Fed experience losses on its portfolio? Selling the portfolio, or at least some of it, could also push up mortgage interest rates, thus inadvertently fueling a drop in housing prices.
If the Fed’s balance sheet has exploded during the pandemic, money supply has also exploded to the upside. They say that inflation is a monetary phenomenon and with the explosion in money supply, particularly M1, money has been doled out all over. In August 2008 M1 stood at $1.4 trillion, M2 at $7.7 trillion, and commercial and industrial loans at banks $1.5 trillion. Fast forward to today and M1 is $20.7 trillion up $19.3 trillion since 2008, a phenomenal 1,380% leap. M2 is at $21.8 trillion, an increase of 183% while commercial and industrial loans are at $2.5 trillion, a mere 67% increase since 2008. Commercial and industrial loans are not the problem as they have actually fallen since 2020. M2 is not the problem as its growth has been stingy compared to M1.
So where did all the money come from for M1? Well, a $2.2 trillion “Cares” package signed by President Donald Trump in March 2020 to combat the pandemic and another $1.9 trillion package signed by President
Joe Biden in January 2021 are touted as the main culprits. All that money found its way into the hands of Americans who deposited their cheques into their chequing account (M1). Then when they felt right about it, they started spending it. The trouble was, by that time the sudden surge in demand couldn’t keep up with the supply that was severely disrupted as a result of the pandemic. Add in the war and more and suddenly there is a problem with rising inflation, sparked by a sharp increase in demand and disrupted supply.
Growth of M1, M2, and Commercial & Industrial Loans – 2007–2022
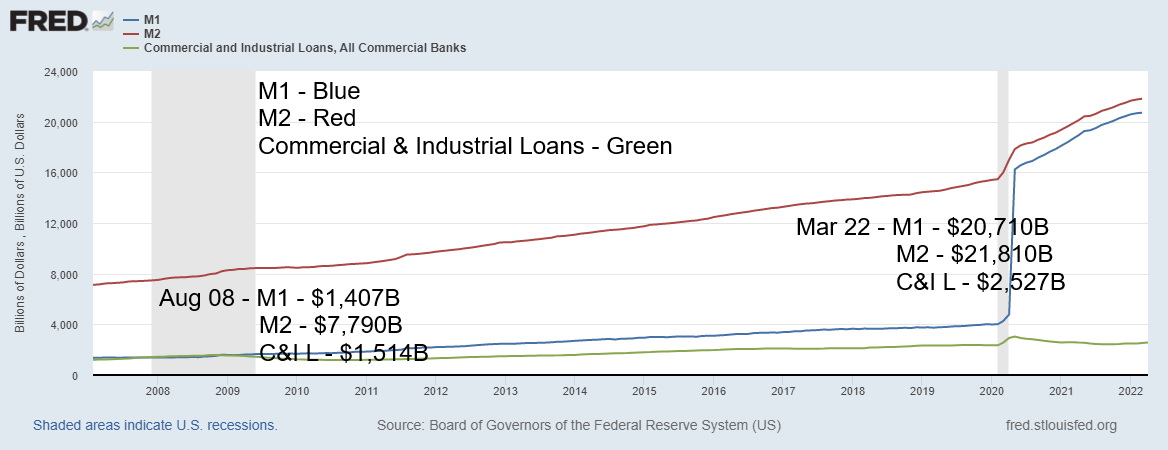
Source: www.stlouisfed.org
Add in the overall growth of loans with the national federal debt up over $20 trillion since 2008 or about 200%, and total U.S. debt (all government debt, corporate debt - financial and non-financial, consumer) up over $40 trillion or 80%, and you have had an explosion of debt and money since the 2008 financial crisis and particularly since the onset of the pandemic in March 2020.
Not all that money went into investment as corporations spent a lot of their funds on share buybacks, thus helping the rise in the stock market. It is noteworthy that the S&P 500 at its January 2022 peak was up 623% from its March 2009 low. It is still up about 490%. Nor did all the money that the Fed poured into the market through three and now four rounds of QE wind up in the market. Much of it came right back in the form of bank reserves.
Our chart below shows how reserve balances have grown at Federal Reserve banks. In 2008 reserves stood at $13.2 billion. Today they are at $3.3 trillion, down from the peak of $4.3 trillion. It appears as if the banks are withdrawing their reserve balances. Do they need the funds to cover something else? Is there potential for growing loan losses?
We’ve said before the Fed is caught between a rock and hard place. They are planning on hiking interest rates probably another 50 bp in June and another 50 bp in July. Yet they have to get up to at least 3%–3.5% from the current 1% to potentially have any impact on the inflation rate. And that risks tipping the economy into a recession, which in turn would help bring down the inflation rate as loan losses and unemployment grow. The war, the supply disruptions sparked by the war, the pandemic, a China slowdown, and a growing food crisis are all things that the Fed cannot control. But interest rate hikes, monetary tightening (QT), and the potential for monetary growth to turn negative all could come flying back in the face of the Fed creating another crisis.
The Fed has faced criticisms in the past. Many believe they helped exacerbate the Great Depression by tightening rather then loosening. Many believe that the Fed helped spark the tech boom of the 1990s, the housing boom of the 2000s, and the everything boom of the 2010s with its loose monetary policy, ultra-low interest rates, and QE, all of which went on too long. The response since the pandemic has been another round of ultra-low interest rates and massive amounts of QE. Unemployment kept falling to multi-year lows. Then inflation started to rise due to disrupted supply and the war coupled with increased demand.
But the Fed sat on its hands. As they say, this put the Fed “badly behind the curve.” Yes, their response after the financial crisis of 2008 and the pandemic helped keep the economy from potentially falling into a depression, but it also has set the stage for the next crisis. The question is, how many crises can the Fed and other central banks bail out? Now they risk overshooting, which could cause a financial accident and spark another crisis and recession.
The Fed was born out of a series of financial crises. Could another series of financial crises bring down the Fed?
Reserve Balances Federal Reserve 2003–2022
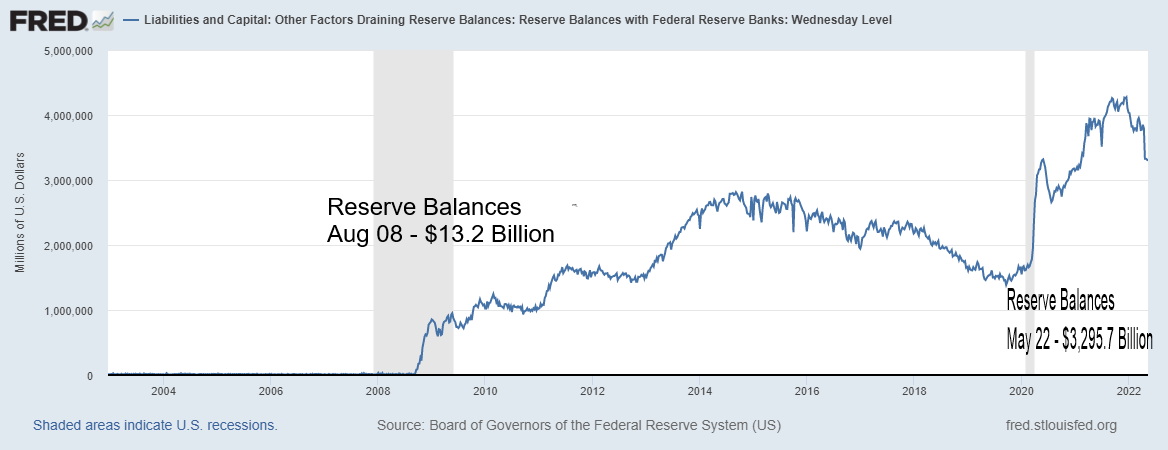
Source: www.stlouisfed.org
Chart of the Week
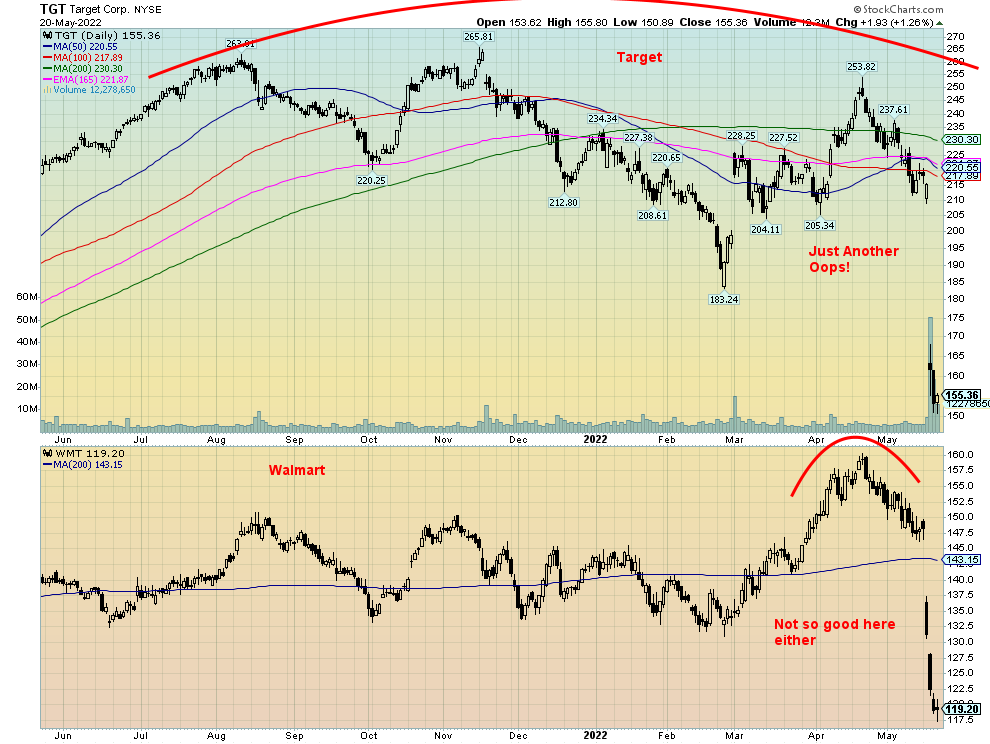
Source: www.stockcharts.com
Walmart (WMT) and Target (TGT) looking like cryptos? That’s what it seems. Both retailers said they missed earnings targets even if revenues were up (https://www.forbes.com/sites/sanfordstein/2022/05/18/walmart-and-target-miss-quarterly-estimates-dramatically/?sh=e8fb7f460591).
There is not a lot to say here, but despite recommendations from well-known CNBC analyst Jim Cramer to buy both of them, the suggestion here is you don’t buy a falling knife. It might go right through you. You wait until they settle down and then if things look better one can look at them. But more often than not a consolidation following a big gap down like this is nothing more than a bear consolidation before they fall further. The question that begs is that if big retailers like Target and Walmart are collapsing like this, what is the message for the economy? Most likely it is another sign that we are headed for a recession—and probably not your garden variety recession, either.
Markets & Trends
|
|
|
|
% Gains (Losses) Trends
|
|
||||
|
|
Close Dec 31/21 |
Close May 20/22 |
Week |
YTD |
Daily (Short Term) |
Weekly (Intermediate) |
Monthly (Long Term) |
|
|
Stock Market Indices |
|
|
|
|
|
|
|
|
|
S&P 500 |
4,766.18 |
3,901.36 (new lows) |
(3.1)% |
(18.1)% |
down |
down |
up (weak) |
|
|
Dow Jones Industrials |
36,333.30 |
31,261.90 (new lows) |
(2.9% |
(14.0)% |
down |
down |
up (weak) |
|
|
Dow Jones Transports |
16,478.26 |
13,490.97 (new lows) |
(6.7)% |
(18.1)% |
down |
down |
up |
|
|
NASDAQ |
15,644.97 |
11,354.62 (new lows) |
(3.8)% |
(27.4)% |
down |
down |
neutral |
|
|
S&P/TSX Composite |
21,222.84 |
20,197.61 |
0.5% |
(4.8)% |
down |
down |
up |
|
|
S&P/TSX Venture (CDNX) |
939.18 |
702.09 |
0.8% |
(25.2)% |
down |
down |
neutral |
|
|
S&P 600 |
1,401.71 |
1,171.99 (new lows) |
(1.5)% |
(16.4)% |
down |
down |
up (weak) |
|
|
MSCI World Index |
2,354.17 |
2,000.84 |
2.7% |
(15.0)% |
down |
down |
neutral |
|
|
NYSE Bitcoin Index |
47,907.71 |
29,807.44 |
(3.3)% |
(37.8)% |
down |
down |
up (weak) |
|
|
|
|
|
|
|
|
|
|
|
|
Gold Mining Stock Indices |
|
|
|
|
|
|
|
|
|
Gold Bugs Index (HUI) |
258.87 |
256.28 |
3.5% |
(1.0)% |
down |
down (weak) |
neutral |
|
|
TSX Gold Index (TGD) |
292.16 |
301.44 |
2.7% |
3.2% |
down |
neutral |
up (weak) |
|
|
|
|
|
|
|
|
|
|
|
|
Fixed Income Yields/Spreads |
|
|
|
|
|
|
|
|
|
U.S. 10-Year Treasury Bond yield |
1.52% |
2.79% |
(4.5)% |
83.6% |
|
|
|
|
|
Cdn. 10-Year Bond CGB yield |
1.43% |
2.84% |
(4.1)% |
98.6% |
|
|
|
|
|
Recession Watch Spreads |
|
|
|
|
|
|
|
|
|
U.S. 2-year 10-year Treasury spread |
0.79% |
0.20% |
(41.2)% |
(74.7)% |
|
|
|
|
|
Cdn 2-year 10-year CGB spread |
0.48% |
0.20% |
(31.0)% |
(58.3)% |
|
|
|
|
|
|
|
|
|
|
|
|
|
|
|
Currencies |
|
|
|
|
|
|
|
|
|
US$ Index |
95.59 |
103.17 |
(1.4)% |
7.9% |
up |
up |
up |
|
|
Canadian $ |
.7905 |
0.7781 |
0.6% |
(1.6)% |
down |
down |
neutral |
|
|
Euro |
113.74 |
104.01 |
1.5% |
(7.2)% |
down |
down |
down |
|
|
Swiss Franc |
109.77 |
102.56 |
2.9% |
(6.6)% |
down |
down |
down |
|
|
British Pound |
135.45 |
124.88 |
2.0% |
(7.8)% |
down |
down |
down |
|
|
Japanese Yen |
86.85 |
78.20 |
1.1% |
(10.0)% |
down |
down |
down |
|
|
|
|
|
|
|
|
|
|
|
|
|
|
|
|
|
|
|
|
|
|
Precious Metals |
|
|
|
|
|
|
|
|
|
Gold |
1,828.60 |
1,842.10 |
1.9% |
0.7% |
down |
neutral |
up |
|
|
Silver |
23.35 |
21.67 |
3.2% |
(7.2)% |
down |
down |
neutral |
|
|
Platinum |
966.20 |
941.10 |
1.1% |
(2.6)% |
down |
down |
neutral |
|
|
|
|
|
|
|
|
|
|
|
|
Base Metals |
|
|
|
|
|
|
|
|
|
Palladium |
1,912.10 |
1,939.70 |
1.2% |
0.3% |
down |
down |
neutral |
|
|
Copper |
4.46 |
4.275 |
2.3% |
(4.2)% |
down |
down |
up |
|
|
|
|
|
|
|
|
|
|
|
|
Energy |
|
|
|
|
|
|
|
|
|
WTI Oil |
75.21 |
110.28 |
(0.2)% |
46.6% |
up |
up |
up |
|
|
Natural Gas |
3.73 |
8.08 |
5.5% |
116.6% |
up |
up |
up |
|
Source: www.stockcharts.com
Note: For an explanation of the trends, see the glossary at the end of this article.
New highs/lows refer to new 52-week highs/lows and, in some cases, all-time highs.
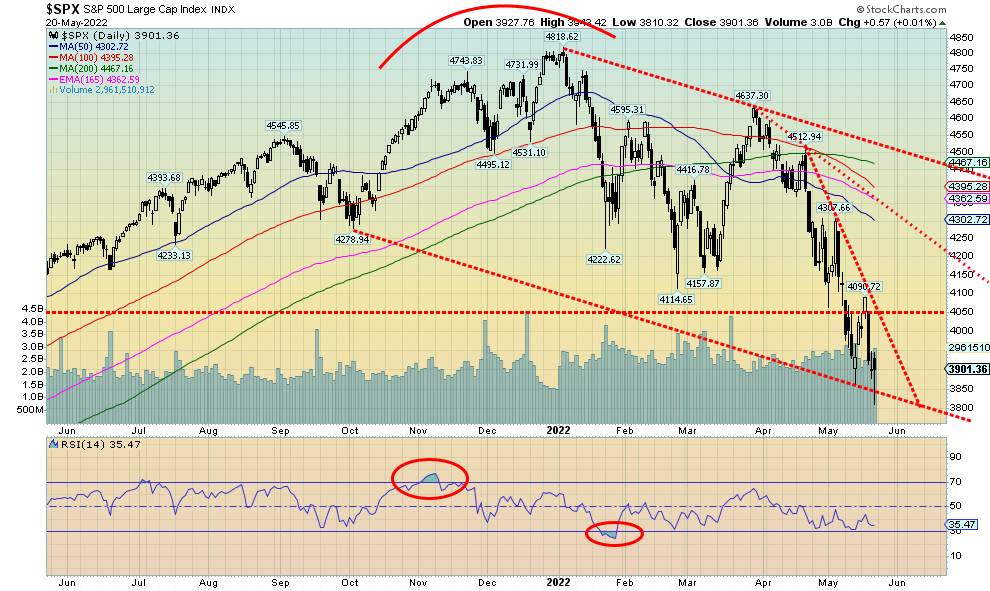
Source: www.stockcharts.com
The bear keeps biting. But, as we note below, we’re seeing signs that we may be in the process of making at least a temporary bottom. Naturally that is not confirmed as of yet. The S&P 500, along with the other major indices, plunged to 52-week lows this past week. A sea of red ink. The S&P 500 fell 3.1%, the Dow Jones Industrials (DJI) was off 2.9%, the Dow Jones Transportations (DJT) was hammered, down 6.7%, joining the others making fresh 52-week lows, and the NASDAQ fell 3.8%. The small cap S&P 600 dropped 1.5%, also to new 52-week lows. The S&P 400 Mid-Cap fell 1.9%, but noticeably did not make new 52-week lows. The Russell 1000 fell 2.9%, the Russel 2000 (small cap) was down 2.0% but did not make new lows, while the Russel 3000 dropped 2.8%. The really broad Wilshire 5000, down 3.0% and making 52-week lows, is quite oversold. All appear to be poised for a rally. Bitcoin continued its woes, losing 3.3%, but did not make new 52-week lows.
Canada bucked the trend as the TSX Composite rose 0.5% and the TSX Venture Exchange (CDNX) was up 0.8%. Things weren’t much rosier in the EU; however, some fears eased about embargoing Russia’s oil and gas. The London FTSE fell 0.4%, but the Paris CAC 40 was down 1.3% and the German DAX dropped 0.3%. What’s key is that none of them made fresh 52-week lows. In Asia, China’s Shanghai Index (SSEC) was up 2.0% and Japan’s Tokyo Nikkei Dow (TKN) gained 1.2%. The MSCI World Index gained 2.7%.
Friday’s action saw quite the rebound after plunging to new lows. The DJI, DJT, and S&P 500 finished with a small gain. The NASDAQ fell just short. It left what we call a long Japanese candlestick doji on the charts, signaling at least a potential pause for the markets. Naturally, we need evidence or confirmation. That could
come with a close for the S&P 500 over 4,050, sparking a rally to the next resistance zone up around 4,300/4,350. However, the S&P 500 needs to break out over 4,500 to suggest further gains. Above 4,600, new highs are possible. If we have completed an ABC pattern down, we should then get an ABC-type correction that takes us into the summer for another top. New highs could not be ruled out. All this is currently conditional on not making new lows below 3,800 or we could be seeing even lower prices. At the recent low the S&P 500 had entered official bear territory but it didn’t hold.
We believe a longer bear market is just getting underway. It has now been over four months since our all-time high. Many indices and individual stocks are already in bear markets. The reasons that put us there are not going away anytime soon: supply disruptions, inflation, the Fed hiking interest rates, an ongoing war that has only solutions that no one wants to agree to and sanctions that would stay regardless of whether the war ended. Bear markets tend to last at least two years. Some good examples are 2007–2009, 2000–2002, 1973–1974 (almost 1975), 1980–1982, and 1929–1932. One of the longest was the 1937–1942 bear market that we discussed last week. It’s been 13 years up. A good run not unlike the 1990–2000 run. Major Fibonacci correction points for the S&P 500 for the entire move from March 2009 to January 2022 are 23.6% - 3,838 (achieved), 38.2% - 3,232, 50% - 2,742, 61.8% - 2,252. Could they be achieved?
If there was a problem from the action this past week, it is we do not yet appear to have what we would call capitulation. But that doesn’t necessarily have to happen at this time. That could wait until the next significant decline. But first we may get ourselves a tradeable rally. However, heed the points we need to break. And no new lows.
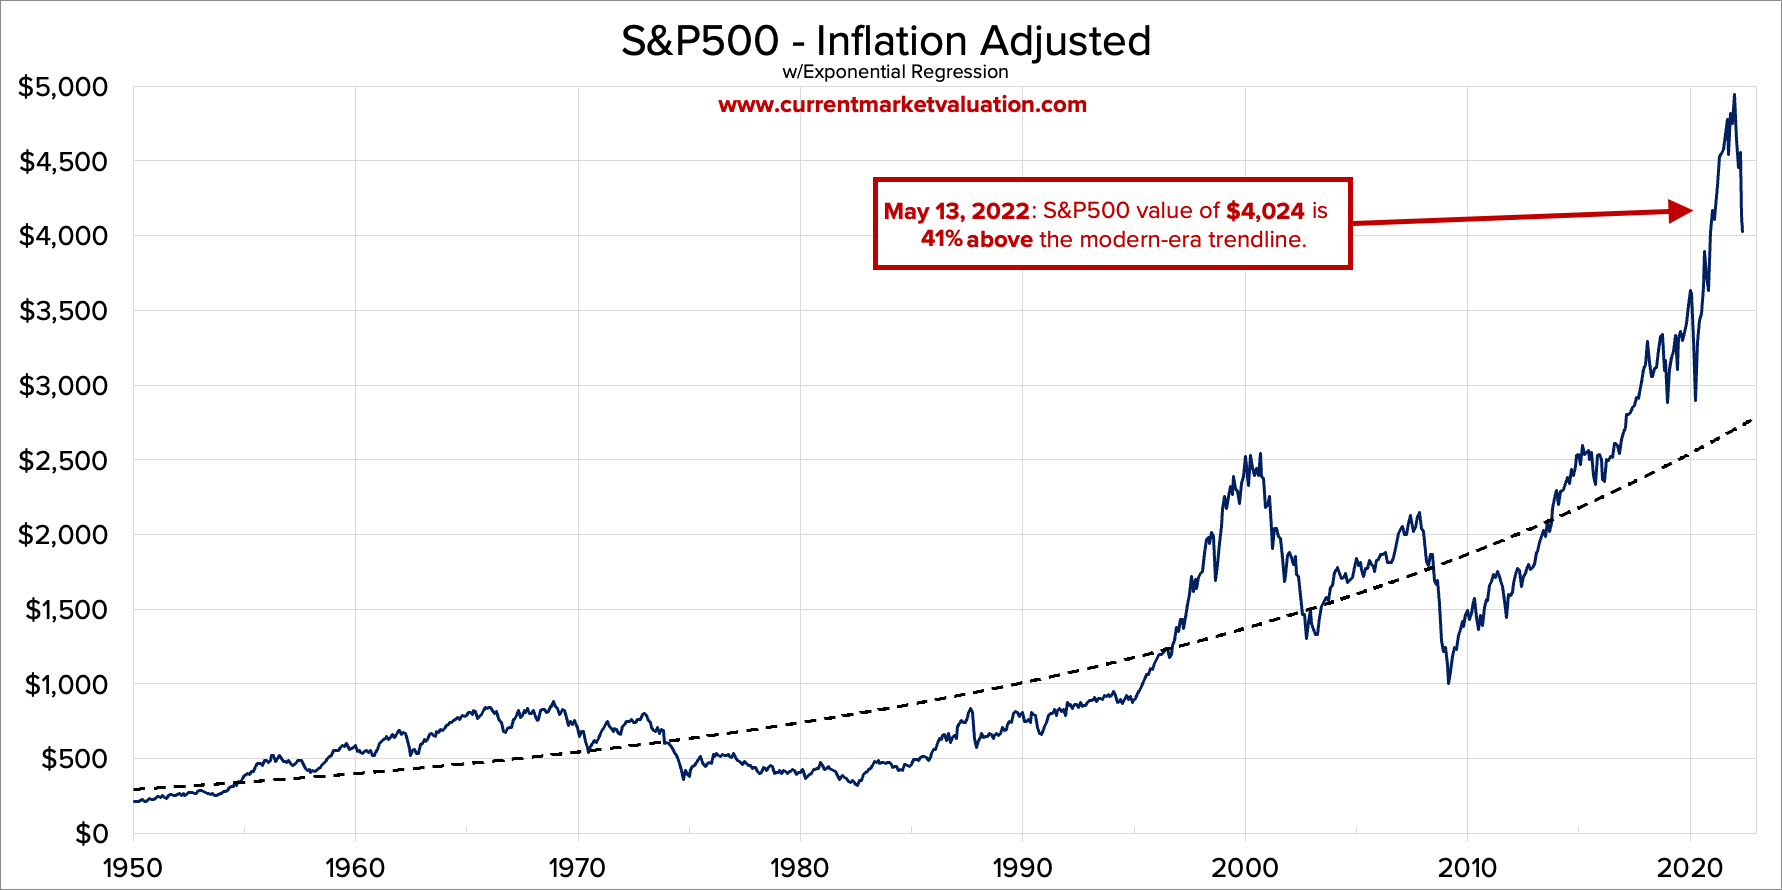
Source: www.currentmarketvaluation.com
There is an old saying that everything reverts to the mean. If that is the case, then the stock market that started a correction from the top on January 4, 2022 has a way to go. According to this model, the S&P 500 was some 41% above its modern-era trendline or in this case its mean reversion line on May 13, 2022. Not much has changed since.
An exponential regression line sounds complicated, unless, of course, you understand the math behind it. But in more simplistic terms, think of the mean reversion line as a complex calculation to find the long-term trend average. Or think of it as taking all the observations of the S&P 500 and calculating an average and you have, with more complex calculations, a more sophisticated average line for the S&P 500.
When it gets a way out of whack from the mean reversion line, the market corrects to bring it back in line with the long-term average mean. So, a period of being well above the mean reversion line may be followed by an extended period below the mean reversion line. Note how the S&P 500 traded below the mean reversion for most of the 1970s, 1980s, and even the 1990s before taking off. The peak, of course, was in 2000 and at that point the S&P 500 was well above its mean reversion line by roughly 66%. A correction was on the horizon, just as it is now.
With a mean reversion line currently around 2,850, the S&P 500 would appear to have a considerable drop ahead for a period of years. The 2000 top as an example dropped below the mean reversion line, first briefly, then once again during the 2008 financial crisis. It remained below the line until about 2015 before it took off once again.
All of this is in the category of “history tends to repeat itself and everything reverts to the mean.” However, none of this precludes a temporary low and rally into the summer before another significant drop gets underway in the fall.
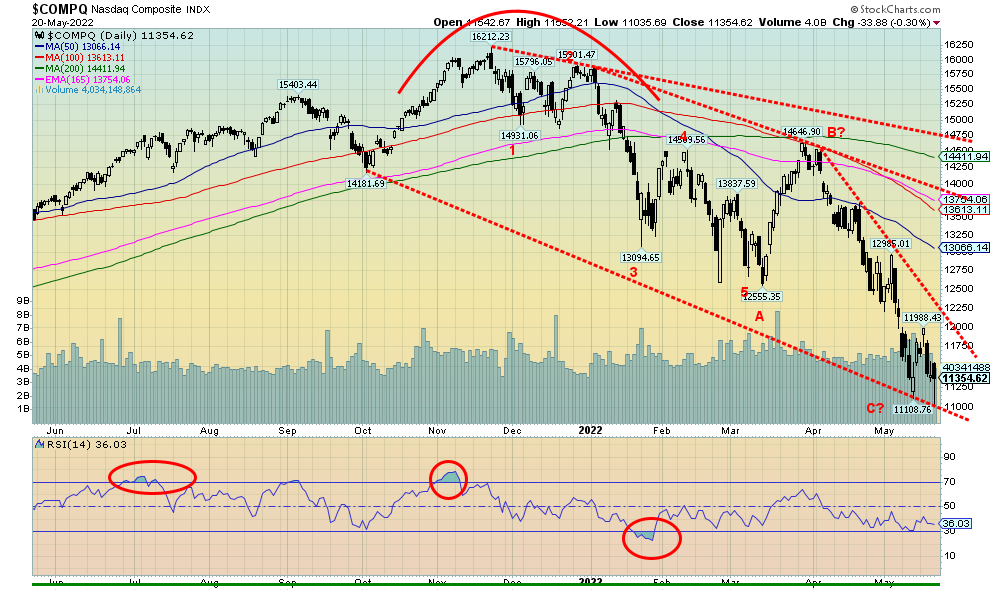
Source: www.stockcharts.com
The NASDAQ, officially in bear market territory, fell further this past week, down 3.8% to new 52-week lows. On the year the NASDAQ is down 27.4% and down 30.0% from that November 2021 high. Numerous NASDAQ stocks are also flashing bear market. Of the FAANGs which are components of the NASDAQ, Meta (Facebook) is down 42.5% in 2022, Apple is down 22.4%, Amazon down 35.5%, Netflix (the big loser) down 69.1%, Google off 24.4%, Microsoft down 24.9%, Tesla down 37.2%, Alibaba off 27.0%, and Nvidia down 43.2%. Only Twitter and Baidu so far are hanging above 20% down on the year. Seems the NASDAQ is following Bitcoin into the cellar as it is off 37.8% so far in 2022 and down 57.2% from its all-time high seen in November 2021. The NASDAQ needs to break above 12,250 to suggest that a low might be in.
Source: www.stockcharts.com
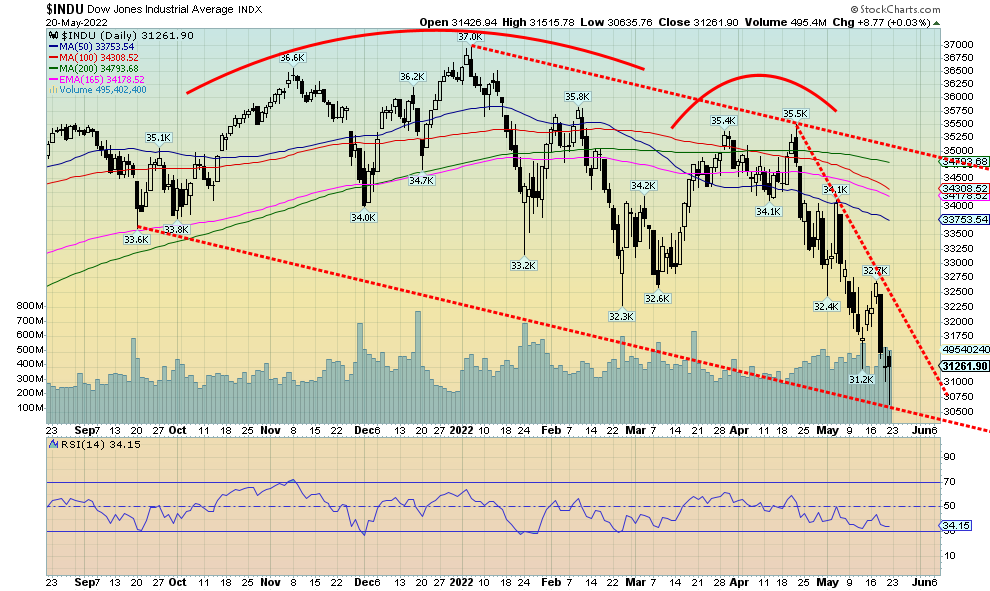
The Dow Jones Industrials (DJI) plunged to new 52-week lows this past week as it lost 2.9%, and is now down about 14% on the year. The Dow Jones Transportations (DJT) plunged 6.7% also to new 52-week lows, thus confirming with the DJI. According to Dow Theory the indices are agreeing with each other, thus confirming the move to the downside. While we have suspicions that a temporary low is being formed, we do not believe we are making a major low. If that were the case the DJI and DJT would be diverging with each other. The DJI breaks out above 32,250. The DJI may have completed five waves down from the April high near 35,500, thus completing what may be C wave down from the all-time high near 37,000 on January 4, 2022. For the record, the DJI just completed eight consecutive weeks of declines. The only time in history that happened before was in 1923, some 99 years ago from March 30, 1923 to May 18, 1923. The coincidence of dates is odd as well. Could it be meaningful?
Source: www.stockcharts.com
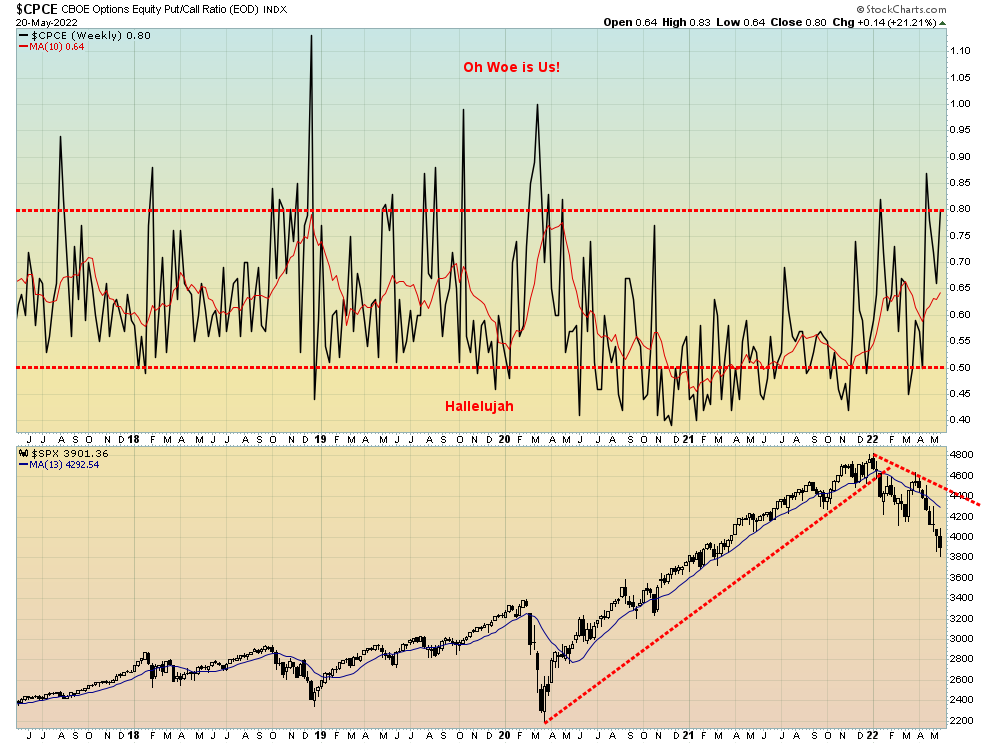
The CBOE put/call ratio surged once again to 80 this past week. Frankly, we would have preferred it stay above 80 but, in the interim, we’ll take what we get. No, it doesn’t mean a low is in but a put/call ratio over 80 is a potential sign that a low may be forming. For the record, other sentiment indicators like the All-Bears Index and the All-Bulls Index are making lower highs and higher lows also diverging with the S&P 500. Another potential sign of a low in the market.
Source: www.stockcharts.com
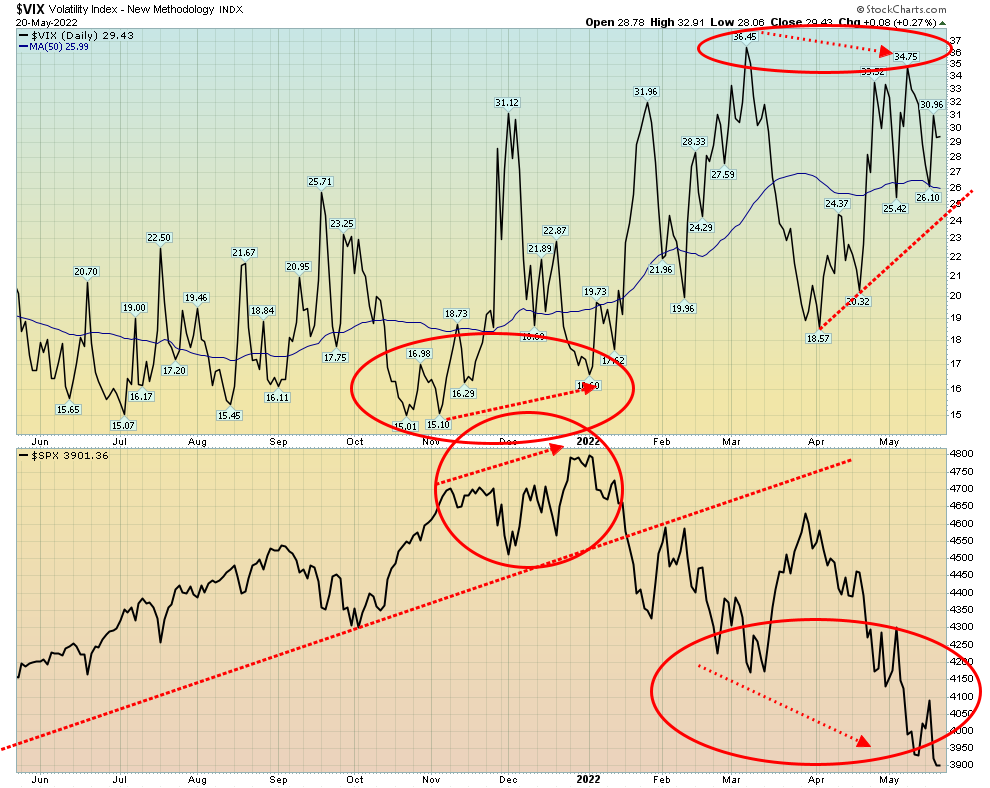
The divergence continues with the VIX Volatility Indicator. The VIX continues to make lower highs, even as the S&P 500 has made lower lows. This is a potentially important divergence that could be signaling at least a temporary low. We note this past week as well that the NYSE cumulative advance/decline line also did not make a new low with the S&P 500. However, that was too close to call so we’ll see if that one is confirmed. But the VIX diverging is a potential good signal for a low.
Source: www.stockcharts.com
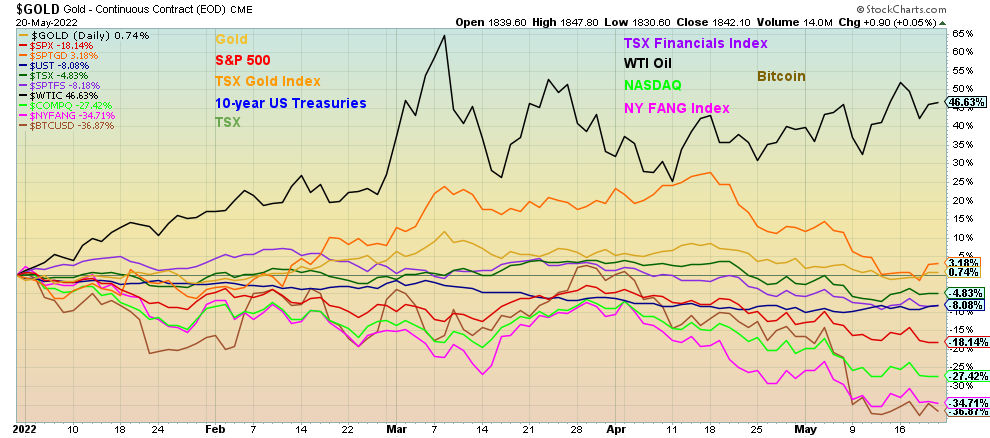
We thought we’d keep an eye on the returns thus far in 2022. Especially since three—the NASDAQ, the NY FANG Index, and Bitcoin—are all registering in bear markets. The S&P 500 slipped briefly into official bear market territory on Friday before rebounding, but is still down 18.1% so far this year. The key performers? Well, setting aside oil, it is noteworthy that gold is up on the year, albeit a small 0.7% and the gold stocks, represented here by the TSX Gold Index (TGD), are up 3.2% on the year. As we keep saying, got gold?
Source: www.stockcharts.com
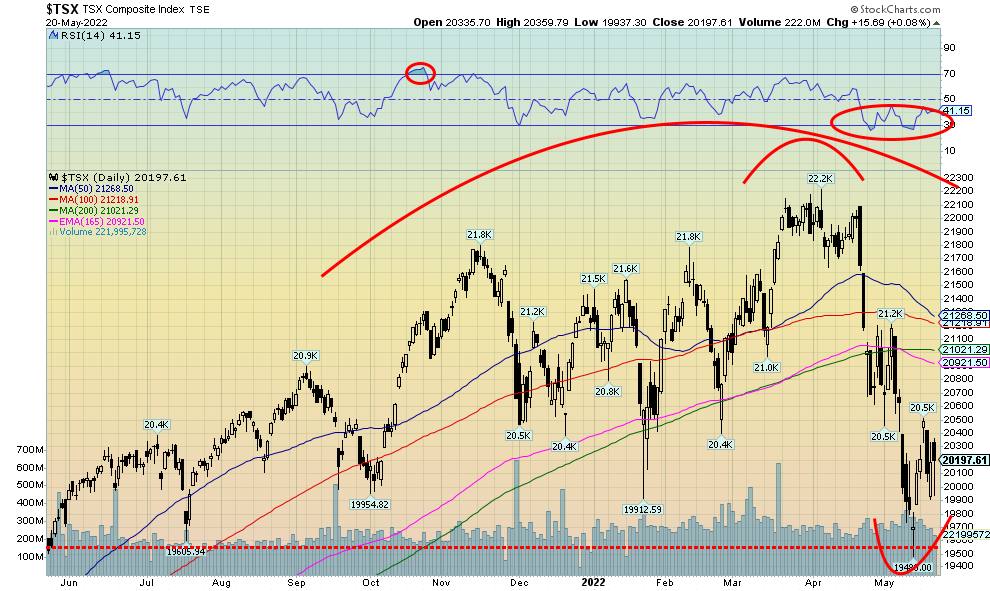
The TSX Composite beat the U.S. indices this past week with a gain of 0.5% while all of them were in the red and also making fresh 52-week lows. The TSX Composite did not make new lows. The TSX Venture Exchange (CDNX) also gained, up 0.8% on the week. That spike bottom for the TSX on May 12 at 19,480 is looking more like a bottom to us, having also fallen into a target range between 19,500/20,000. The TSX had a nice gain of 5% before settling back at the end of the week. Eight of the 14 sub-indices were positive on the week, led by Metals & Mining (TGM), up 4.0%. Energy (TEN) was up 3.4%, Materials (TMT) jumped 2.7%, Golds (TGD) was up 2.6%, and Utilities (TUT) gained 2.3%. The losers were led by Consumer Staples (TCS), down 3.4% while Consumer Discretionary (TCD) fell 3.2%. Nonetheless, the TSX has a way to go to get us out of the woods. We’d love to see us above 21,200, but right now regaining the 200-day MA near 21,000 would be a good start. 19,900/20,000 should hopefully now provide support. The strong performers this past week in Golds, Metals, and Materials could lead the way but others will also rise. We’d say energy as well, but that depends on oil and gas prices. The TSX Venture Exchange is also poised to break out over 720. We suspect that has also made an important low. The CDNX in particular is coming off some deep oversold levels.
Canada Inflation
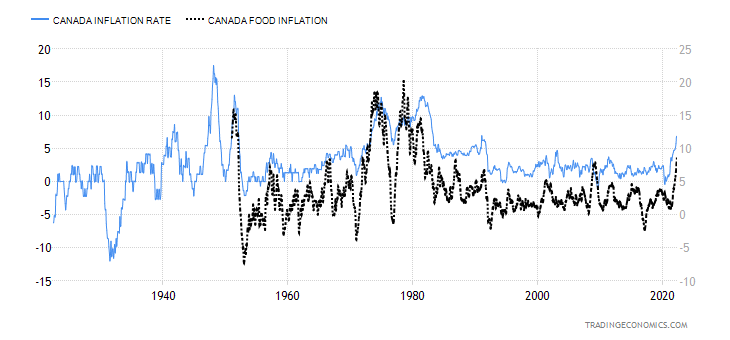
Source: www.tradingeconomics.com, www.statscan.gc.ca
We guess it shouldn’t have been a surprise that Canada’s inflation ticked up to 6.8% in April (6.7% March). It was the highest recorded inflation since January 1991. And, again, no surprise that two of the main culprits were food and energy. Food inflation (on the chart) was up 8.8% (7.7% March) while energy inflation jumped 7.4% (6.8% March). Fertilizers were cited as a prime reason for food inflation. The core inflation rate (ex food and energy) jumped 5.7%. That was the highest on record, driven by shelter costs, up 7.4% (6.8% March) and transportation, up 11.2%. Next up could be the kind of inflation we saw in the 1970s where it hit as high as 16%.
U.S. 10-year Treasury Bond/Canadian 10-year Government Bond (CGB)
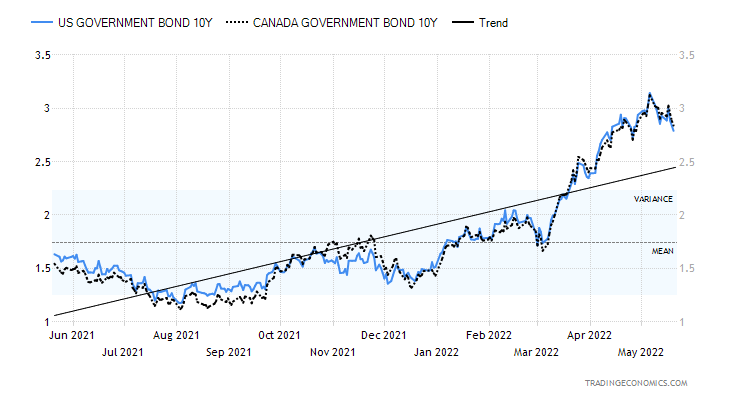
Source: www.tradingeconomics.com, www.home.treasury.gov, www.bankofcanada.ca
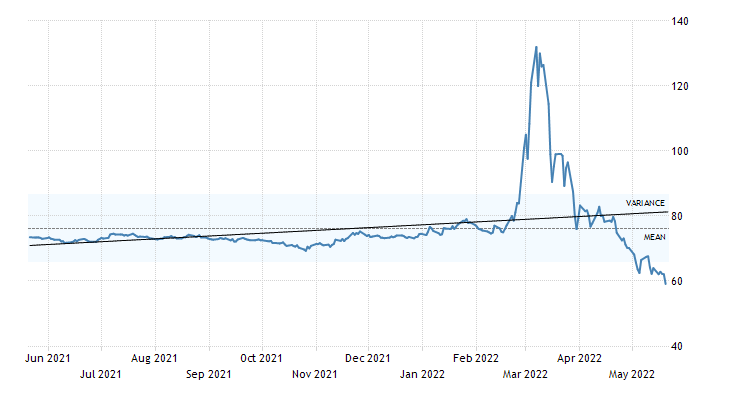
Have long bond yields topped? Given the Fed’s aggressive stance in hiking interest rates, there are now some fears growing that a recession could be on the horizon. And that in turn has sent the 10-year U.S. treasury note tumbling this past week from 2.92% to 2.79%. The high so far was seen back on May 6 at 3.18%. A break now of 2.70% would signal to us that a top is most likely in. The next targets then could be down to 2.25%. The Canadian Government of Canada 10-year bond (CGB) also fell to 2.84% from 2.96%. Our closely watched 2–10 spread also narrowed in the U.S. to 20 bp from 34 bp and in Canada also to 20 bp from 29 bp. Once they go negative, we would be in a position to suggest a recession is on the way (if it hasn’t already started). On May 26 we get the second estimate for Q1 GDP. The first estimate was a contraction of 1.4% and the expectation is that will be unchanged. Other numbers hinting at least the potential for a slowdown saw weekly initial jobless claims come in at 218,000 vs. an expectation of 207,000 and the previous week’s 197,000. The Philly Fed (manufacturing index) was 2.6 vs. an expectation of 17. Existing home sales month over month for April fell 2.4%, about as expected. Housing starts for April disappointed at 1.724 million vs. an expectation of 1.78 million. Building permits were down 3.2% below the expected down 2.6%. Retail sales for April surprised at up 0.9% vs. an expectation of a gain of 0.6%. And industrial production for April was up 1.1%, better than the expected gain of 0.4%. But it was the bearish Fed, coupled with yet another tumble for the stock market, that has investors worried. Many indices have entered bear markets, although the major indices so far are only deep in correction territory. However, all this is nicely coinciding with a fall in bond yields, even if the Fed keeps hiking their rate. That will narrow the spreads even more, pushing them into negative territory. All this coincides with consumer sentiment being the lowest in years as well.
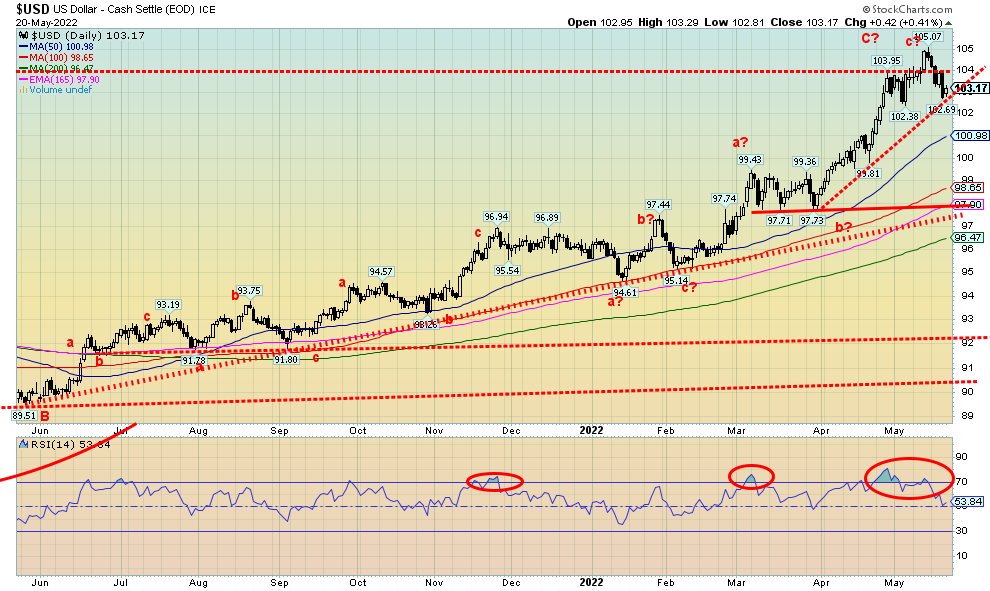
Source: www.stockcharts.com
Finally, a crack in the surging US$ Index. For the first time in seven weeks the US$ Index fell, losing 1.4% this past week. The US$ Index fell this past week on some growing concerns that the Fed’s aggressive stance towards interest rates could result in a recession. Another down week in the stock market didn’t help. The US$ Index eased on Friday but not enough to erase the down week. Could sentiment be shifting? The euro gained 1.5% as fears that the EU might embargo Russian oil and gas eased somewhat. The Swiss franc was up 2.9, the pound sterling jumped about 2.0%, while the Japanese yen gained again, up 1.1%. Could the US$ rally be over, at least temporarily? A break now under 102 would confirm a possible top. Under 101 the top would be confirmed. But we have a long way to go for a major breakdown. That would only come under 98. Still, this could just be an overdue correction that has seen the US$ Index surge 10.46 from lows in January to the 105.07 high, the highest level seen since November 2002 when the US$ Index was actually falling from even higher highs. Could eventually the 2001 high of 121.21 be in focus? We can’t tell yet. There is resistance here and up to 108, but above 108 the way could be clear to 111/112 next. In the interim we appear poised for a correction, which in turn would be positive for gold.
The Incredible Rising Ruble (US$1 =)
Source: www.tradingeconomics.com, www.cbr.ru
Okay, it’s upside down. It’s U.S. dollars to purchase Russian rubles. When Russia invaded on February 24, 2022 the US$1 could purchase 84 rubles. By March 7 the rate at one point leaped to US$1 purchasing 150 rubles. Today, the US$1 can buy only 59 rubles and that is falling or, should we say, the ruble is rising. So, what’s going on? Well, Russia did institute capital controls at one point. That certainly helped. All you could do was buy rubles. As well, imports have dropped substantially thanks to sanctions. And high oil and gas prices have allowed Russia to accumulate a lot of extra rubles. There isn’t a lot of data from the Russian side, but others have put together numbers from the countries that deal with Russia both on the import and export side. The suggestion is Russia could be seeing a record trade surplus.
According to The Economist, imports have fallen 44% since the invasion of Ukraine but exports are up at least 8%, thanks to their continued ability to sell their oil and gas. And now, more and more, companies are complying with the Russian request to pay for their oil and gas in rubles. The EU has confirmed that it is okay to pay Russia in rubles without breaking sanctions. The Italian energy giant Eni is opening ruble accounts with Gazprombank. Gazprombank have noted that at least half of their customers have now opened ruble accounts. And now Russia may benefit from the announcement that the U.S. is prepared to block Russian bond payments to investors in a bizarre move that could see Russia artificially forced to default. A current exemption is set to expire on May 25 and the U.S. Treasury Department is not renewing it, although it is not yet a done deal. See this article on Bloomberg (https://www.bloomberg.com/news/articles/2022-05-17/us-set-to-block-russian-debt-payments-raising-odds-of-default?sref=5lk0w2FC).
Bizarrely, Russia has not missed a beat in payments up until now. Russia is okay, but we already know that Russian corporations were not so lucky and billions of dollars of their debt are now in default. Russia has some $500 million in payments coming due by the end of June. Russia has no intention of defaulting but may be forced into it. They might try to pay in rubles because some of the bond issues allow that alternative. But we suspect that they will be blocked as well. The result is Russia will have even more rubles. And the ruble will continue to soar against the U.S. dollar. Not quite the intention of the U.S. when they placed sanctions on Russia. Unintended consequences?
The incredible Sinking Sri Lankan Rupee (US$1 =)
Source: www.tradingeconomics.com, www.cbsl.gov.lk
Well, if the Russia ruble is soaring vs. the U.S. dollar, the Sri Lanka rupee is going in the opposite direction. Sri Lanka has become the first sovereign country to officially default. It is also the first time Sri Lanka has ever defaulted. They have been wracked by an economic and political crisis that is paralyzing the country. Inflation has hit 40% and they have suffered shock waves from the war in Ukraine as there are significant shortages of both food, fuel, and medicines. Rolling blackouts have added to the woes and civil unrest has exploded on the streets with police firing tear gas, water cannons, and so far, rubber bullets. Sri Lanka is actually the oldest democracy in Asia and it is the first default of an Asian country this century. We fully expect more to follow. Also, the emerging market debt crisis is going to get worse, thanks to the sharp rise of the U.S. dollar. Their foreign exchange reserves have almost been wiped out. The question is, who’s next? The rupee, which was US$1 = 200 rupees back on March 4, 2022 is now US$1 = 355 rupees, an increase of about 78% or, stated the other way, a 44% depreciation. A mess that is going to get worse and spread.
Source: www.stockcharts.com
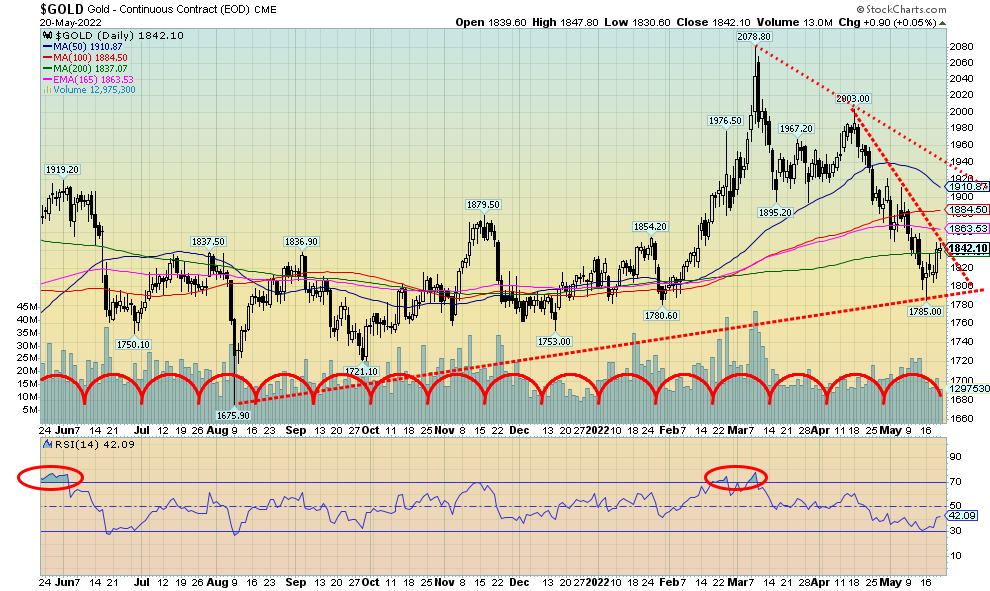
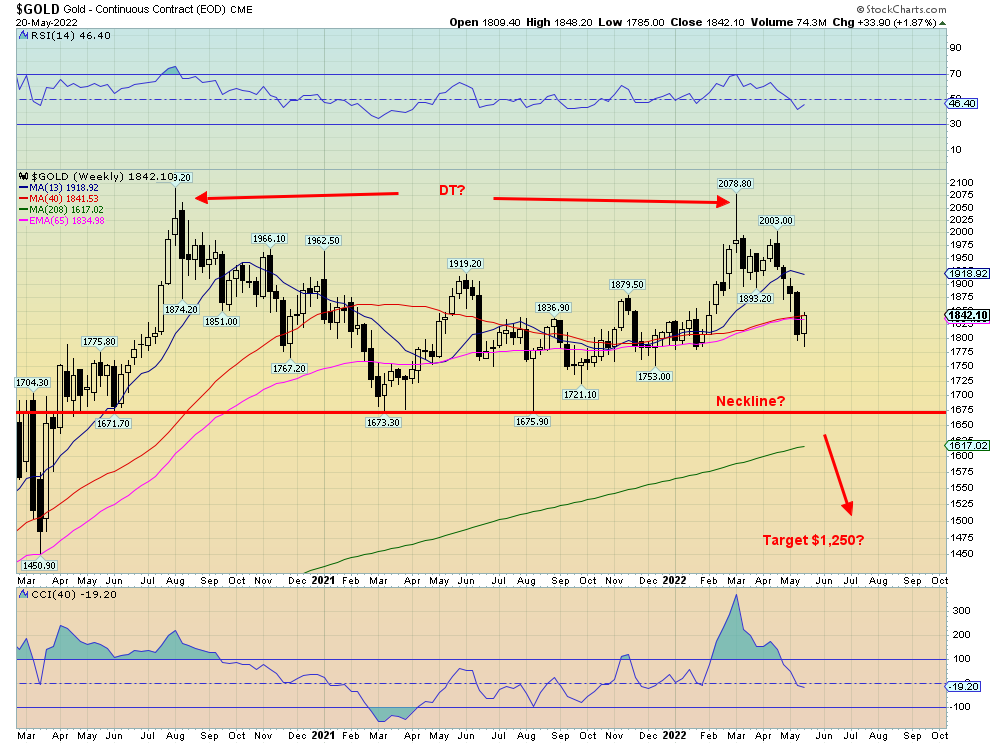
So far, so good. Gold has held the $1,780/$1,800 support zone. If that fails, however, then the next stop would be down to $1,750 and even down to $1,720. After four consecutive weeks to the downside that saw gold lose 11% and down six of the last nine weeks that saw gold lose just over 14%, gold rebounded this past week, gaining 1.9%. Silver fared even better, up 3.2%, platinum jumped 1.1%, while palladium was up 1.2% and copper gained 2.3%. Silver also has seen fresh 52-week lows (although not this past week) while gold did not, a potentially important divergence. The two need to confirm each other and when we have these divergences it often signals a top or a bottom. The gold indices also gained this past week with the TSX Gold Index (TGD) up 2.7% and the Gold Bugs Index (HUI) gaining 3.5%.
The prime reason for gold falling at one point this past week to new lows for the move down is the Fed’s aggressive stance against inflation with rate hikes and the strong U.S. dollar. The Fed has been promising to ratchet rates higher to kill inflation, even as they are more likely to cause a recession which in turn could bring down inflation. But the strong U.S. dollar hasn’t helped gold as the two often move inversely to each other.
The rally brought us up to the steep downtrend line from the recent high near $2,003. A firm break over $1,845 could send us to our next level we need to overhaul at $1,860/$1,885. A breakout over $1,940 would end the current downtrend. Until then, we remain wary that there is more downside to come. The low this week at $1,785 was important to have the $1,780/$1,800 zone hold. A breakdown under $1,780 could send to our next level at $1,750 and even down to $1,720 and the September 2021 low.
We have been musing as to whether we are now in the downside of the current 31.3-month cycle and therefore also in the downside of the 7.8-year cycle low and the 23.5-year cycle low. We have often noted them in the past. The last 31.3-month cycle low we believe was in March 2021 at $1,673. That came precisely 31 months after the August 2018 which came 32 months after the major December 2015 low. The December 2015 low is the last 7.8-year cycle low that came 7.2 years after the October 2008 low which in turn came 7.5 years after the key April 2001 low. The April 2001 low is our last recorded 23.5 cycle low that came 25 years after the major 1976 low. All were within acceptable ranges. So, the next 7.8-year cycle low is due, ideally, anywhere from May 2023 to April 2024 while the 23-year cycle low is due, ideally, from February 2023 to June 2024, according to cycles analyst Ray Merriman (www.mmacycles.com). Merriman has had an excellent degree of accuracy.
If that is correct, then we need to watch this next rally carefully. The high so far was the $2089 we saw in August 2020 followed by the possible double top at $2,078 in March 2022. We could draw a neckline at $1,673 the March 2021 low and, if that ever breaks, then targets could be down $1,250. We can’t dismiss it. So, this next rally is important if we can’t overhaul $2,000 and up to $2,080. Then the downside could be in focus. If correct, it would set up a massive buying opportunity. We believe it could come with a broader market meltdown.
Source: www.stockcharts.com
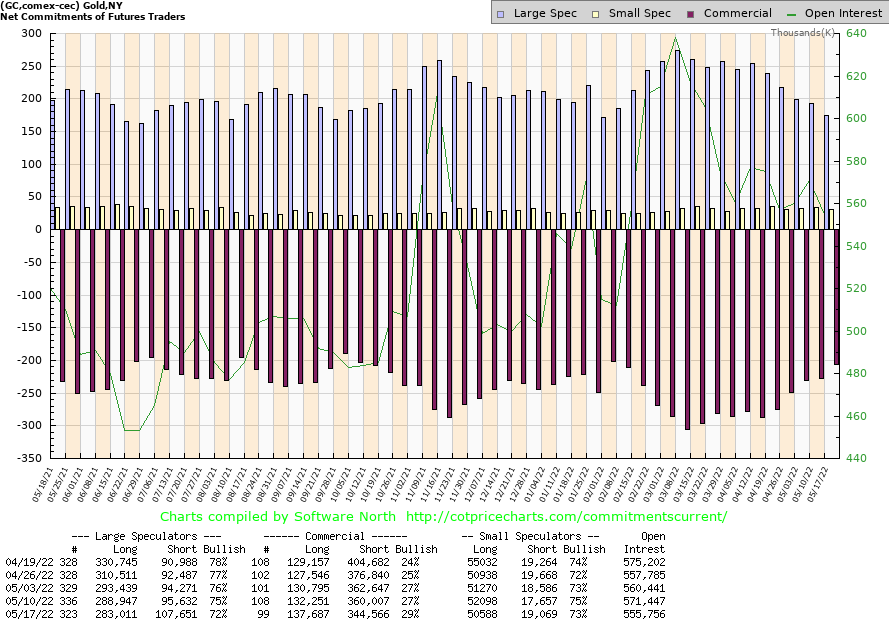
Source: www.cotpricecharts.com
Just what the doctored ordered. Another decent improvement in the gold commercial COT (bullion companies, banks) this past week. It jumped to 29%, the best level seen in weeks or certainly since December before a good gold rally. Long open interest jumped over 5,000 contracts while short open interest contracted again down about 16,000 contracts. Total open interest contracted by roughly 16,000 contracts as well reflecting most likely short covering. The large speculators COT fell to 72% from 75% as they added roughly 12,000 shorts while shedding over 5,000 contracts. A good week and a positive move by the gold COT.
Source: www.stockcharts.com
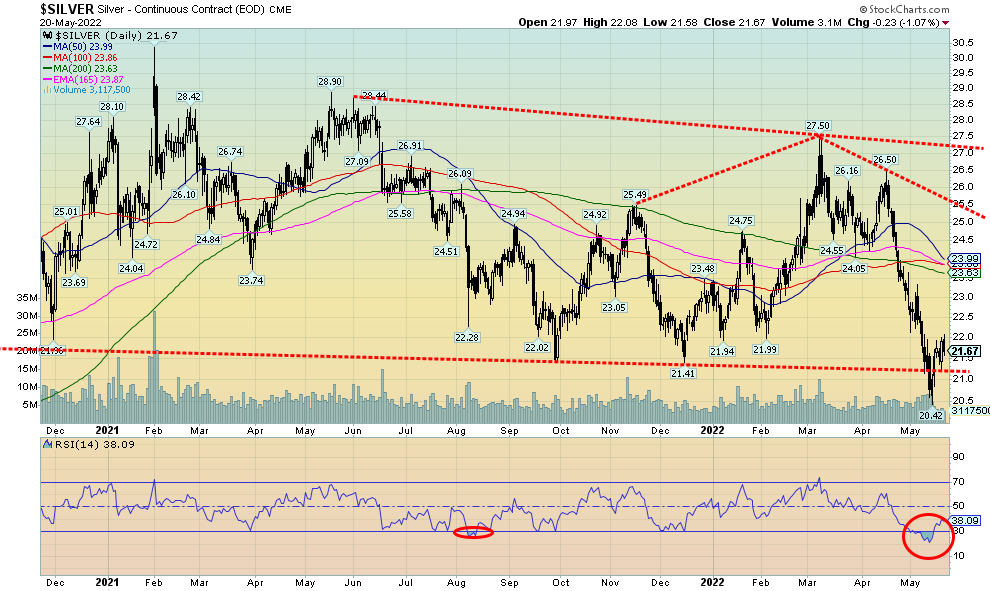
Silver, like gold, follows the whims of the Fed on rate hikes and the sharply rising U.S. dollar. This past week the U.S. dollar pulled back, helping both gold and silver. Silver broke its four-week slide that saw it lose $6 or 23%. Silver is also down six of the last nine weeks, losing almost 26% at the recent low although now down only 21%, thanks to the rally this week that saw silver gain 3.2%. Silver remains down 7.2% on the year.
It really looked like game over for silver when it broke down under that December 2021 low of $21.41. The low was at $20.42 and many thought we were headed for $18 next. But silver reversed and closed up over 6% from that low. There are now some good odds that silver has bottomed. But we still need to confirm by regaining above $23 and preferably above $24. Silver would not break out until we are over $25.50 and $27. Silver also diverged with gold in that silver made fresh 52-week lows below the December 2021 low. Gold did not. We usually see these kinds of divergences at tops and bottoms with gold often being the leader, in this case not making new lows. Obviously, a breakdown once again under $21 would be negative for silver then the targets could be even lower at $18/$19.
If there was anything we didn’t like, it is the corrective type waves that unfolded from the $20.42 low. It took on the form of what we call a double zig-zag abcxabc, etc. The pattern down appears so far as an ABC, but then this up move could be fourth wave correction before a fifth wave down unfolds. Above $24 we’d end all thoughts of new lows.
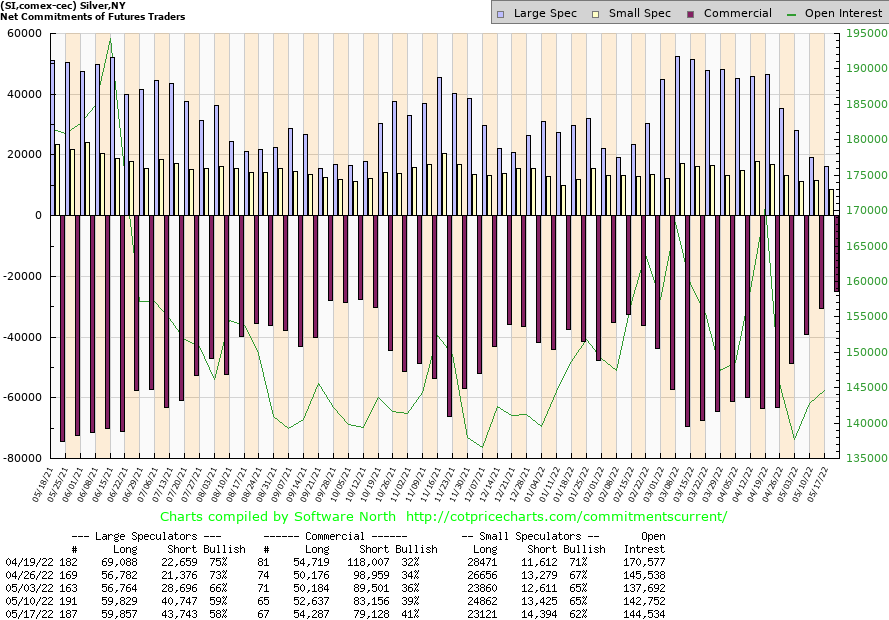
Source: www.cotpricecharts.com
Like the gold COT, the silver commercial COT also improved this past week to 41% from 39%, again the best levels seen since December 2021 before a good rally. Indeed, it’s even better than it was in December. Long open interest rose about 2,000 contracts while short open interest fell roughly 4,000 contracts. The large speculators COT fell to 58% from 59% while total open interest rose about 2,000 contracts. A good report that helps turn the outlook positive.
Source: www.stockcharts.com
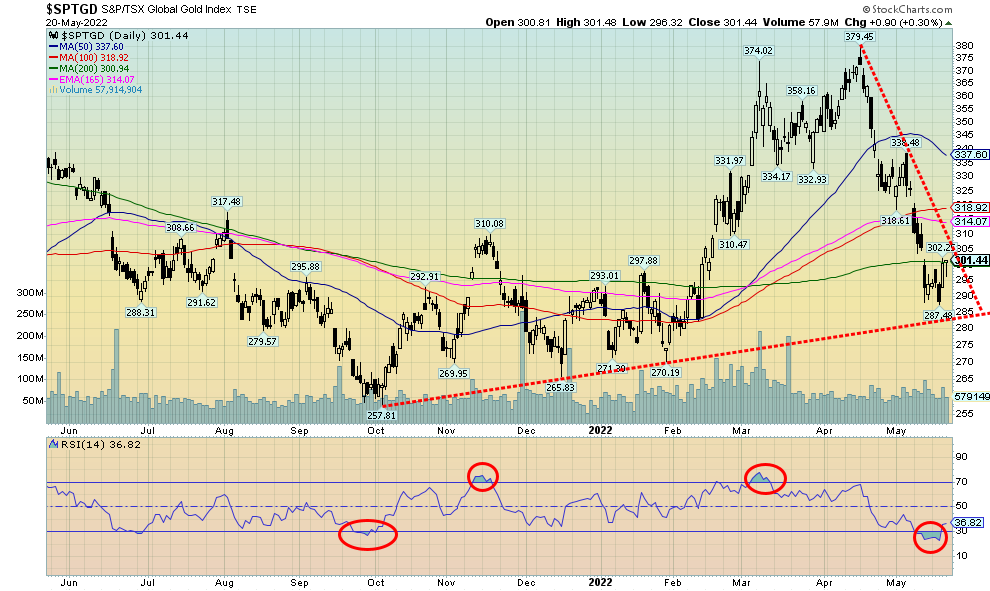
After a sharp four consecutive weeks to the downside that saw the TSX Gold Index (TGD) fall almost 23% in a hurry, the gold stock indices rebounded this past week. The TGD jumped 2.7% while the Gold Bugs Index (HUI) was up 3.5%. The TGD is in positive territory for the year, up 3.2% but the HUI is still down by 1.0%. It is telling that the Gold Miners Bullish Percent Index (BPGDM) has fallen to 27.6%, well down from the 83.3% seen in mid-April. Not quite in bear territory but getting close. In September 2021 the indicator fell to 16.7% and it was still at 20% in December 2021. Back in December 2015 at the major low it fell to 0%. There wasn’t a bull to be found.
Note how the TGD’s RSI fell under 30% and held it there for the past week or two. Now it is turning back up. No, not out of the woods yet over 50%, but it’s a start. The TGD finished the week clinging to the 200-day MA, currently at 301. We note a sharp downtrend line from the April high currently at 305. So, a firm break over 305 would give us a signal that low may be in. Ideally, we’d like to get above 320 to really confirm that. Until we break out over 305 there remains some risk to the downside, but the action this past week was positive and the good close on Friday tells us that we should see further gains this coming week. The TGD breaks down under 285 and then new lows could be seen.
Source: www.stockcharts.com
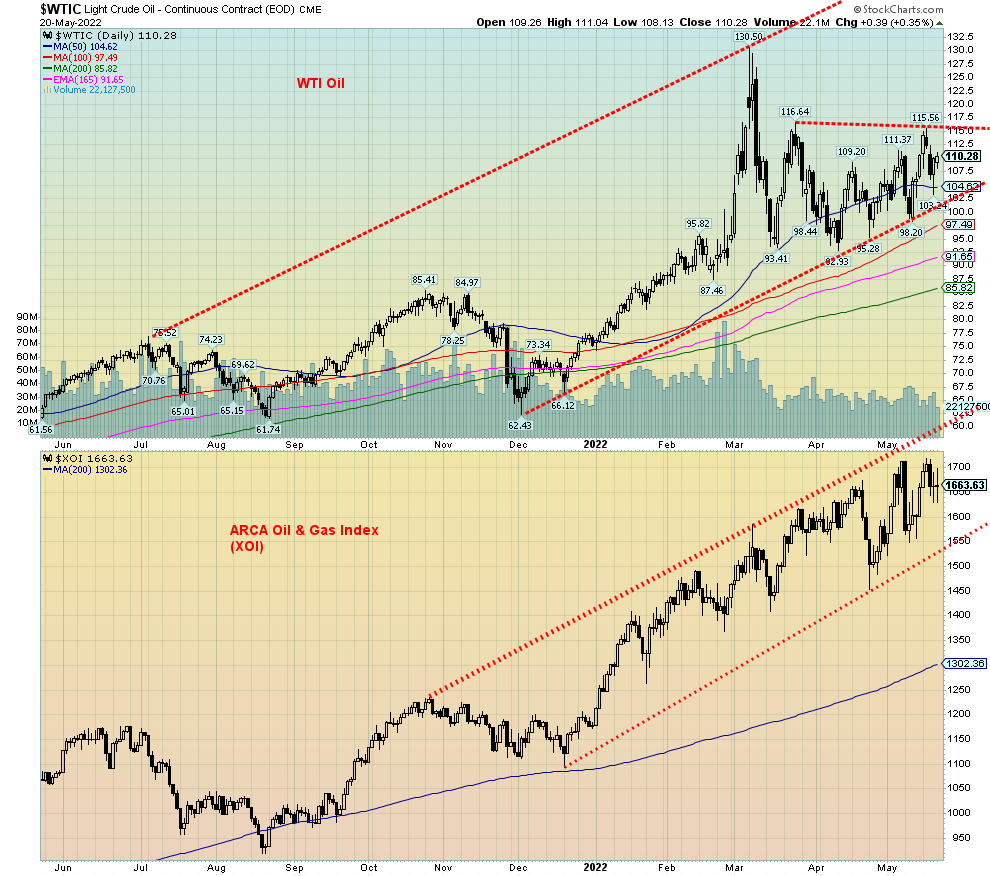
Oil prices are holding up but the big question is, will they burst upward and surge to $150 as many are predicting? Maybe, maybe not. WTI oil actually finished off slightly this past week, losing 0.2%. Not so for natural gas (NG) as it once again surged upward by 5.5% and is now up 116.6% so far in 2022. The energy indices both managed to hang on to gains with the ARCA Oil & Gas Index (XOI) up 0.3% and the TSX Energy Index (TEN) gaining 3.4%. Both indices are up a strong 41.2% and 54.7% respectively thus far in 2022.
However, it was the mixed result for oil prices this past week that caught our attention. While there has been some demand destruction in China as result of the lockdowns, offsetting that is the Ukraine war and the EU
wanting to pivot away from Russian oil and gas. Too bad they can’t fully find a replacement for it. That puts the pressure on them and even that could be wavering as some polls in the EU show support for Ukraine is wavering. High oil and gas prices might do that to people. In Italy, support for the war is apparently wavering as many are signaling for a solution to the war by conceding Crimea and the Donbas to Russia and keeping Ukraine out of NATO. Support for Finland and Sweden in NATO is not a layup either as Turkey has indicated they don’t support their admission.
Helping Russia on the buy side are China and India. India had been buying Russian oil at a discount and now both China and India are in talks for more oil from Russia, albeit probably also at a discounted price. But even discounted, it helps Russia replenish its coffers and more than keep its head above water. Russia is apparently headed for a record trade surplus, thanks to high oil and gas prices. As well, while the EU has talked about embargoing Russian oil and gas, their action on it is considerably less as they realize the huge negative impact on their economies.
All the different tensions are keeping oil prices up, but they haven’t yet begun to fall nor are they jumping higher either. WTI oil did jump to $115.56 this past week, appearing to break out, but then oil fell immediately back down, ending the week at $110.28. NG instead jumped higher as we note. The pattern forming continues to us to appear as a possible bull consolidation but we need a firm breakout. We’ll use above $117 as an indication we could go higher. Above $121.75 new highs above $130.50 are probable. Targets could then be up to $140/$150.
But it is also essential to keep an eye on the downside if prices suddenly soften again. A break under $102.50 could signal that the rally is over and under $98 odds favour a drop to $78/$80.
China plans on easing up on its current rather extreme lockdowns. That could help oil demand as demand surges in China once again. But adding to supply are plans by the U.S. to ease sanctions on Venezuela. Venezuela is the world’s 12th largest producer despite sanctions and they hold the world’s largest oil reserves. They could produce a lot more but their equipment needs serious upgrading. Possibly the easing of sanctions will help that the U.S. comes to terms with the Maduro government. Another country that could see sanctions eased is Iran, a country that holds the world’s fourth largest reserves behind Canada, Saudi Arabia, and Venezuela.
While we favour the upside for oil (and gas), we are wary that we could instead see a breakdown and lower prices. That could bring welcome relief at the gas pump as the grumbling about high prices rises and with it support for the war wavers.
Source: www.stockcharts.com
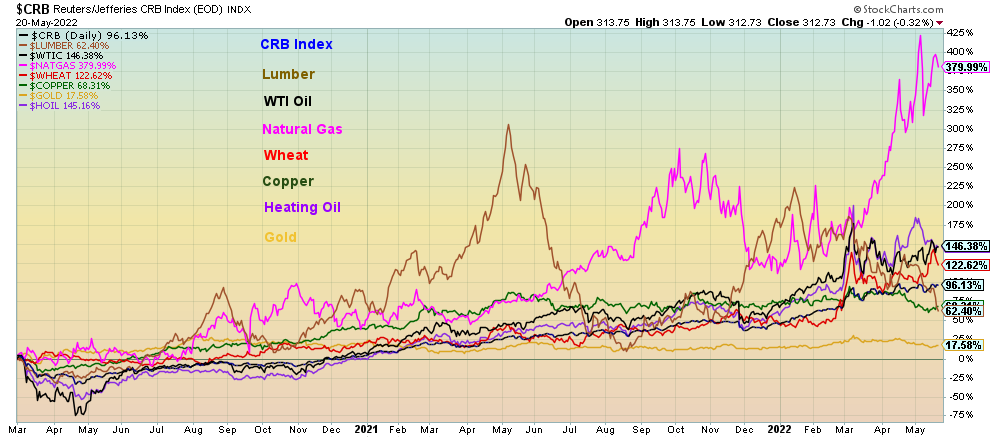
We thought we’d end with a look at how the CRB Index and some of its key components have fared since March 2020 at the onset of the pandemic. The CRB Index is made up of 19 commodities that trade on the NYMEX, CBOT, LME, CME, and COMEX exchanges. It is broken down as 39% energy, 41% agriculture, 7% precious metals, and 13% industrial metals. It includes crude oil, natural gas, heating oil, unleaded gas, wheat, corn, cocoa, coffee, cotton, lean hogs, live cattle, orange juice, soybeans, sugar, gold, silver, aluminum, copper, and nickel. In our chart above we took a look at the performance of seven of the components that we thought were key. Leading the way to the upside has been natural gas (NG), up an incredible 380% since March 2020. That is followed by crude oil, up 146%. And we wonder why gas prices at the pump are so high. However, a check with Statistics Canada shows that regular unleaded gas is up only about 120% since March 2020, somewhat less than crude oil itself. Heating oil by comparison is up 145% during the same period.
Wheat prices are up 123%, putting considerable pressure on the price of groceries. Copper is up by 68% and lumber is up 62%. But lumber is down sharply from its highs back in May 2021 when it was up roughly 300%. That it has fallen considerably suggests to us that will feed back into housing starts and into the price of houses. The suggestion here is that both are going to come down. Rounding out our table is gold which is up only a modest 17.5%. The CRB Index itself is up 96% and still pointed higher.
Commodities are a part of our everyday life. Seeing how each component has performed since the on start of the pandemic in March 2020 puts an exclamation mark on our inflation. The U.S. CPI now stands at up 11.8% since March 2020 but the y-o-y inflation rate is up 436% from 1.53% to 8.2%. No sign yet that inflation is slowing. But if the Fed hikes interest rates to where everyone thinks they will take it, then a recession is highly probable and that alone could bring down the rate of inflation. But also needing resolution is the supply disruption and war that have been behind the sharp rise in commodity prices.
Copyright David Chapman, 2022
|
GLOSSARY Trends Daily – Short-term trend (For swing traders) Weekly – Intermediate-term trend (For long-term trend followers) Monthly – Long-term secular trend (For long-term trend followers) Up – The trend is up. Down – The trend is down Neutral – Indicators are mostly neutral. A trend change might be in the offing. Weak – The trend is still up or down but it is weakening. It is also a sign that the trend might change. Topping – Indicators are suggesting that while the trend remains up there are considerable signs that suggest that the market is topping. Bottoming – Indicators are suggesting that while the trend is down there are considerable signs that suggest that the market is bottoming. |
David Chapman is not a registered advisory service and is not an exempt market dealer (EMD) nor a licensed financial advisor. He does not and cannot give individualised market advice. David Chapman has worked in the financial industry for over 40 years including large financial corporations, banks, and investment dealers. The information in this newsletter is intended only for informational and educational purposes. It should not be construed as an offer, a solicitation of an offer or sale of any security. Every effort is made to provide accurate and complete information. However, we cannot guarantee that there will be no errors. We make no claims, promises or guarantees about the accuracy, completeness, or adequacy of the contents of this commentary and expressly disclaim liability for errors and omissions in the contents of this commentary. David Chapman will always use his best efforts to ensure the accuracy and timeliness of all information. The reader assumes all risk when trading in securities and David Chapman advises consulting a licensed professional financial advisor or portfolio manager such as Enriched Investing Incorporated before proceeding with any trade or idea presented in this newsletter. David Chapman may own shares in companies mentioned in this newsletter. Before making an investment, prospective investors should review each security’s offering documents which summarize the objectives, fees, expenses and associated risks. David Chapman shares his ideas and opinions for informational and educational purposes only and expects the reader to perform due diligence before considering a position in any security. That includes consulting with your own licensed professional financial advisor such as Enriched Investing Incorporated. Performance is not guaranteed, values change frequently, and past performance may not be repeated.
About the author


Website: https://www.enrichedinvesting.com
Disclaimer: David Chapman is not a registered advisory service and is not an exempt market dealer (EMD) nor a licensed financial advisor. We do not and cannot give individualised market advice. David Chapman has worked in the financial industry for over 40 years including large financial corporations, banks, and investment dealers. The information in this newsletter is intended only for informational and educational purposes. It should not be considered a solicitation of an offer or sale of any security. The reader assumes all risk when trading in securities and David Chapman advises consulting a licensed professional financial advisor before proceeding with any trade or idea presented in this newsletter. David Chapman may own shares in companies mentioned in this newsletter. We share our ideas and opinions for informational and educational purposes only and expect the reader to perform due diligence before considering a position in any security. That includes consulting with your own licensed professional financial advisor.