
“How much would you pay to avoid a second depression.”
—Ben Bernanke, American economist, Fellow of the Brookings Institution, 14th Chair of the Federal Reserve 2006–2014, author of The Courage to Act (2015); b. 1953
“Since becoming a central banker, I have learned to mumble with great incoherence. If I seem unduly clear to you, I must have misunderstood what I said.”
—Alan Greenspan, American economist, 13th Chair of the Federal Reserve 1987–2006, 10th Chair of the Council of Economic Advisers 1974–1977, firm Greenspan and Associates LLC; b. 1926
“Well, by the standards of a lot of countries, by Latin American standards, it wasn’t so bad.”
—Paul Volker, American economist, 12th Chair of the Federal Reserve 1979–1987, reference is to the inflation of the 1970s, Chair of the Economic Recovery Advisory Board 2009–2011; 1927–2019
In a move that was mostly expected, president Biden reappointed Jerome Powell as chair of the Federal Reserve for a second term. Lael Brainard, who some had expected to be named as Fed chair, was appointed as Vice Chairman. In choosing Powell, Biden cited the current economic circumstances present “enormous potential and enormous uncertainty,” and require “stability and independence.” Powell’s term needs to be confirmed by the Senate. Given Powell was originally appointed by former president Donald Trump, his confirmation is not expected to face any major opposition. Treasury Secretary Janet Yellen, a former Fed chair, had lobbied for Powell’s reappointment. While the position is appointed by the president, the Fed board of governors, which includes the chair, is an agency of the federal government which reports to and is directly accountable only to Congress, not to any president.
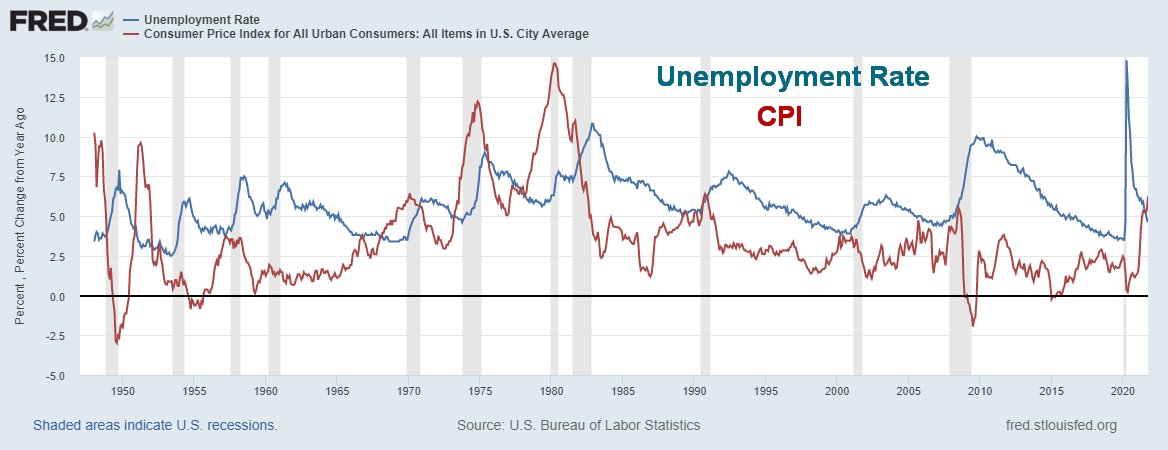
The Fed is empowered to fulfill two mandates: maximize employment and keep inflation stable. Under Powell, U3 unemployment has fallen from a pandemic peak of 14.8% to the most recent 4.6%. Inflation, on the other hand, has gone from zero in May 2020 to 6.2% for the most recent numbers. Grant you, the unemployment rate when Powell assumed the chair was 3.9% and inflation was 1.9% but that was pre-pandemic. Overall, it is unemployment down, inflation up.
The inflation has been caused primarily by supply disruptions because of the negative impacts of COVID globally, stimulation of the economy through COVID cheques, enhanced unemployment benefits, and the strong pick-up in demand following the COVID-induced recession of 2020. After plunging 9.1% in Q2 2020, GDP has rebounded, growing 4.9% in Q3 2021. It was the third consecutive quarterly rise, signaling, on paper at least, that the recession of 2020 had ended.
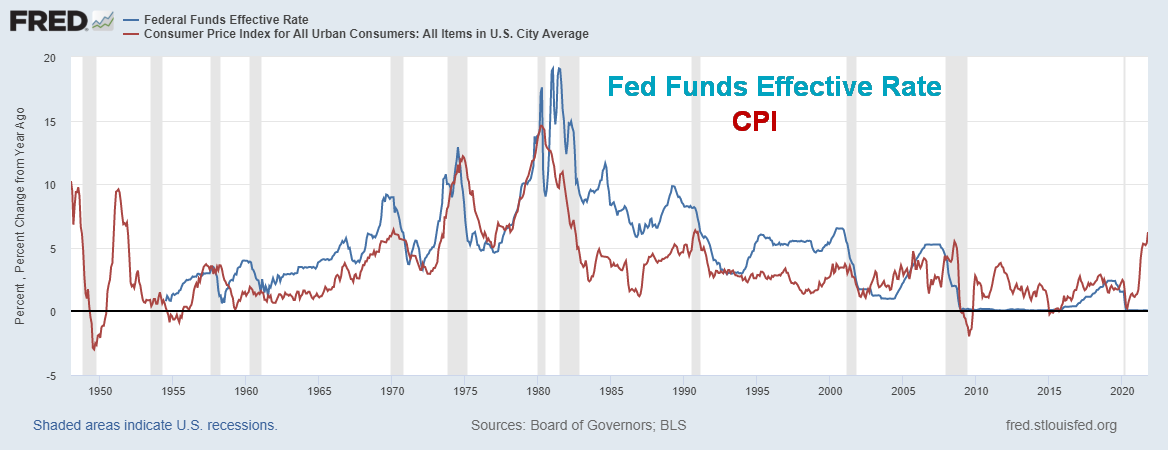
Given the Fed’s mandate of employment and inflation, we took a look at previous peaks of inflation, the fed funds rate, and the unemployment rate. What we discovered was interesting. Fed funds tended to peak on average six months before inflation peaked. However, unemployment didn’t peak until on average 22 months after the peak in inflation. We started with the mid-1970s as that was during a significant period of inflation, unemployment, and spike in fed funds.
Source: www.stlouisfed.org, www.bls.gov
|
CPI Peak Rate A |
Unemployment Peak Rate B |
Fed Funds Peak Rate C |
Lag |
||||
|
Date |
Rate |
Date |
Rate |
Date |
Rate |
A-B |
A-C |
|
Nov 1974 |
12.2% |
May 1975 |
9.0% |
Jul 1974 |
12.9% |
6 mths |
(4 mths) |
|
Mar 1980 |
14.6% |
Nov 1982 |
10.8% |
Jan 1981 |
19.1% |
31 mths |
10 mths |
|
Oct 1990 |
6.4% |
Jun 1992 |
7.8% |
Mar 1989 |
9.9% |
20 mths |
(19 mths) |
|
Mar 2000 |
3.8% |
Jun 2003 |
6.3% |
Mar 2000 |
3.8% |
39 mths |
0 |
|
Jul 2008 |
5.5% |
Oct 2009 |
10.0% |
Jul 2006 |
5.3% |
15 mths |
(24 mths) |
|
Oct 2021 |
6.2% * |
Apr 2020 |
14.8% * |
July 2019 |
2.4% * |
|
|
|
Average |
|
|
|
|
|
22 mths |
(6 mths) |
Source: www.stlouisfed.org
* To date
Source: www.stlouisfed.org, www.bls.gov,
One thing was certain. The rise in inflation, coupled with a rise in interest rates, eventually sparked a rise in unemployment. It was only during 1980–1982 when the fed funds rate peaked after the rate of inflation. Inflation peaked at 14.6% in March 1980 but the fed funds rate didn’t peak until January 1981, some 10 months later, while the unemployment rate peaked at 10.8% in November 1982. In all the other cases, the fed funds rate peaked before the rate of inflation. In 2000 they coincided in March. But it’s clear that a rise in inflation, coupled with the rise in the fed funds rate, eventually led to a rise in unemployment as the economy slipped into recession.
Currently, the market is not expecting any rate rise until at least mid-2022, with many mentioning June 2022. The market appears poised to accept the potential for a faster taper and at least three rate hikes in 2022. As well, has unemployment peaked? Even if the Fed hikes interest rates, the odds of pandemic-style unemployment are most likely low. Unemployment could still peak later, but at a lower level compared to April 2020.
The other thing to consider is the stock market. Except for the most recent recession, the stock market made its final bottom after both inflation and the fed funds rate peaked but before the unemployment rate peaked. Our second table shows this relationship.
|
Stock Market Bottom A |
CPI Peak Rate B |
Fed Funds Peak Rate C |
Unemployment Peak D |
||||
|
Date |
|
Date |
A-B |
Date |
A-C |
Date |
A-D |
|
Dec 1974 |
|
Nov 1974 |
1 mth |
Jul 1974 |
5 mths |
May 1975 |
(5 mths) |
|
Aug 1982 |
|
Mar 1980 |
29 mths |
Jan 1981 |
19 mths |
Nov 1982 |
(3 mths) |
|
Oct 1990 |
|
Oct 1990 |
0 |
Mar 1989 |
19 mths |
Jun 1992 |
(20 mths) |
|
Oct 2002 |
|
Mar 2000 |
31 mths |
Mar 2000 |
31 mths |
Jun 2003 |
(8 mths) |
|
Mar 2009 |
|
Jul 2008 |
8 mths |
Jul 2006 |
32 mths |
Oct 2009 |
(7 mths) |
|
Mar 2020 |
|
Jan 2020 |
|
Jul 2019 |
|
Apr 2020 |
|
|
Average |
|
|
14 mths |
|
21 mths |
|
(9 mths) |
Source: www.stlouisfed.org
The stock market tended to bottom roughly 14 months after the rate of inflation (CPI) peaked and 21 months after the fed funds rate peaked. However, unemployment did not peak until on average nine months after the stock market bottomed. The March 2020 stock market low cannot be considered in this equation as there was no spike in inflation before the pandemic-induced recession of 2020. CPI did reach 2.5% in Jan 2020 but that was well within the Fed’s margin of error. The fed funds rate reached its peak of 2.4% back in July 2019 and was actually falling before the pandemic panic of March 2020. Unemployment peaked a month later in April. While we listed that series, that is not the same as the prior periods of spiking inflation. The current rate of inflation has exceeded those periods and may not have peaked. What’s to come will be a rise in the fed funds rate and the unemployment rate.
The central banks are effectively trapped. Rising inflation presents a dilemma for them. They can’t start raising rates without potentially putting the economy and employment at risk. All aspects of the economy would be impacted by rising rates, particularly housing, automobiles, etc. With inflation proving potentially to be more than just transitory, it puts further pressure on the Fed to act. The negative spreads between inflation and the bonds, treasury bills, etc. just get wider. That in turn, of course, could continue to support the stock market as money remains cheap relative to the potential returns. The Fed cannot control inflation as they have no control over supply disruptions, oil prices, etc.
The Fed also has no control over the COVID. The world is now being rocked by a new, potentially deadly COVID variant B.1.1.529. It is too early to tell what the impact might be, but the initial reaction is that oil is down, stocks down, the U.S. dollar down, and gold up. If this variant spreads, it will add to the Fed’s dilemma and hiking interest rates could then be off the table even if inflation remains elevated.
Given Powell’s re-appointment, it was a bit of shock to see gold initially get pummeled $40+ before bouncing back a bit at the end of the week. The excuse was Powell was more of a hawk and would hike interest rates faster than Brainard. As well, the Fed under Powell would stay on course regarding tapering and some say they may even accelerate. It was a possible knee-jerk reaction. The other side not stated was that the bullion banks were probably poised to unload to push gold down, given their jump in the short position for the commercial COT the past few weeks. The Powell reappointment was the excuse. We note as well that the U.S. dollar jumped higher as did yields on U.S. treasuries. A reminder that gold is not particularly in favour by central banks. We say that despite central banks holding, as of July 2021, 35,440 metric tonnes of gold or 1.1 billion troy ounces. The U.S. continues to hold the world’s largest gold reserves: 8,133.5 metric tonnes or 261.5 million troy ounces.
Central banks don’t like gold because they can’t control it, nor can they print it. Debts and taxes are only payable in fiat currency, not gold or silver. Fiat currency is legal tender, not gold or silver. However, as noted, the central banks hold it in their vaults, making up globally some 61% of reserves. Fiat currencies, it should be noted, have all fallen against the price of gold since the world came off the gold standard in August 1971. The remainder of the central bank reserves is made up of treasury securities, primarily of the U.S. but also others such as the U.K., the EU, Japan, Canada, and even China. Why do central banks continue to hold gold? Because it is not the liability of any government. A classic reason to hold some gold and silver.
The next key dates for the Fed are December 14 and 15. December 15 also marks the 6th anniversary of the Fed hiking of the fed rate back in 2015, the first hike since rates were lowered sharply in 2008–2009 because of the financial crisis. The hiking of interest rates marked the low for gold as, over the next six months, gold rose over $300 or 31.8%. Silver and the gold stocks rose even more. The December 2015 low for gold at $1,045 also marked the low of the past decade.
The rest of this page is blank
Chart of the Week
Source: www.stockcharts.com
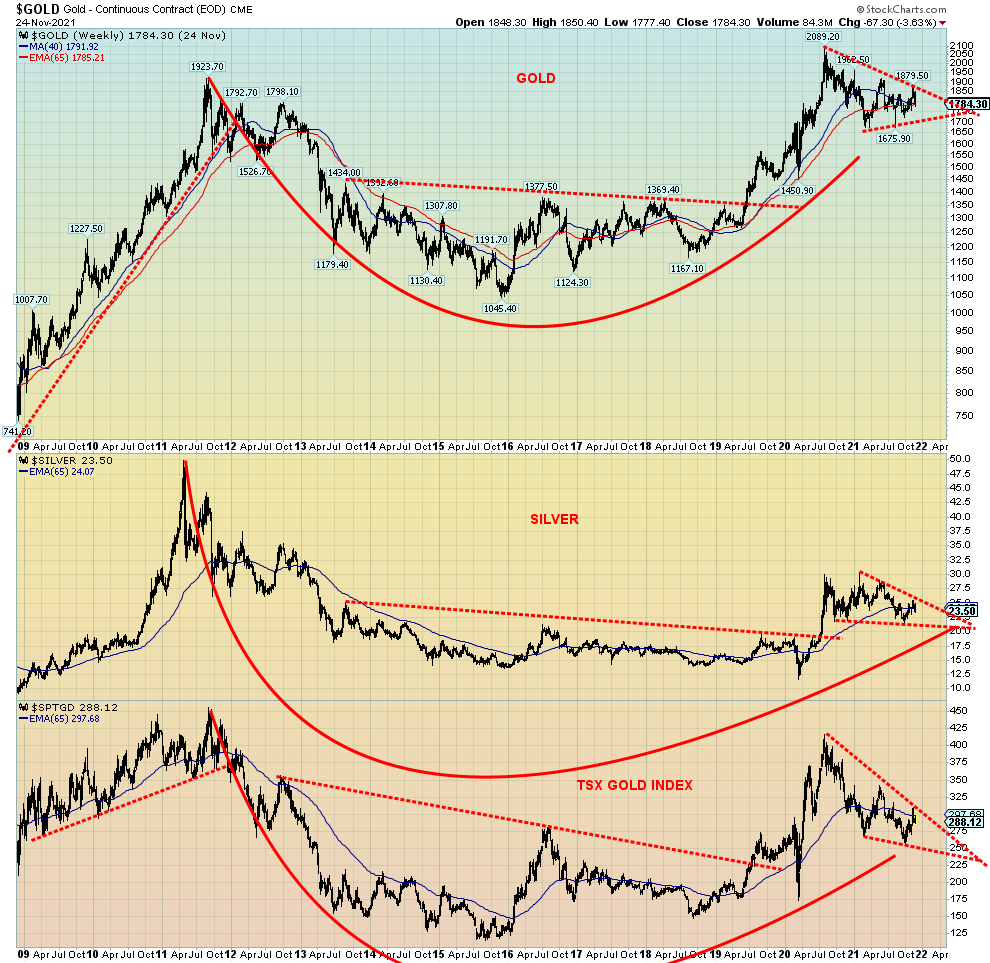
What is interesting, however, is that gold has been forming what appears as a large symmetrical triangle while silver and the TGD appear to be forming pennant formations. All of these can be interpreted as corrective/consolidation patterns. A break-out for gold above $1,880, preferably above $1,900/$1,950, could target up to $2,350. For silver, the pennant formation breaks out over $27 and potentially targets up to $36. For the TGD, the pennant formation breaks out over 310 with potential targets up to 470.
The overall pattern is what technicians call a cup and handle—the cup being the rounded bottom that formed between 2011 and 2019 while the handle is the current corrective/consolidation pattern. The pattern is considered quite bullish. But like all patterns it needs to be fulfilled and we won’t know that until we break out to the upside.
The caveat, of course, is what if they break down instead? One can never rule that out until the upside points are firmly taken out. We are now moving into the early range for both the 7.8-year cycle low that dates from the last low in December 2015 and also the 23.5-year cycle low that was last seen in April 2001. The best potential time frame for the two cycle lows to coincide is 2023 to mid-2024. All of this assumes that the August 2020 high of $2,089 was the crest for both the 7.8-year cycle and the 23.5-year cycle. The last 31-month cycle low we have pegged in August 2021 at $1,675. The breakdown point is at $1,675 and, in theory, could project down to at least $1,250.
We believe all three are forming on the big picture and huge cup and handle pattern. However, time is running out and the market should break one way or the other soon. The patterns suggests that the break should be to the upside. But until the breakout is confirmed, the caveat of a downside break remains in place and should not be ignored.
MARKETS AND TRENDS
|
|
|
|
% Gains (Losses) Trends
|
|
||||
|
|
Close Dec 31/20 |
Close Nov 26/21 |
Week |
YTD |
Daily (Short Term) |
Weekly (Intermediate) |
Monthly (Long Term) |
|
|
Stock Market Indices |
|
|
|
|
|
|
|
|
|
S&P 500 |
3,756.07 |
4,594.81 |
(2.2)% |
22.3% |
up (weak) |
up |
up |
|
|
Dow Jones Industrials |
30,606.48 |
34,899.47 |
(2.0)% |
14.0% |
down |
up |
up |
|
|
Dow Jones Transports |
12,506.93 |
16,218.01 |
(1.8)% |
29.7% |
up (weak) |
up |
up |
|
|
NASDAQ |
12,888.28 |
15,491.66 (new highs) |
(3.5)% |
20.2% |
up (weak) |
up |
up |
|
|
S&P/TSX Composite |
17,433.36 |
21,125.90 |
(2.0)% |
21.2% |
neutral |
up |
up |
|
|
S&P/TSX Venture (CDNX) |
875.36 |
944.05 |
(5.0)% |
7.9% |
neutral |
up (weak) |
up |
|
|
S&P 600 |
1,118.93 |
1,376.33 |
(3.3)% |
23.0% |
down |
up |
up |
|
|
MSCI World Index |
2,140.71 |
2,333.80 |
(1.8)% |
9.0% |
down (weak) |
neutral |
up |
|
|
NYSE Bitcoin Index |
28,775.36 |
54,488.09 |
(6.1)% |
89.4% |
down |
up |
up |
|
|
|
|
|
|
|
|
|
|
|
|
Gold Mining Stock Indices |
|
|
|
|
|
|
|
|
|
Gold Bugs Index (HUI) |
299.64 |
256.02 |
(4.3)% |
(14.6)% |
neutral |
down (weak) |
up (weak) |
|
|
TSX Gold Index (TGD) |
315.29 |
286.80 |
(4.1)% |
(9.0)% |
neutral |
neutral |
up (weak) |
|
|
|
|
|
|
|
|
|
|
|
|
Fixed Income Yields/Spreads |
|
|
|
|
|
|
|
|
|
U.S. 10-Year Treasury Bond yield |
0.91 |
1.48% |
(3.9)% |
62.6% |
|
|
|
|
|
Cdn. 10-Year Bond CGB yield |
0.68 |
1.60% |
(3.6)% |
135.3% |
|
|
|
|
|
Recession Watch Spreads |
|
|
|
|
|
|
|
|
|
U.S. 2-year 10-year Treasury spread |
0.79 |
0.98% |
(4.9)% |
24.1% |
|
|
|
|
|
Cdn 2-year 10-year CGB spread |
0.48 |
0.67% |
(2.9)% |
39.6% |
|
|
|
|
|
|
|
|
|
|
|
|
|
|
|
Currencies |
|
|
|
|
|
|
|
|
|
US$ Index |
89.89 |
96.10 (new highs) |
0.1% |
6.9% |
up |
up |
neutral |
|
|
Canadian $ |
0.7830 |
0.7830 |
(0.9)% |
(0.1)% |
down |
down |
up (weak) |
|
|
Euro |
122.39 |
113.11 |
0.2% |
(7.6)% |
down |
down |
neutral |
|
|
Swiss Franc |
113.14 |
108.39 |
0.6% |
(4.2)% |
neutral |
down |
up |
|
|
British Pound |
136.72 |
133.40 |
(0.8)% |
(2.4)% |
down |
down |
up |
|
|
Japanese Yen |
96.87 |
88.29 |
0.7% |
(8.9)% |
neutral |
down |
down |
|
|
|
|
|
|
|
|
|
|
|
|
|
|
|
|
|
|
|
|
|
|
Precious Metals |
|
|
|
|
|
|
|
|
|
Gold |
1,895.10 |
1,785.50 |
(3.6)% |
(5.8)% |
neutral |
up |
up |
|
|
Silver |
26.41 |
23.11 |
(6.8)% |
(12.5)% |
down |
down |
up |
|
|
Platinum |
1,079.20 |
954.30 |
(7.9)% |
(11.6)% |
down |
down |
up (weak) |
|
|
|
|
|
|
|
|
|
|
|
|
Base Metals |
|
|
|
|
|
|
|
|
|
Palladium |
2,453.80 |
1,781.20 |
(14.1)% |
(27.4)% |
down |
down |
neutral |
|
|
Copper |
3.52 |
4.29 |
(2.7)% |
21.9% |
down (weak) |
neutral |
up |
|
|
|
|
|
|
|
|
|
|
|
|
Energy |
|
|
|
|
|
|
|
|
|
WTI Oil |
48.52 |
68.15 |
(10.3)% |
40.5% |
down |
neutral |
up |
|
|
Natural Gas |
2.54 |
5.48 |
8.1% |
115.8% |
neutral |
up |
up |
|
Source: www.stockcharts.com, David Chapman
Note: For an explanation of the trends, see the glossary at the end of this article.
New highs/lows refer to new 52-week highs/lows and, in some cases, all-time highs.
Source: www.stockcharts.com
They called it “Black Friday” and “Black Friday” it was. No, we are not talking about the Thanksgiving sale at Nordstrom’s. We are talking about the plunge in the stock markets on Friday, November 26, 2021. It was somewhat unexpected, even though we noted a number of negative divergences the previous week that were signaling all was not well. Turned out that, indeed, all was not well as the B.1.1.529 mutant variant of COVID reared its ugly head. What? Who? Where?
What is B.1.1.529 - a new variant of COVID-19. Who is B.1.1.529 - a new mutant. Where is B.1.1.529 - South Africa where it was first identified, but it may already be spreading as more cases were found in Botswana, Belgium, Israel, and Hong Kong. Now we learn that the U.K. has cases as does the Netherlands. More countries including the U.S. and Canada could follow. What happened? Global stocks plunged, oil crashed, the U.S. dollar fell, bond yields fell, and gold, after acting like the safe haven it should, reversed and closed mildly off as well. Oh yes, and borders shut down as flights were banned. Lockdowns are underway. Fear is in the air. Merry Christmas.
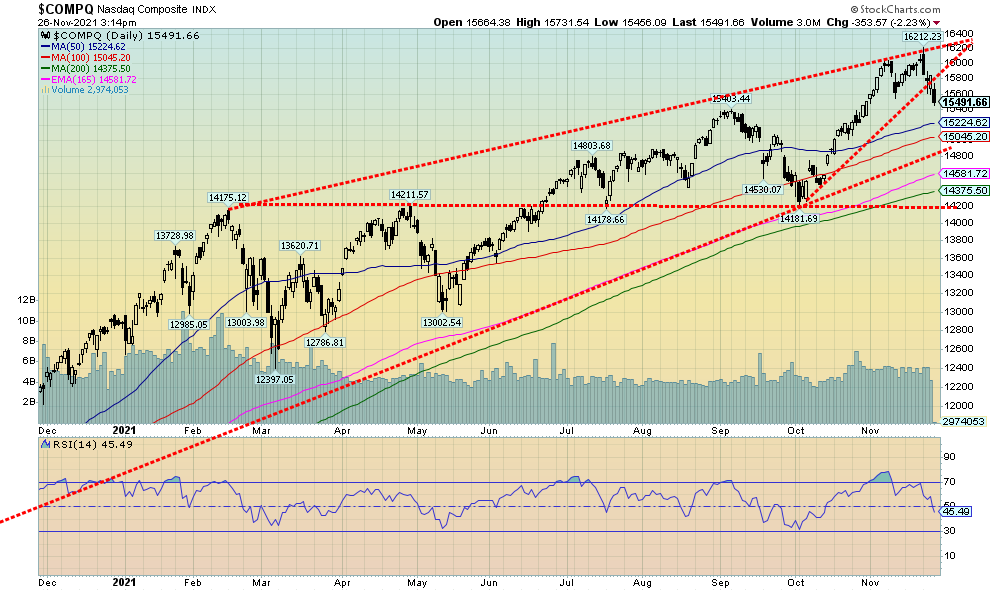
The Thanksgiving-shortened week ended badly with the S&P 500 closing down 2.2%. The Dow Jones Industrials (DJI) fell 2.0%, the Dow Jones Transportations (DJT) was off 3.5%, and while the NASDAQ made new all-time highs on the week (the only major index to do so), it closed the week down 3.5%. The NASDAQ may also be portending more grief as the index put in an outside reversal week known as key reversal week. That means it made new all-time highs, then reversed, closing lower below the low of the previous week. The NASDAQ was
not the only index making new all-time highs, then reversing and closing lower. Joining the NASDAQ in a key reversal week was the NASDAQ 100, down 3.3%, the S&P 100 (OEX), down 2.3%, and the Russell 1000, off 1.9%. We note another divergence in that the OEX made new all-time highs but the S&P 500 did not nor did the S&P 500 Equal Weight Index (SPXEW).
However, the carnage didn’t stop at the U.S. border. The TSX Composite fell 2.0% while the TSX Venture Exchange (CDNX) was down 5.0%. Bitcoin lost 6.1% and its short-term trend has turned down. In the EU, the London FTSE was off 2.7%, while the Paris CAC 40 gapped down, ending the week off 5.2%. The German DAX also gapped down and closed the week down 5.6%. In Asia, China’s Shanghai Index (SSEC) seems, so far, to have escaped the carnage as it closed up 0.1% on the week. The Tokyo Nikkei Dow (TKN) wasn’t so lucky, losing 3.3% this past week. The MSCI World Index lost 1.8% and could be poised to lose more this coming week.
What’s next? Markets appear to be undergoing a potentially significant decline. That could occur, especially if this new variant B.1.1.529 proves to be highly contagious (early indications are that it is) and economies are forced to shut down once again. That, of course, would be a disaster. Numerous businesses that are barely clinging now would most likely fail. Unemployment could rise sharply again. Protests and violence could erupt (already happening). And government budgets already in massive deficit could then get even worse.
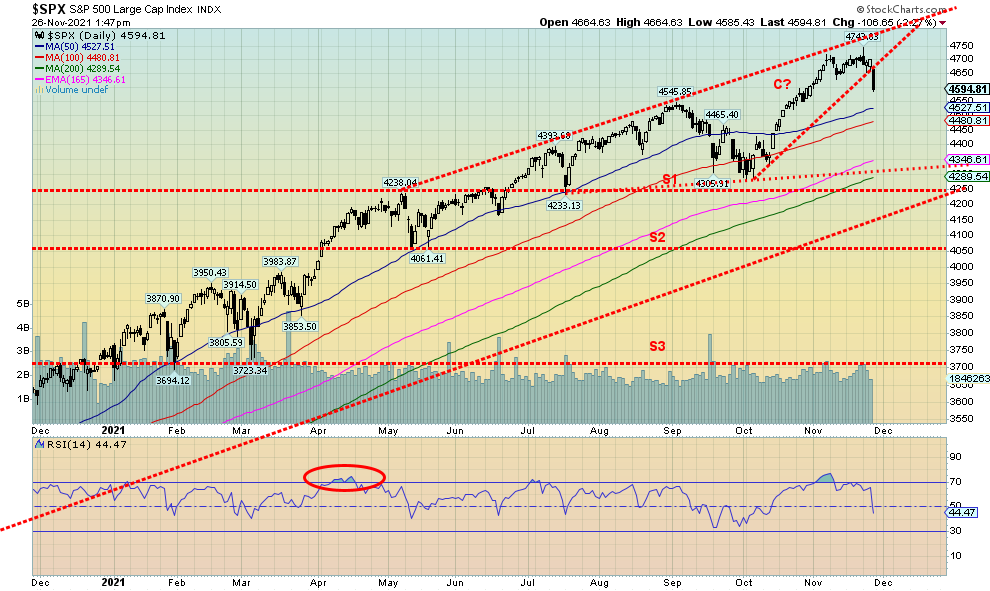
The S&P 500 has broken what appears as a potential ascending wedge triangle. That’s bearish and projects down to at a minimum the major support line near 4,300. A firm breakdown under 4,300 and especially under 4,250 could trigger a very swift sell-off. Markets more or less gapped down on Friday and that also portends poorly going forward. Only regaining 4,700 could save the market from a bigger disaster. The first area of support is the 50-day MA, currently near 4,525. Further support is seen at the 100-day MA near 4,480. It should also be noted that the small-cap stocks fared even worse this past week as the S&P 600 fell 3.3% and the Russell 2000 dropped 4.2%, including a 3.8% drop on Friday. The Russell 2000 also closed below its 200-day MA, a bad sign.
We wonder how many gagged on their turkey as a result of the “Black Friday” wipe-out.
Source: www.stockcharts.com
The NASDAQ put in an outside week key reversal as it made new all-time highs again, then reversed, taking out the low of the previous week and closing below the low of the previous week. On the week, the NASDAQ lost 3.5%, the steepest decline for the major indices. One could argue that the FAANGs led the way. Despite new all-time highs for both Apple and Nvidia, both reversed and closed lower. Apple fell 1.9% while Nvidia was down 3.5%. Elsewhere, Facebook (Meta) was off 3.1%, Amazon lost a steep 4.2%, Netflix dropped 1.3%, Google was down 4.2%, Microsoft off 3.3%, Tesla down 4.6%, Twitter down 2.7%, Baidu lost only 0.5%, and Alibaba was down 5.3%. Compare all those to Berkshire Hathaway representing value stocks, as it actually gained 1.5% on the week. The NASDAQ has now broken what might be an ascending wedge triangle. Potential targets are down to at least 14,800 and in a worst-case scenario (for the moment) down to 14,200. Note we took out that last daily low at 15,543. We now focus on the last weekly low of 14,182 seen in early October. That level coincides with one of our potential targets. Regaining above 15,900 would be positive. But the key reversal seen on Friday suggests to us that at least a temporary top is in. The question is, how low do we go? We still remember December 2018 when the markets fell almost 20% from a high.
Source: www.stockcharts.com
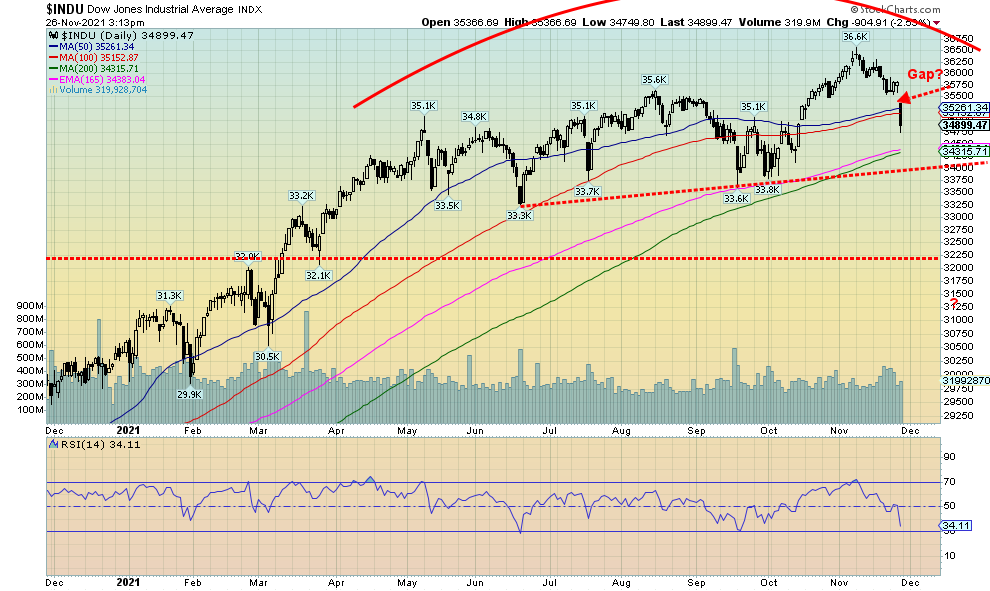
The DJI, unlike the other indices, gapped down on Friday. While it remains to be seen, the gap has all the earmarks of a breakaway gap, meaning a stock, index, etc. just breaks away from where it was. Breakaway gaps can occur at both tops and bottoms. The gap is only 225 points. The implications are that the DJI could continue its downward thrust into this coming week. If the DJI were able to fill the gap and then take out 36,000, then new highs could be coming. The DJI gapped and closed below both the 50 and 100-day MAs. The RSI at 34 is fast approaching oversold if it falls under 30. The short-term (daily) trend for the DJI has turned down, diverging with the other indices that have only seen their short-term trend weaken. Support is seen below at the 200-day MA (34,315) and at 34,000.
Source: www.stockcharts.com
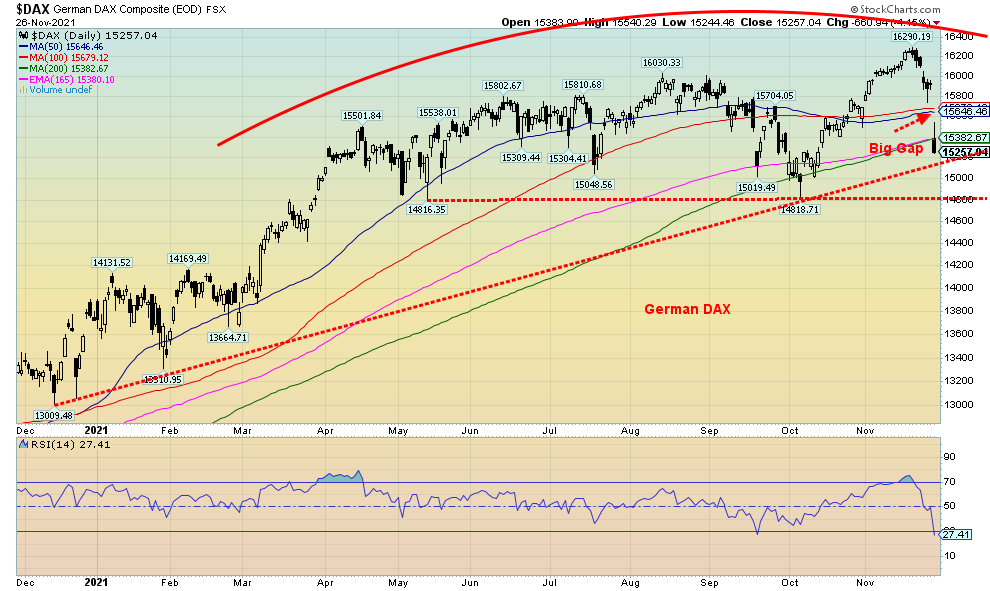
Here is the German DAX. Note the huge gap down on Friday. That’s a dangerous looking breakaway gap. We also closed below the 200-day MA. But the RSI is quickly oversold. And the last time in early October when the DAX briefly fell below the 200-day MA it rebounded to new all-time highs. Below is a trend support line so a breakdown under 15,125 could prove problematic. Under 14,800 things get quite dangerous. Only filling the gap and regaining above 16,000 might save this.
Source: www.stockcharts.com
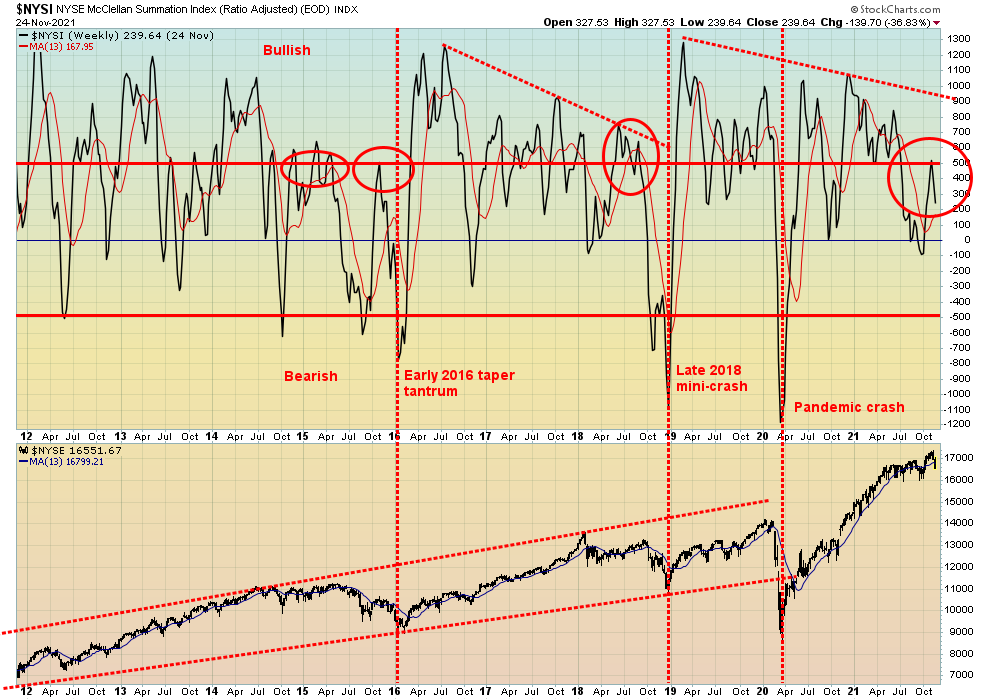
The McClellan Summation Index (ratio-adjusted), known as the RASI, shows the divergences that set up before a decline. The RASI most recently failed to regain 500 that would have once again thrust the market back into bullish territory. Instead, it failed and has turned down. The most recent high in the RASI was sharply below earlier highs despite the S&P 500 moving itself to new all-time highs. Note similar divergences being seen before the taper tantrum in late 2015/early 2016. Next up was the late 2018 mini-crash (20%) that also saw the RASI diverging sharply with previous highs, even as the S&P 500 made new highs. The final divergence was before the March 2020 pandemic crash. The RASI made a lower high. Divergences such as these are often seen before corrective periods. No, it does not tell us how steep the correction will be. The 2016 decline was only 14.5%, the 2018 decline fell less than 20%, while the 2020 crash saw the DJI drop 37.1%. All it tells us is that a decline is coming, but it doesn’t tell us how much it could decline.
Source: www.stockcharts.com
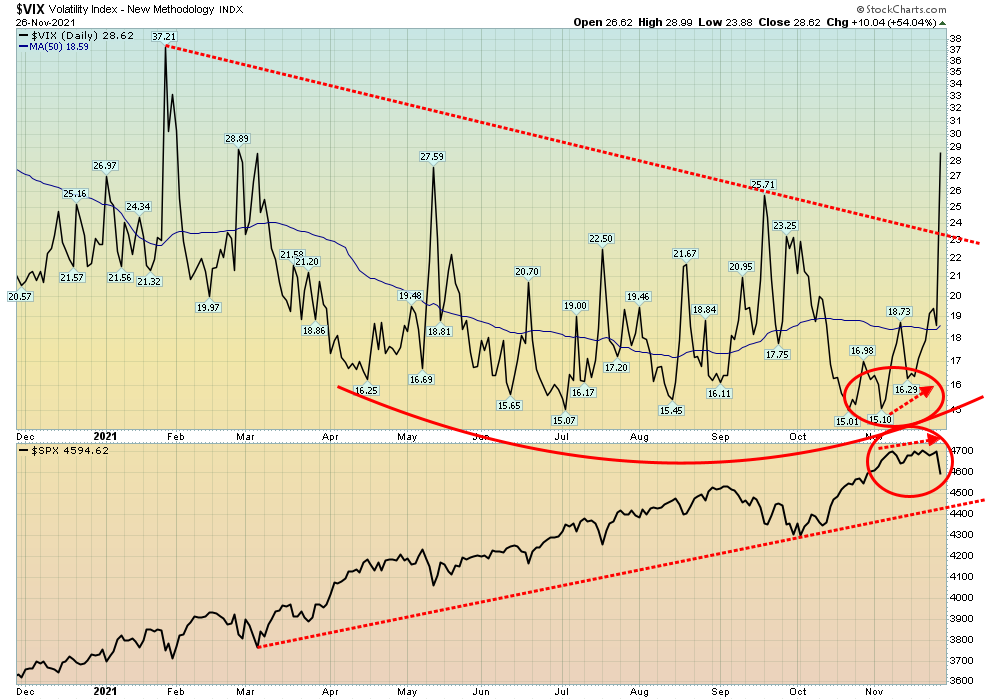
A big spike in volatility as the VIX Volatility Index hits its highest level since Jan 2021. It also has broken a downtrend line suggesting the VIX could spike even higher. The last peak level was seen in March 2020 at 82.69. Note the divergence at the recent S&P 500 high. Even as the S&P 500 was trying to crawl higher the VIX was also rising (the VIX moves inversely to the S&P 500). A divergence portending a possible spike in volatility. We got that in spades on Friday.
Source: www.tradingeconomics.com, www.bea.gov
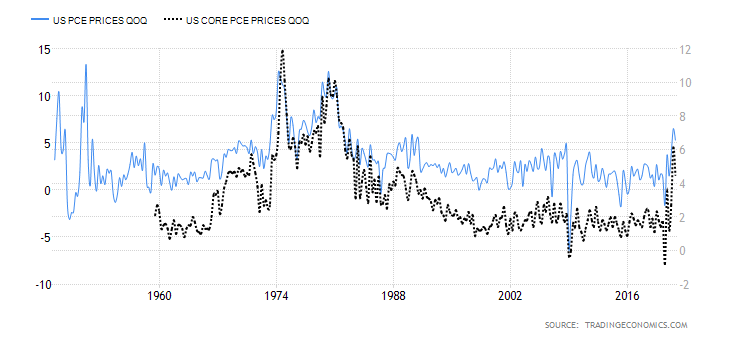
The Fed tends to put higher stead in the personal consumption expenditures inflation (PCE) over the CPI and the PPI. Here the most recent PCE in Q3 came in at 5.3% vs. 6.5% in Q2. The core PCE was 4.5% vs. 6.1%. Has inflation peaked? The previous quarter was the highest level seen 1990 and the Q2 number was the highest since 1983. The fact that the Q3 PCE was lower would help the Fed in trying to make a decision as to interest rates. Given it has come down, the Fed is not likely to act on any hikes until they see the PCE stabilize at high levels or go higher. If PCE begins to fall it would support the Fed’s take that inflation is transitory. Still, it is worth noting and cannot be ignored.
Source: www.tradingeconomics.com, www.bls.gov
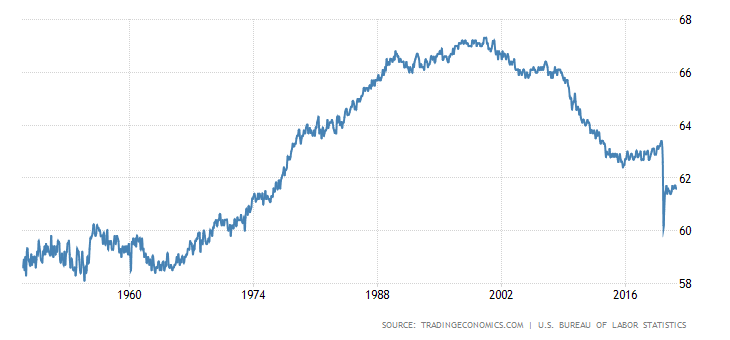
The labour force participation rate remains stuck at low levels, last at 61.6% in October 2021. Those levels were last seen in the mid-1970s. In January 2020 the labour force participation rate was 63.4%. Today that would translate into an additional 4.6 million workers either employed or seeking work. And they wonder where the labour shortage is coming from when the number actually in the labour force has fallen sharply. If these workers were unemployed, then the unemployment rate (U3) would rise from the current 4.6% to 7.6%. As we have often noted, a higher labour force participation rate would translate into higher unemployment rate, assuming the additional numbers were not working.
Source: www.stockcharts.com
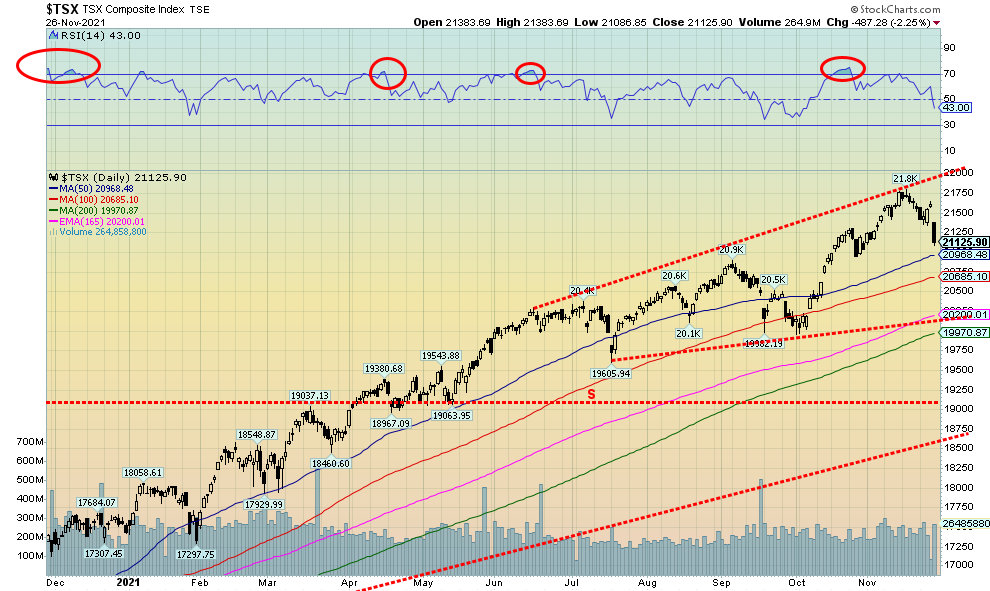
The TSX Composite followed the U.S. indices to the downside as the TSX lost a sharp 2.3% on Friday. On the week the TSX fell 2.0%. No new highs were seen. The TSX Venture Exchange (CDNX) fared worse, off 5.0% on the week. Thirteen of the 14 sub-indices were down on the week. The only one to survive was Energy (TEN) with a small gain of 0.7%. However, given that the TEN fell sharply on Friday it might see further losses early this coming week. Leading the way to the downside was Information Technology (TKK), down 4.9%. Surprisingly, Consumer Staples (TCS) fell 4.2% while Golds (TGD) were down 4.1%. All in all, not a good week for the TSX and its components. Friday the TSX fell away. The gap drop suggests more losses could follow early this coming week. Support is just below 21,000 but major longer-term support is seen down at 20,200. Under 19,900 the market could become more dangerous. A drop to longer-term support could suggest a decline of about 7.5% overall. Don’t forget that we are now into the heart of tax-loss selling season so there could be more selling coming as a result. As well, given the decline on Friday, others might also be inclined to protect profits for the year.
U.S. 10-year Treasury Bond/Canadian 10-year Government Bond (CGB)
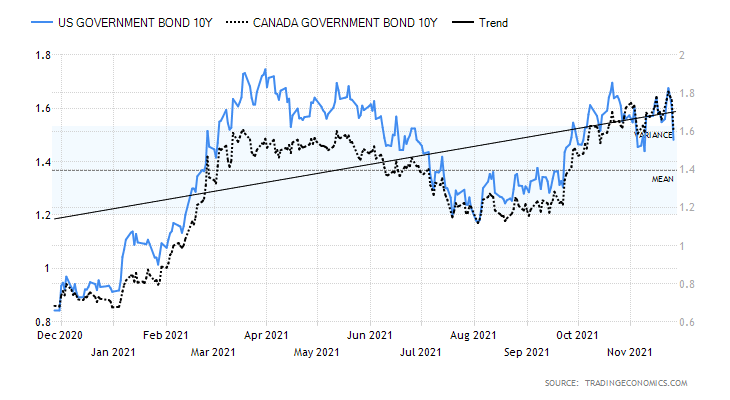
Source: www.tradingeconomics.com, www.home.treasury.gov, www.bankofcanada.ca
We suppose if there is one positive out of the COVID B.1.1.529 variant, it is that interest rates fell on Friday. The U.S. 10-year treasury note fell on the week to 1.48% from 1.54% the previous week. We now have a situation suggesting that interest rates could fall further. The recent high was 1.70%, seen on October 21. That high failed the 1.75% high of March 31. The high on November 23 was at 1.69%, failing the October 21 high. That suggested there might be a failure in process. A break now below the recent low of 1.45% would confirm that thought and the 10-year could fall to potential targets at 1.20%. If the August 4 low of 1.18% were to break, then potential targets could become 0.60%. Why would we fall to those levels? If the COVID B.1.1.529 turned into a monster that shut down the world again, interest rates would plunge just as they did in March 2020. The lows were seen on March 9, 2020 at 0.50%. The other side of a global shutdown is that inflation could fall quickly. However, another global shutdown could exacerbate the already frayed and disrupted supply chains and make things even worse. It was also interesting that the 2–10 spread fell this week as well to 0.98% from 1.03%. It is the first time under 1.00% since January 2021. The 2–10 spread hit a low of negative 0.04% back in August 2019, portending the coming COVID-induced recession.
Canada followed the U.S. lower as the Canadian 10-year Government of Canada bond (CGB) fell to 1.6% from 1.66%. The 2–10 spread fell to 0.67% from 0.69% as yield curves continue a flattening process.
Economic numbers for the week were all compressed into the first three days as Thursday was the Thanksgiving holiday and Friday was a dead, shortened day. Despite the shortened week there were a number of economic numbers released. We noted the PCE prices earlier. Other highlights were existing home sales which rose 0.8% in October, well above the expected decline of 1.0%. The MARKIT Manufacturing Index came in at 59.1 for November, slightly above the expected 58.8. Durable goods fell 0.5% in October vs. an expectation of a gain of 0.3%. The GDP price index for Q3 was 4.2% which was slightly better than the expected 5.7% but under the previous report of a 6.2%. Initial jobless claims fell below 200,000, coming in at 199,000 which was well below the expected 264,000. Could this portend well for this coming Friday’s job report? Yes, the November jobs report is out on November 3 and the market is looking for a nonfarm payroll number of 550,000 vs. 531,000 in October. The unemployment rate is expected to remain unchanged at 4.6%. Canada will also release its November jobs report and they are expecting a gain of 45,000 jobs vs. 31,200 in October. The unemployment rate is expected to fall to 6.6% from 6.7%. Could the new COVID variant impact the report? It may be too soon to say.
The fall in interest rates this past week suggests that further declines could be on the way. If the 10-year were to regain back above 1.60% then all bets are off for lower rates.
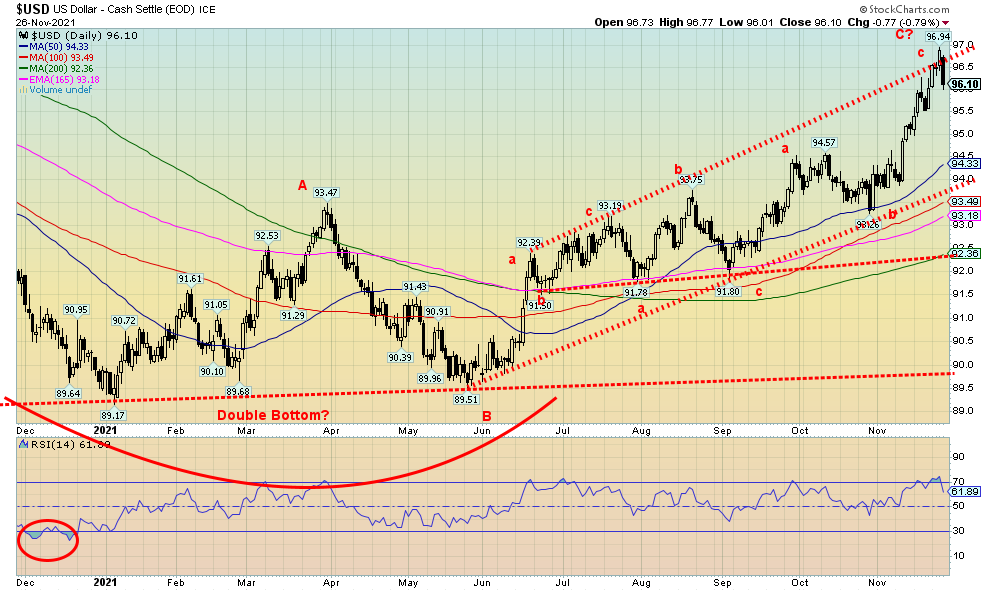
Source: www.stockcharts.com
Has the U.S. dollar topped? The global response to the new COVID variant sparked a sharp sell-off in the stock markets and elsewhere. The US$ Index fell 0.8% on Friday, although on the week the US$ Index held together with a small gain of 0.1%. The euro rose 0.2% on the week and the Swiss franc was up 0.6%, but the pound sterling was down 0.8%. The Japanese yen was up 0.7% but the Canadian dollar fell 0.9%. The currencies, we suspect, benefitted from repatriation of funds. With the stock market falling sharply on Friday we suspect there were foreign funds selling and then converting the proceeds to their home currency yen and euros. The Canadian dollar suffered because of the sharp decline for oil on Friday. If we are correct about the currencies, then it is possible the US$ Index has topped. We note what appears to be the overthrow of the upper channel. A break below 95.50 could begin to confirm that a top is in, but we’d really want to see a decline below 94.60 to absolutely confirm a top. Only a move back above 96.75 might suggest that there is more upside for the US$ Index. However, the decline on Friday looks impulsive and our suspicion is that a top is in.
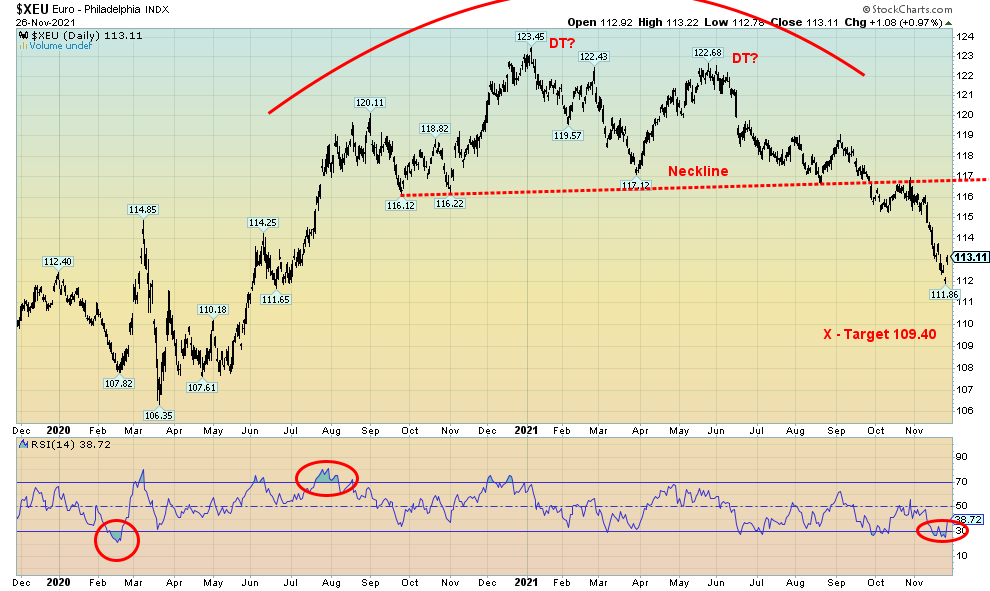
Source: www.stockcharts.com
The euro is the mirror image of the US$ Index. Well, maybe not quite. The euro fell from what appears as a huge double top. Targets were potentially down to 109.40. We didn’t quite achieve that with a low thus far of 111.86. So, it remains possible that the euro could still fulfill its targets. Although we freely admit it is not essential as it achieved more than just the minimum targets. At the low the RSI was under 30 suggesting the euro was oversold. As well not only the euro but also the Japanese yen, and, the pound sterling have seen a jump in the long open interest for the commercial COT. That suggests that commercials are getting long the currencies and shorting the U.S. dollar. We’re following the commercials.
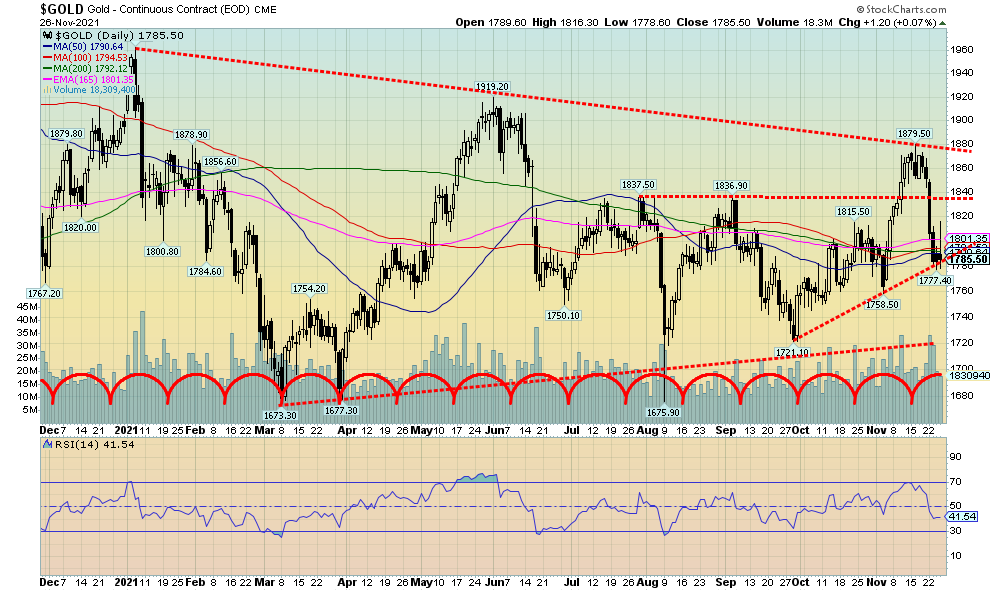
Source: www.stockcharts.com
It was a very unpleasant week for the gold bugs. Gold fell 3.6%, primarily in response to the reappointment of Fed Chair Jerome Powell. But even on Friday with the news of potential shutdowns looming because of the sudden rise of the COVID variant B.1.1.529, gold could not hold its early gains that saw it shoot up to $1,816 before falling, seemingly in sympathy with the mini-crash in the stock market. In the end gold closed the week at $1,785. In a slight divergence to silver, at least for the moment, gold held above its November 3 low of $1,758. Gold more or less held its uptrend line but it is endangered. A break below $1,758 would then focus us on the October low of $1,721. Below $1,720 and especially under $1,700 new lows are very likely that could see gold fall towards $1,600. A breakdown to new lows would also bust the possible big-picture cup and handle pattern as the handle could then be in jeopardy. Gold needs to regain back above $1,840 to suggest that we could again attempt to break out over $1,880. $1,900 and higher seems far away right now.
The other metals did not fare as well as gold. Silver fell 6.8%, platinum was down 7.9%, while the near precious metals palladium dropped 14.1% and copper fell 2.7%. Both of these metals are primarily used for industrial purposes, as is silver. So, any slowdown in the global economy could negatively impact their demand.
The sharp rise in the U.S. dollar did not help gold this past week. However, given the sharp downward thrust for the US$ Index on Friday, gold might find some stability here and start heading back up. The RSI is at 41 so there is some room for further declines before gold would become oversold.
Because of the Thanksgiving holiday the COT report won’t be released until Monday.
Source: www.stockcharts.com
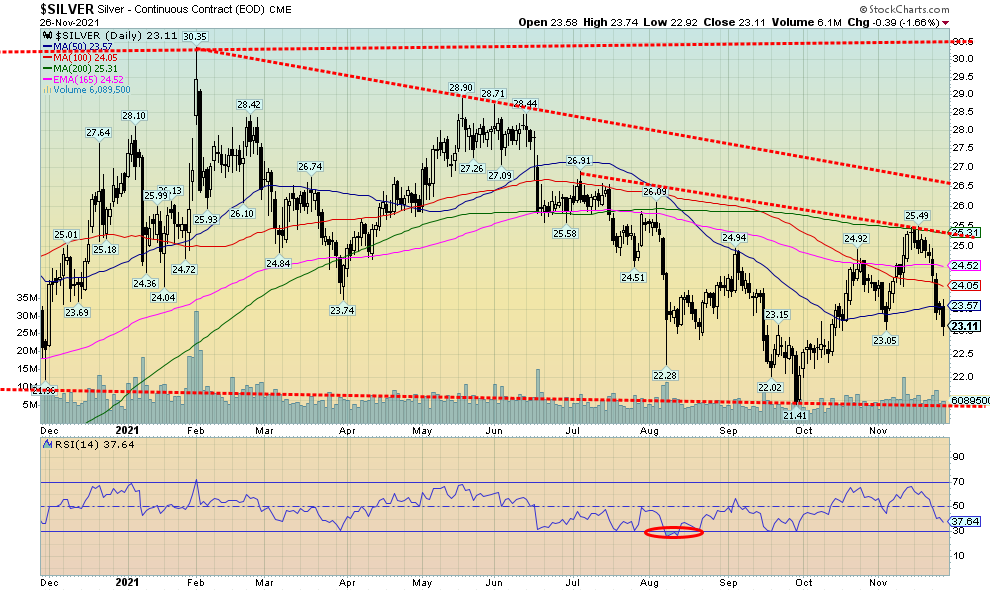
Between the reappointment of Jerome Powell and the spooked markets over the new COVID variant, silver did not have a good week. The sharp drop of 6.8%, almost double the % decline for gold, was probably sparked as much by silver’s role as an industrial metal. Given how much silver is used in manufacturing, especially for renewables, EVs and computers, any potential global economic slowdown for the world because of the COVID variant could negatively impact silver and all industrial metals. With a low on Friday of $22.92 it took out the low of November 3 at $23.05. This could suggest that silver could see further losses. The next key level of support is around $22.50. Below $22.35 new lows under the October low of $21.41 are probable. Only regaining back above $24.50 could suggest that a low is in. In taking out the earlier $23.05 low, silver did a non-confirmation with gold as gold did not take out its comparable low of that day. However, the negative week underlines the challenges that lie ahead, even if the longer-term picture remains positive. The short-term picture is not so clear any longer and new lows are possible before this is finished.
As with gold, there was no COT report this past week.
Source: www.stockcharts.com
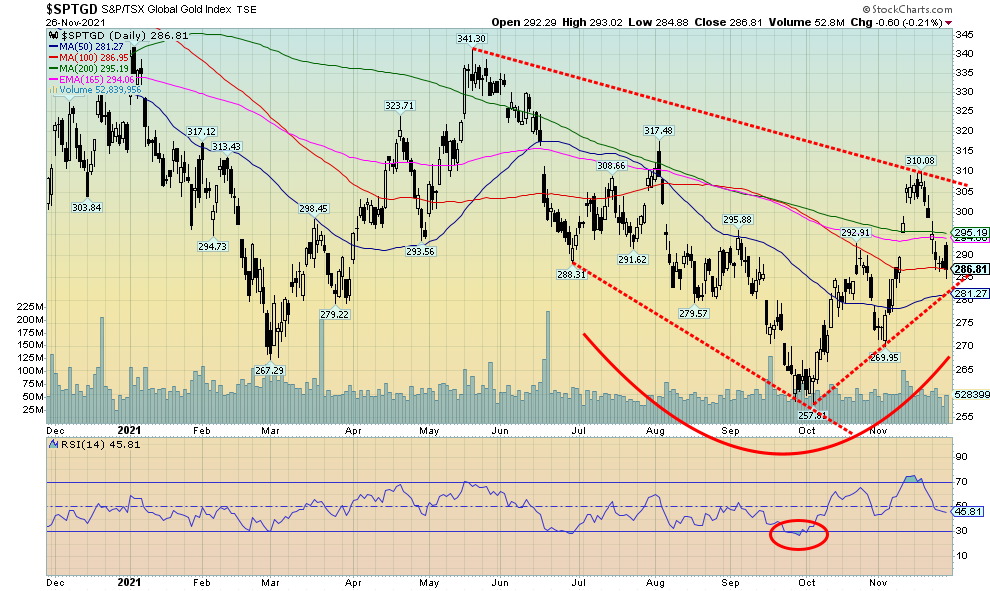
Gold stocks followed gold and silver this past week. On Friday, with gold up roughly $20 early on, the gold stocks found a bid but as gold lost altitude so did the gold stocks. On the week the TSX Gold Index (TGD) fell 4.1% while the Gold Bugs Index (HUI) was down 4.3%. It was the second successive weekly decline. Still, the TGD remains up 11.2% from the recent low although off 7.5% from the recent high. At the recent high the TGD and HUI were showing signs of being overbought. The TGD did find support at the 100-day MA. Trendline support lies below near 281. A breakdown under 280 could spark further losses towards 270 support. Under 270 new lows are possible. The Gold Miners Bullish Percent Index (BPGDM) has eased a bit to 43 from 46. Overall, the indicator remains neutral at these levels. The trends are also neutral both short-term and intermediate term. The HUI has seen its intermediate trend turn slightly negative. The TGD regaining above 295 would be positive but the TGD would need to rise above 300/303 to suggest new highs above 310. Overall, a bottom pattern appears to remain in play. That pattern would be busted only if the TGD were to fall back below 270. Below that new lows under 258 are possible.
Source: www.stockcharts.com
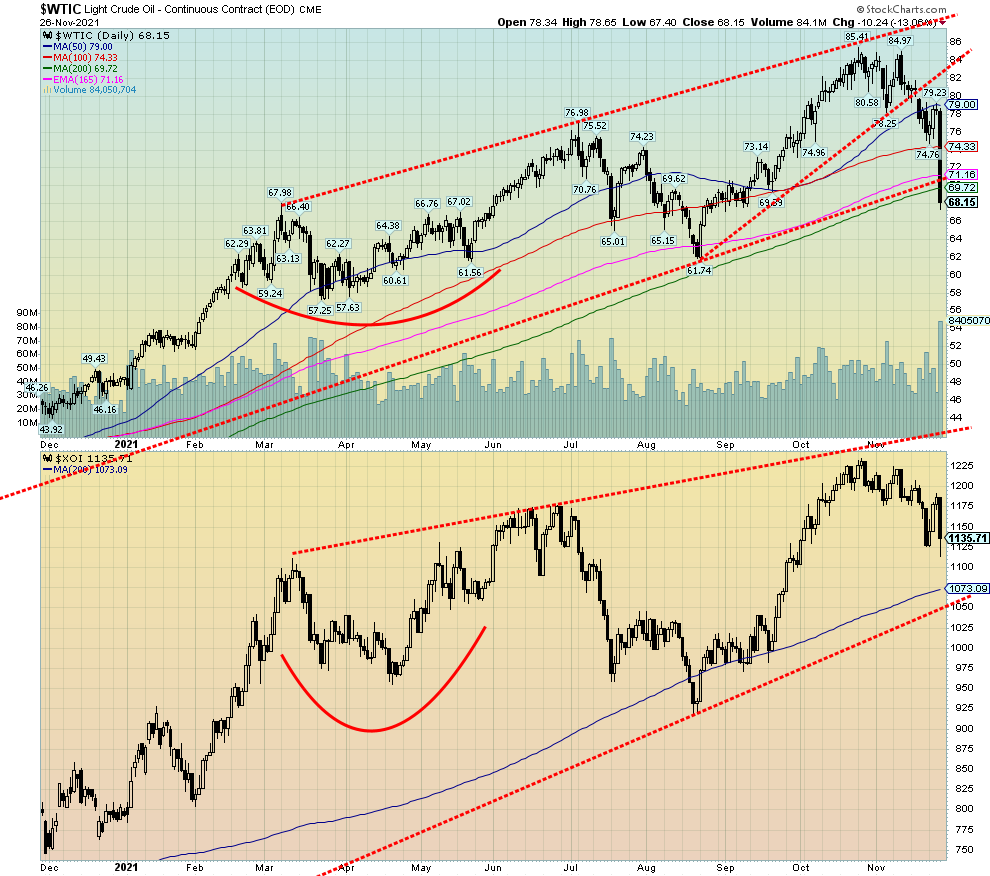
We previously noted that the breakdown by WTI oil from what appeared as an ascending wedge triangle could target prices down to the uptrend line and the 200-day MA near $70/$71. Well, we accomplished that and then some as WTI oil plunged 10.3% this past week. Renewed COVID fears were the catalyst. Strangely enough, the announced release earlier in the week from the Strategic Petroleum Reserves (SPR) did not have the impact everyone thought it would. After initially falling slightly, oil prices rose again. But Friday was a crash as WTI oil fell a sharp 13.1%. Natural gas (NG) did not join the crash parade as NG prices rose 8.1% on the week. As to the energy stocks, they did fall Friday but the TSX Energy Index (TEN) managed to close up on the week by 0.7% while the ARCA Oil & Gas Index (XOI) also was in the green by 0.7%.
Next up is the December 2 meeting of OPEC. What will they do? Leave things as they are, or lower production limits for 2022, thus putting some upward push for prices? The Saudis, in order to pay for all their programs, need $70 or more while oil sands producers and even shale producers need $80 to be viable, although that can vary. There was talk that China might also release from their SPR but so far, they are non-committal. As well, we learned that OPEC may still consider production cuts if the U.S., China, and others are to continue to release from the SPRs.
Technically, WTI oil is now in a potential zone of support despite overshooting the support line and the 200-day MA. As well, the RSI has fallen under 30, indicating oversold. But if oil were to fall further and break under $65 then that could set up further declines. We doubt that at this time and our expectations are that WTI oil will find some level of support here. To the upside, it needs to regain back above $74 to suggest that a low might be in. The XOI has considerable support down to 1,000/1,100. Given the close on Friday at 1,135, those levels are most likely achievable early this week. Below 1,000 there is some support at 980 and better support at 950.
The good news out of all of this is, drivers should see a reduction at the pump.
Copyright David Chapman, 2021
|
GLOSSARY
Trends
Daily – Short-term trend (For swing traders) Weekly – Intermediate-term trend (For long-term trend followers) Monthly – Long-term secular trend (For long-term trend followers) Up – The trend is up. Down – The trend is down Neutral – Indicators are mostly neutral. A trend change might be in the offing. Weak – The trend is still up or down but it is weakening. It is also a sign that the trend might change. Topping – Indicators are suggesting that while the trend remains up there are considerable signs that suggest that the market is topping. Bottoming – Indicators are suggesting that while the trend is down there are considerable signs that suggest that the market is bottoming. |
David Chapman is not a registered advisory service and is not an exempt market dealer (EMD) nor a licensed financial advisor. He does not and cannot give individualised market advice. David Chapman has worked in the financial industry for over 40 years including large financial corporations, banks, and investment dealers. The information in this newsletter is intended only for informational and educational purposes. It should not be construed as an offer, a solicitation of an offer or sale of any security. Every effort is made to provide accurate and complete information. However, we cannot guarantee that there will be no errors. We make no claims, promises or guarantees about the accuracy, completeness, or adequacy of the contents of this commentary and expressly disclaim liability for errors and omissions in the contents of this commentary. David Chapman will always use his best efforts to ensure the accuracy and timeliness of all information. The reader assumes all risk when trading in securities and David Chapman advises consulting a licensed professional financial advisor or portfolio manager such as Enriched Investing Incorporated before proceeding with any trade or idea presented in this newsletter. David Chapman may own shares in companies mentioned in this newsletter. Before making an investment, prospective investors should review each security’s offering documents which summarize the objectives, fees, expenses and associated risks. David Chapman shares his ideas and opinions for informational and educational purposes only and expects the reader to perform due diligence before considering a position in any security. That includes consulting with your own licensed professional financial advisor such as Enriched Investing Incorporated. Performance is not guaranteed, values change frequently, and past performance may not be repeated.
About the author


Website: https://www.enrichedinvesting.com
Disclaimer: David Chapman is not a registered advisory service and is not an exempt market dealer (EMD) nor a licensed financial advisor. We do not and cannot give individualised market advice. David Chapman has worked in the financial industry for over 40 years including large financial corporations, banks, and investment dealers. The information in this newsletter is intended only for informational and educational purposes. It should not be considered a solicitation of an offer or sale of any security. The reader assumes all risk when trading in securities and David Chapman advises consulting a licensed professional financial advisor before proceeding with any trade or idea presented in this newsletter. David Chapman may own shares in companies mentioned in this newsletter. We share our ideas and opinions for informational and educational purposes only and expect the reader to perform due diligence before considering a position in any security. That includes consulting with your own licensed professional financial advisor.