
The war against Iran rages on. It's a matter of when not if, this could impact the global economy given that not just oil and gas are being impacted but a host of agriculture products and other products needed to run the global economy. The most recent PPI report jumped more than expected. That eventually feeds into the CPI and PCE. A sliding economy and rising inflation. We've seen it before with the 1970's stagflation.
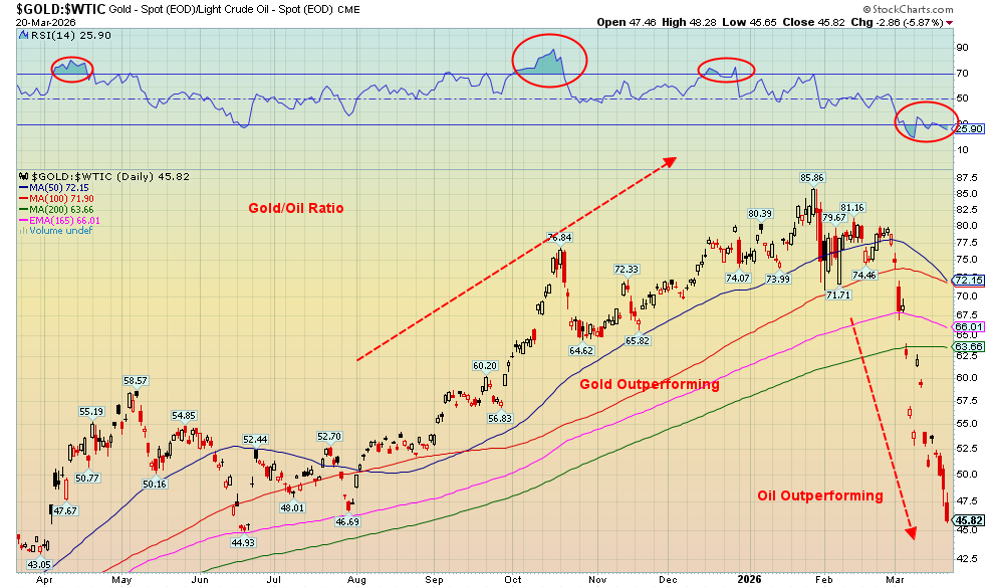
Nonetheless right now the EU and Asia are being more impacted than North/South America. Explains why Brent crude spreads vs WTI Oil have been rising. Spreads are also rising between EU NG at the Dutch Hub vs. North American NG at the Henry Hub. All economies are at risk but possibly more so the EU and Asia.
President Trump talks about winding down the war on one hand then they send more warships and marines, ask for more funds and threaten power plants.
The Fed and the Bank of Canada left interest rates unchanged as was widely expected. Inflation remains elevated. Private equity and credit jitters continue. A major blow up there could threaten the global financial system. Airline stocks have been falling (crashing?) so we look at Air Canada as our chart of the week.
The week was a sea of red ink (mostly) except for oil and gas. Enerflex Ltd., for example, providing infrastructure for energy companies, reported increased revenue, higher gross margin, reduced net debt, expanded free cashflow, pays a dividend, and is held in the Enriched Capital Conservative Growth Strategy.* Gold and the precious metals have entered oversold territory. Could a rebound be in the offing? Ditto for the stock market that now sits on the edge of a bigger breakdown. Bond yields jumped again and are threatening to go higher. The Fed is caught between a rock and a hard place. If another global financial crisis took place the Fed and other central banks do not have the wherewithal they had during the 2008 financial crisis and the pandemic. A concern as we continue to hurtle into the unknown.
Spring is here. We saw a robin. The baseball season starts this week. Have a great week.
DC
* Reference to the Enriched Capital Conservative Growth Strategy and its investments, celebrating an
8.08 - year history of 188% growth (annual 14%), is added by Margaret Samuel, President, CEO and Portfolio Manager of Enriched Investing Incorporated, who can be reached at 416-203-3028 or msamuel@enrichedinvesting.com This information should not be construed as an offer, or a solicitation of an offer or sale of any security. Past performance does not guarantee future returns.
"Buy on the sound of cannons, sell on the sound of trumpets."
—attributed to Nathan Rothschild, British-German banker, businessman, financier, founder of the British branch of the Rothschild’s; 1777–1836
“In the 20th century, the United States endured two world wars… yet the Dow rose from 66 to 11,497.”
—Warren Buffett, American investor, philanthropist, chairman and former CEO of Berkshire Hathaway (BRK.A), ranked as the ninth-richest person in the world; b. 1930
“In the midst of chaos, there is also opportunity.”
—Sun Tsu, Chinese military general, strategist, philosopher, through the Eastern Zhou Period 771–256 BC, author of The Art of War; 544–446 BC
Iran war continues
Iran war, week three. Little has changed. The Straits of Hormuz are still mostly closed. Bombs land daily on Israel, on energy facilities in Iran plus oil and gas producing countries like the UAE, Bahrain, Saudi Arabia, and Qatar, on military bases of the U.S., and on oil tankers and cargo ships in the Persian Gulf. Oh yes, and bombs land in Iran killing dozens, mostly civilians but also Iranian leaders. It’s a matter of when, not if, all this impacts the global economy. Stuck in the Straits are oil, gas, and a host of agricultural and mineral products needed to run the world economy.
Maybe we’re already starting to see the impact. The U.S. Producer Price Index (PPI) leaped 0.7% in February, above January’s gain of 0.5% and well above the forecast of 0.3%. That came as a surprise to many. As a result, stocks fell, gold fell, gold stocks were hammered, and the US$ Index rose. The question is when, not if, the world economy turns lower. Our chart shows the PPI is turning higher while CPI and PCE prices remain at least constant. But if PPI is rising, it eventually feeds into both the CPI and PCE.
The war against Iran impacts others too. Many engineers, oil rig workers, and others who make the Gulf economies run each day are leaving. Why stick your neck out to get bombed? Even if the war stops tomorrow, all the damage and the ability to rebuild doesn’t happen overnight. Repairs will take months, not days. Places like Abu Dhabi, Dubai, Bahrain, and Qatar have become success stories built out of the desert. Banking, tourism, and airlines are now all at risk. Israel has also been suffering significant damage. The U.S. dollar has benefited from the war as capital flees. But that could end if the Gulf countries need funds to pay for reconstruction. Nothing lasts. A dark shadow has descended on the Middle East and by extension the world.
Oil prices leaped at the outset of the Russia/Ukraine war in February 2022. However, they soon came off, only to rise again into June 2022. After that they started a long decline. Could this scenario repeat itself? Crack spreads – the difference between Brent crude and petroleum prices like jet fuel, diesel, and gasoline – havewidened considerably. That means consumers will pay more and in turn that negatively impacts the CPI and PPI.
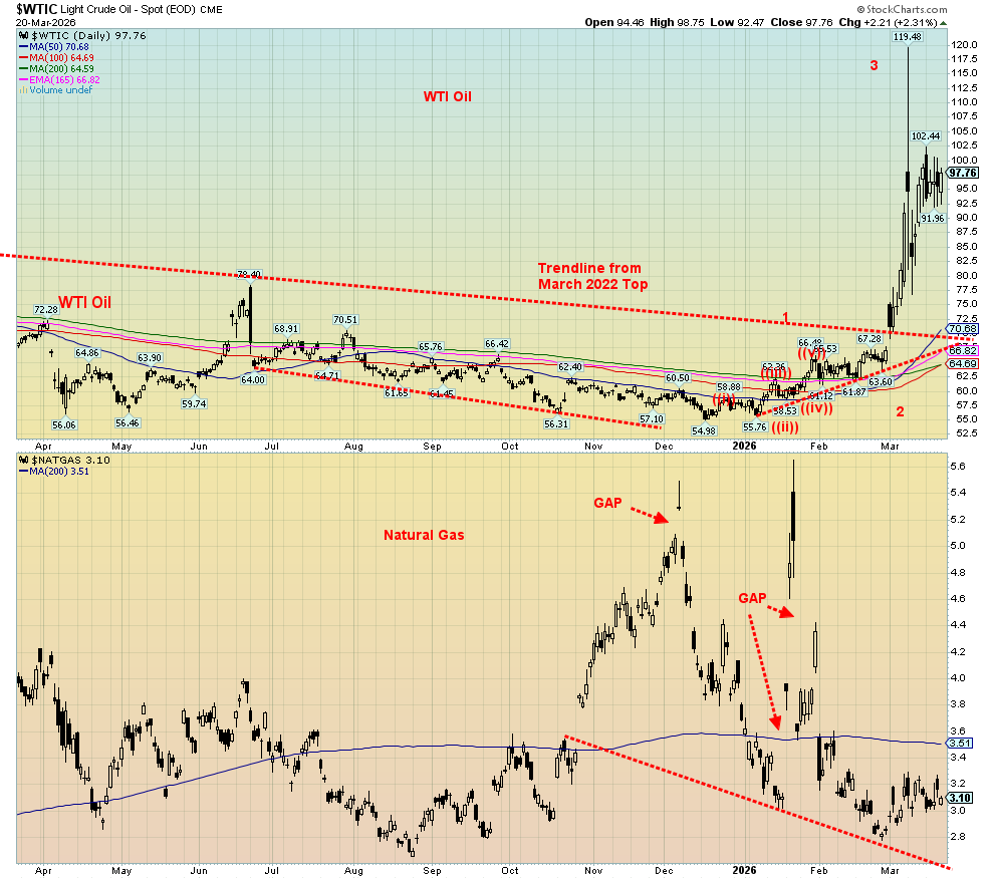
Israel bombed Iran’s Pars gas fields. In return Iran bombed Qatar’s LNG gas facility, the world’s largest. Considerable damage was done to both. No wonder natural gas (NG) at the EU Dutch Hub has doubled since February 27, the start of the invasion. Oddly, NG at the Henry Hub is up only marginally, given that there are no shortages of NG in North America as they consume what they produce and export. Despite the sharp rise, NG at the Dutch Hub is well below the peak hit in 2022 at $339 during the Russia/Ukraine war.
U.S. PPI, CPI, PCE 2016–2026
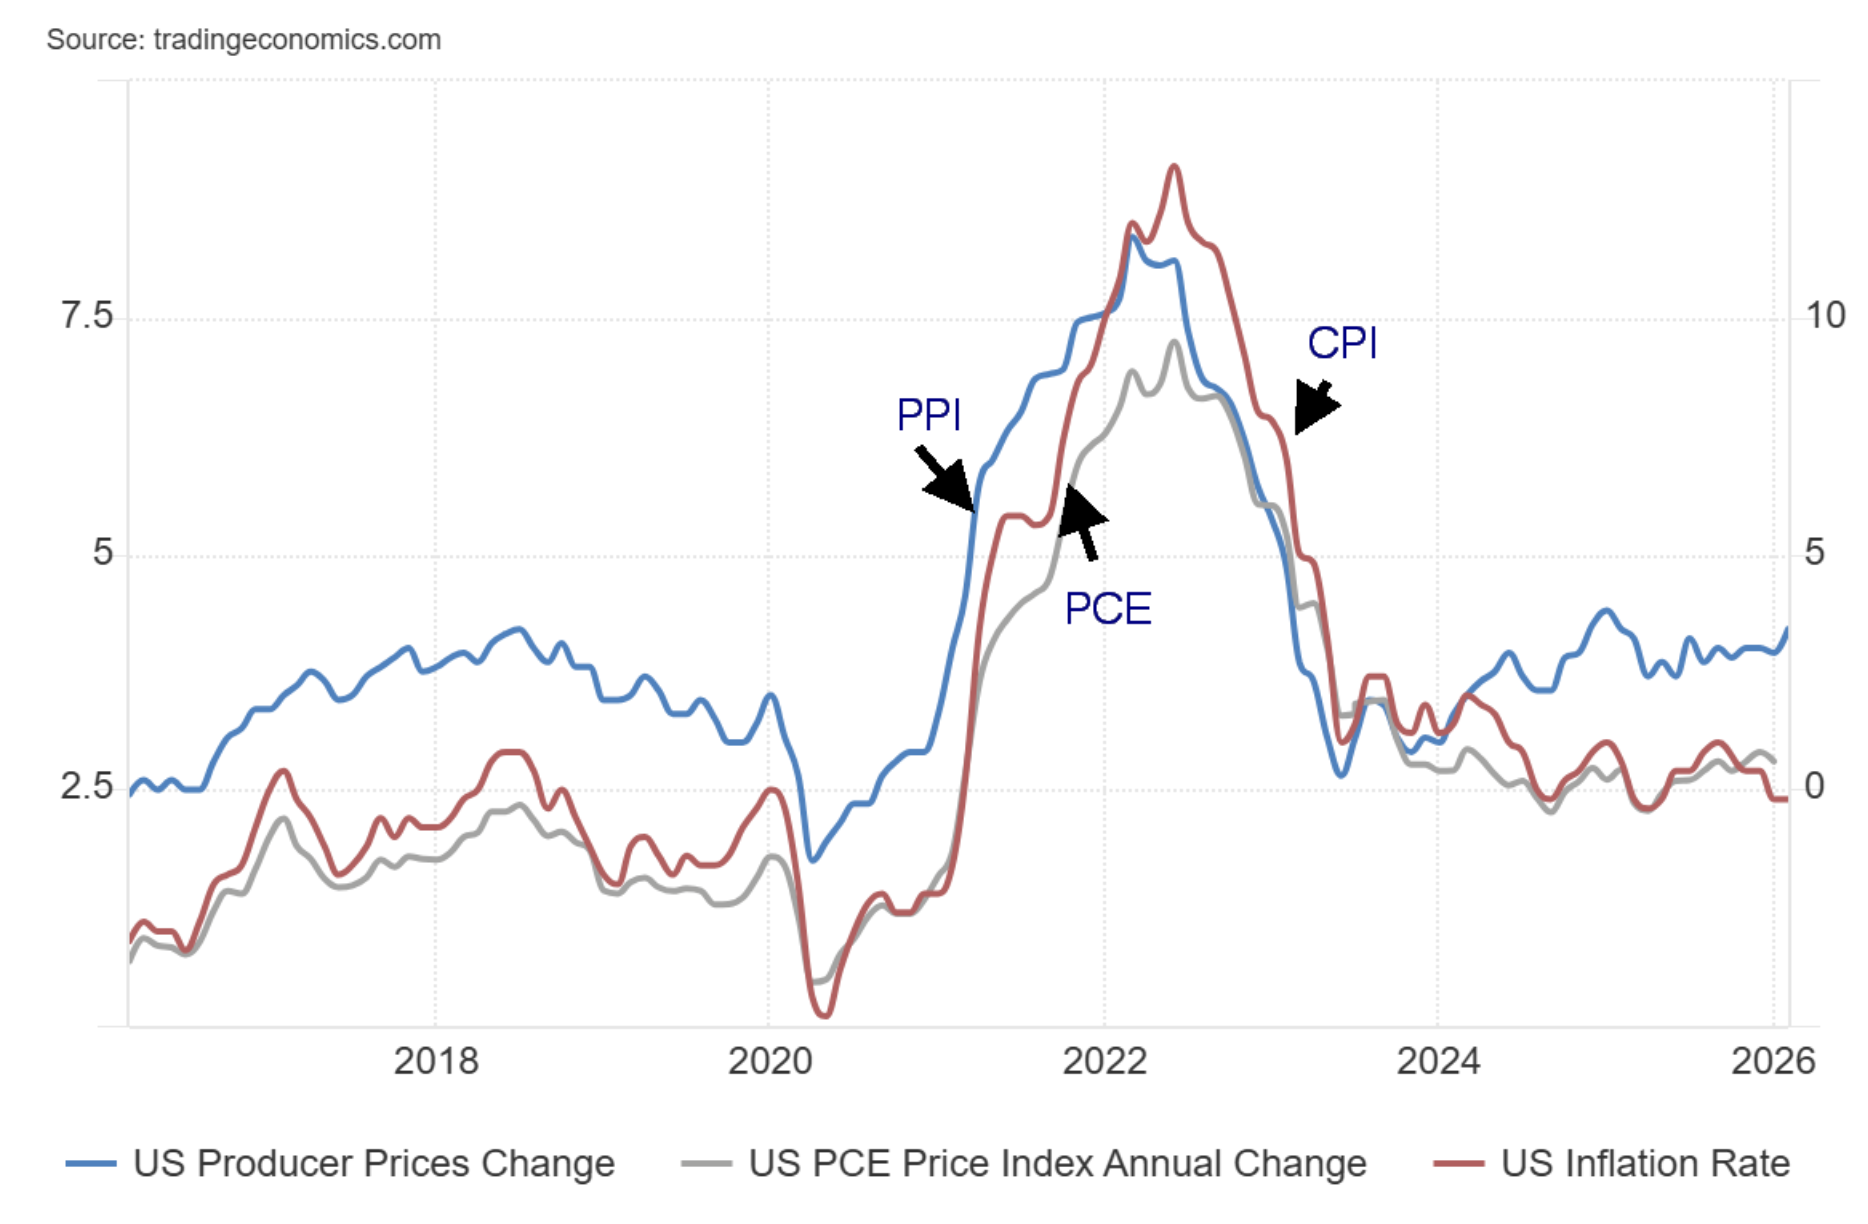
Source: www.tradingeconomics.com, www.bls.gov, www.bea.gov
As The Economist points out in its March 14–20 edition, this is an attack on the world economy. Some write that this is worse than the 1973 Arab oil embargo. Then only around 7% of the world’s oil supply was impacted. Today it’s 20%. Other products were not impacted.
Can the world economy withstand the effects of Trump’s tariffs and now Trump’s and Netanyahu’s war? The loss of a potential supply of both oil and gas trapped behind the Straits of Hormuz is actually larger than what happened during the Arab Oil Embargo of 1973 or the Iranian revolution of 1979. But the world is less dependent on oil than it was in the 1970s. Today there are emergency stocks of oil estimated at around 1.8 billion barrels. Yes, they are releasing 400 million barrels of oil from stocks, but that’s only four days’ global demand.
As The Economist notes, the world has been changed by this invasion. Fully one-fifth of the world’s oil and gas, along with numerous agricultural and manufacturing supply needs have been taken off the market. The U.S.
does not have the capability to protect all the tankers and cargo ships. Occupying Iran is extremely difficult given its size, the ring of mountains surrounding the country, and the huge, lightly populated desert in the centre.
Disruption now becomes the norm, and the world probably hasn’t fully priced-in the impact for either oil, gas, or the stock market. Central banks are caught between a rock and hard place with inflationary pressures building as the economy weakens. Oh yes, and debt levels continue to grow to unsustainable levels. The U.S. now spends more annually on interest on the debt than it does on defense spending. The U.S. could issue record debt this year to cover the huge budget deficit that’s already 6.5% of GDP, the highest in the G7.
U.S. Defense Spending vs. Interest on the Debt 2000–2025
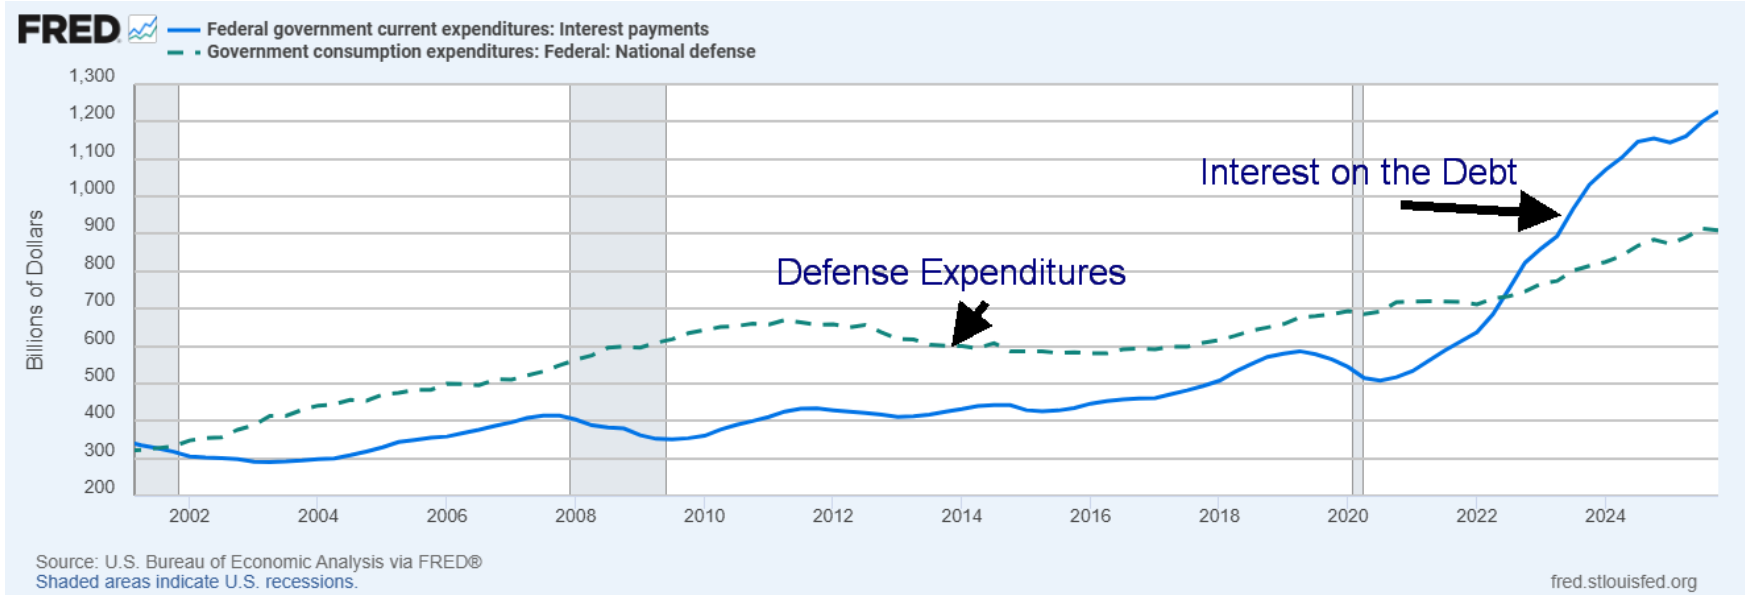
Source: www.stlouisfed.org, www.bea.gov
Not only is interest on the debt surpassing defense spending, but total spending as a percentage of GDP is fast approaching levels seen during the 2008 financial crisis. The 2020 pandemic and final year of World War II in 1945 were the highest levels seen. Oil prices are fast approaching levels usually associated with recession. Our chart from Pictet Asset Management (www.am.pictet.com) shows that when Brent crude as a percentage deviates from its long-term trend, a recession usually follows. It means that Brent is high relative to its trend. We’re at that point.
The world has entered a dangerous phase with a war that appears to have no way out. Some have noted that, even if the U.S./Israel pulled out tomorrow, it might not necessarily stop Iran from continuing to block the Straits of Hormuz. Considerable damage has already been done, and it will take time to repair it. As The Economist concludes, it has made the world less prosperous, more volatile, and harder to govern.
There might be some temporary relief coming, given that Canada, Japan, and some European countries have noted they would be “willing” to use “appropriate measures” to help open the Straits of Hormuz. No indication as to what that would be or when it might be forthcoming, if they are able to at all. It might help ease tensions, providing a respite for oil and a temporary bottom in the stock market and gold.
President Trump continues to confuse things by musing about winding down the war as he becomes concerned about a falling stock market and rising long-term interest rates. That’s confusing because the U.S. has requested an additional $200 billion for defense, sent three more warships to the Gulf, and added more troops. They are now threatening Iran’s power plants if they don’t open the Straits of Hormuz. They’ve also talked about taking Kharg Island, a somewhat mountainous little island with freshwater where 90% of Iran’s oil exports traverse. The island is important to Iran.
Military facilities may have been destroyed on the island, according to the U.S. But there are rumours of a U.S. military invasion to seize the island. We wonder about that, as any attempt to seize the island could be met with ferocious resistance – not unlike the U.S. invasion of Pacific islands like Guadalcanal, Okinawa, and Iwo Jima during World War II – regardless of pre-bombing from ships and the air. Casualties could be high. It’s hypothetical but plausible. However, seizure of the Iranian oil facilities is not guaranteed and could, in a worst-case scenario, be sabotaged deliberately to deny the U.S. the use of the island. It would also not result in the opening of the Straits of Hormuz, the global chokepoint that is already causing chaos. Oh, the unknown unknowns.
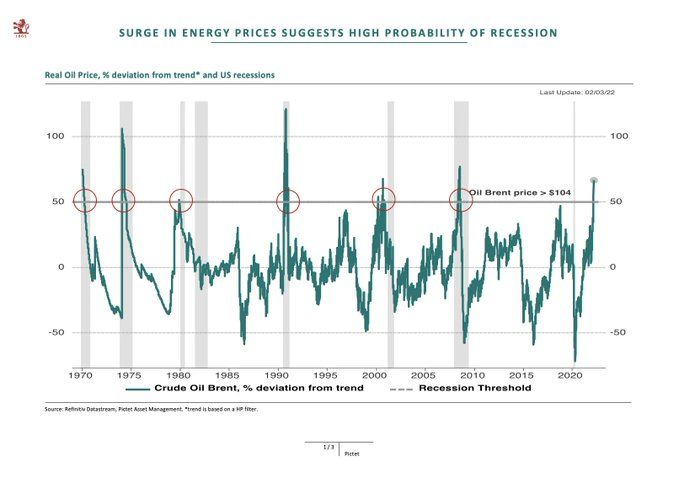
Source: www.lseg.com, www.am.pictet.com
U.S. Government Spending to GDP - %
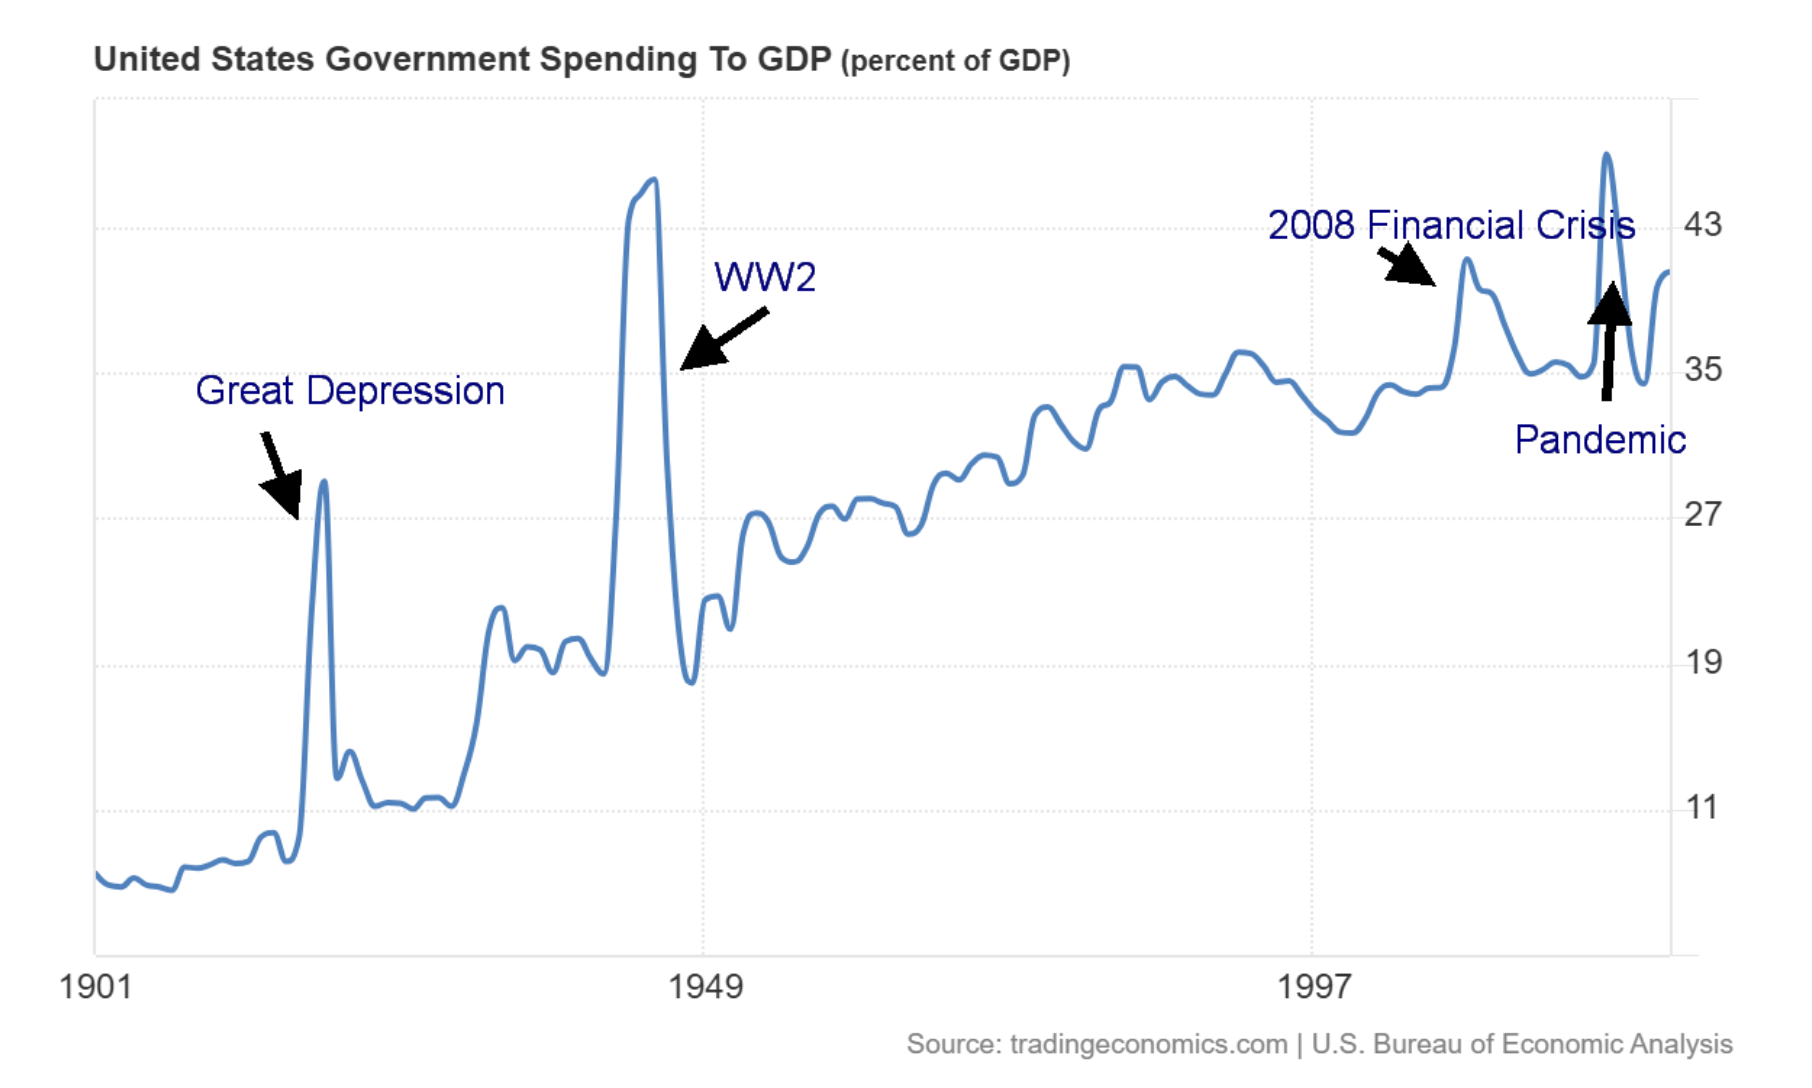
Source: www.tradingeconomics.com, www.bea.gov
EU Natural Gas at the Dutch Hub
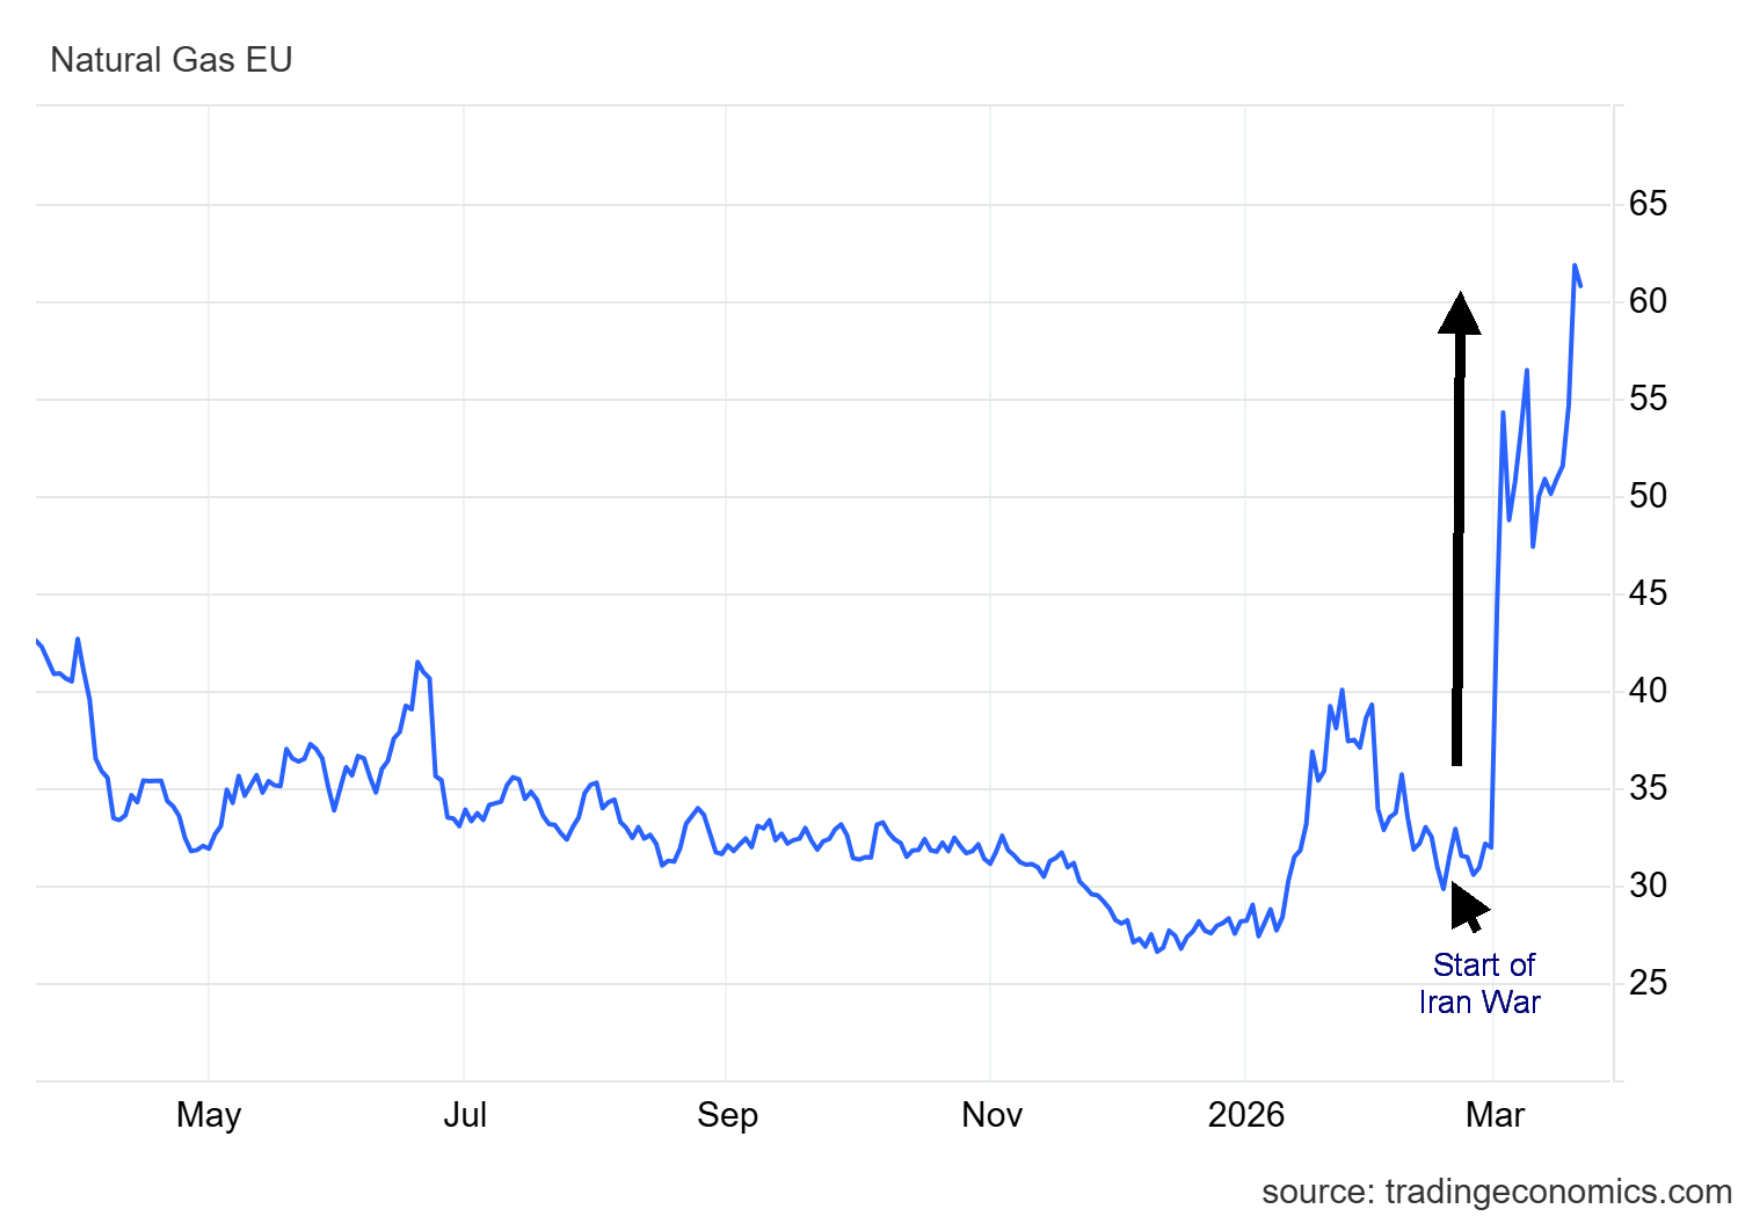
Source: www.tradingeconomics.com
Fed interest rate decision
To no one’s surprise, the Fed left interest rates unchanged at 3.50%–3.75%. The Fed is caught between a rock and a hard place – economy weakening, inflation rising. What do you do? Still, they are projecting at least one cut this coming year, timing unknown. But overall, the statement from the Fed was pretty neutral. The decision to leave rates unchanged had only one dissenter who wanted a quarter point cut. Some areas of the economy are still growing, corporate profits remain strong, but job numbers are weakening. Inflation remains elevated and while we can assume a few things, we still have not felt the full impact of the war against Iran. The Fed is expecting its key inflation rate that they follow, Personal Consumption Expenditures (PCE), to remain elevated in 2026.
U.S. Fed Rate vs. U.S. 10-year Note 2016–2026
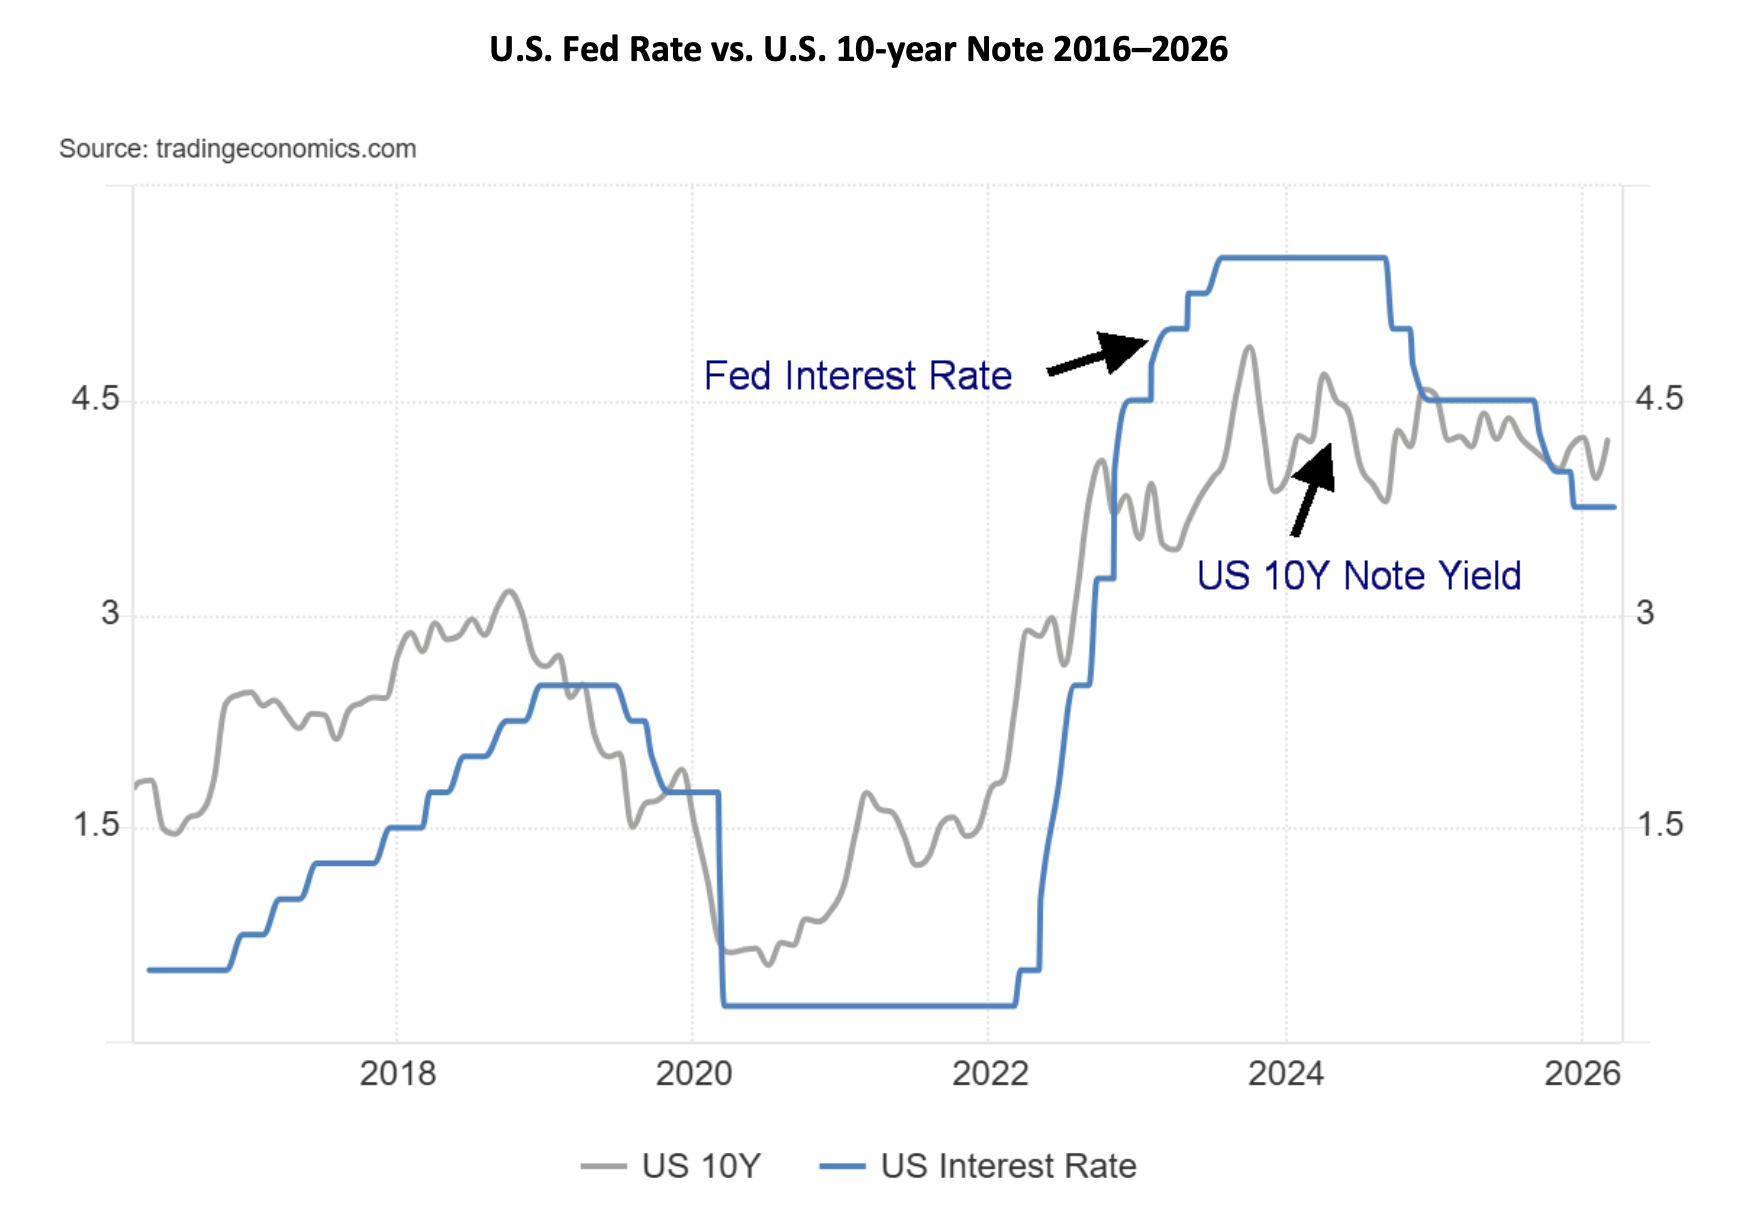
Source: www.tradingeconomics.com, www.federalreserve.gov
Note: Both the Bank of Canada (BofC) and the Bank of England (BOE) left interest rates unchanged as well.
More credit jitters
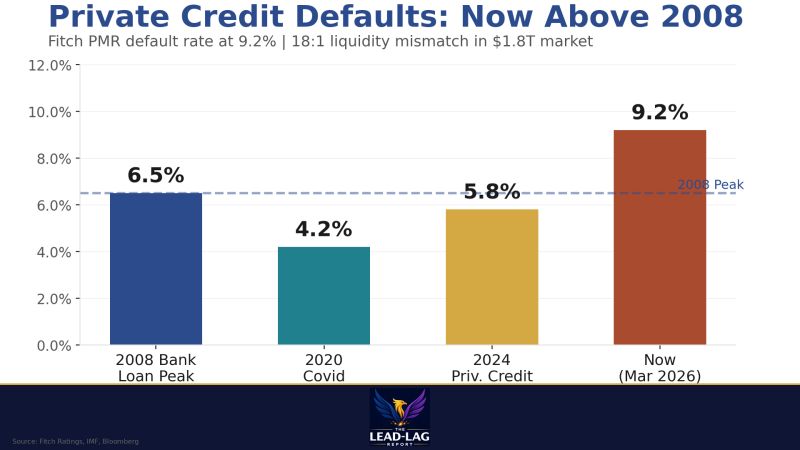
Source: www.leadlagreport.com
A report from Lead-Lag Media (www.leadlagreport.com) shows that private credit defaults are now above levels seen at the peak of the 2008 financial crisis. That’s worrisome. While the report is from Fitch, a smaller rating agency behind S&P and Moody’s, it should not be ignored. Fitch is still one of the Big Three rating agencies.
Apparently, there is $1.8 trillion of private assets outstanding vs. only $100 billion in secondary market liquidity – a huge mismatch. Investors can’t get out. The IMF noted that 40% of borrowers have negative free cash flows. The most exposed are pension funds, endowments, and insurance companies. They thought allocating to private credit at attractive yields was “safe.” Now there are redemptions and the market is insufficient to absorb the selling. Banks are also exposed. Private equity firms are also seeing the same problem. In the stock market you can sell. In private credit all you can do is “pray.” The manager determines the value. Firms associated with private credit are being hammered.
Examples: Blue Owl (OWL/NYSE), down 56% from 2025 highs, KKR & Co. (KKR/NYSE), down 42%, Ares Management (ARES/NYSE), down 44%, Blackstone (BX/NYSE), down 40%, and Apolo Management (APO/NYSE), down 29%. Pictet says that few are really following this. We know investor Michael Burry (depicted in the movie The Big Short) who shorted the sub-prime loan and housing market during the 2008 financial crisis is shorting AI stocks. Maybe private credit stocks too?
Chart of the Week
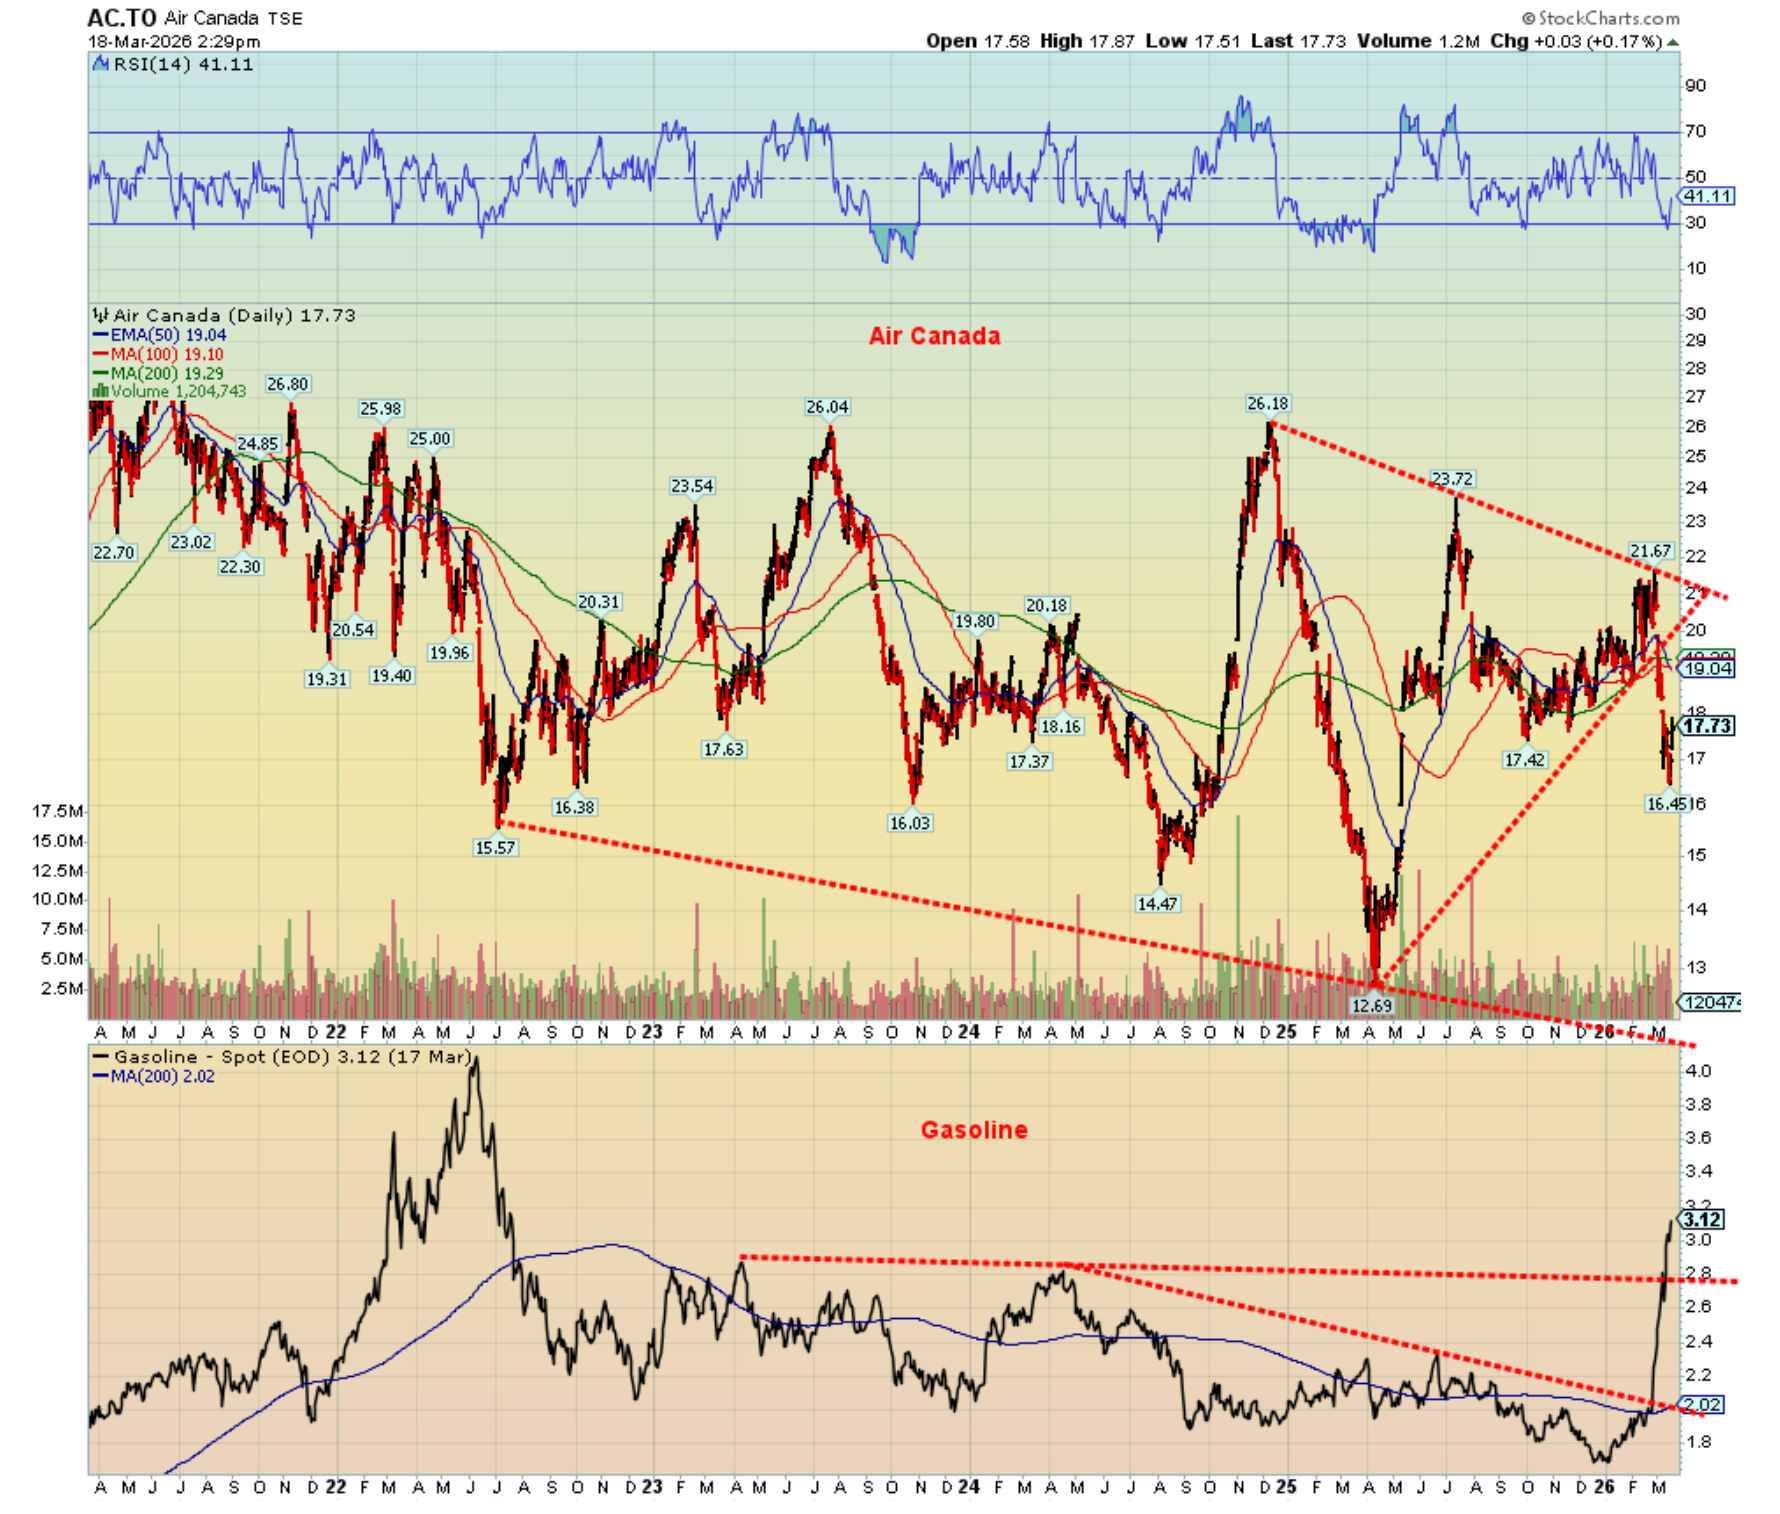
Source: www.stockcharts.com
It should be no surprise that, with the outbreak of war against Iran, airlines are taking a hit. Rising jet fuel costs are definitely playing a big role. As well, given wars, etc. airlines have had to reroute their flights or see a big drop in travelers to some places, even as they announce increased tourism elsewhere. In the U.S., the ongoing partial government shutdown has meant that Transportation Security Administration (TSA) workers are not getting paid. As a result, the TSA workers are either calling in sick or just quitting (mostly), resulting in airport chaos with long lineups for security, cancelled flights, or significant rerouting, adding considerably to the costs of a flight. That is, if you go at all. The DHS has now stated they will be sending ICE agents to deal with the long lineups and delays. Given ICE’s record in Minneapolis and elsewhere many believe this is not a solution.
The preceding chart is for Air Canada (AC/TSX), Canada’s preeminent airline. Since that peak at $26.18 in late 2024, Air Canada is down 26%. It is not a good time to be holding airline stocks. Even in the best of times airline stocks can rise and fall quickly (i.e., volatility). Our next chart shows how various (stock-listed) airlines have fared since recent highs. Yes, it can vary from airline to airline, depending on where they fly. All the U.S.- based airlines are a part of the Dow Jones Transportations (DJT) index. The DJT is down 12% from its recent high.
|
Airline (stock symbol/exchange) |
Change since recent high |
|
Air Canada (AC/TSX) |
(27)% |
|
American Airlines (AAL/NYSE) |
(37)% |
|
United Airlines (UAL/NYSE) |
(25)% |
|
Delta Airlines (DAL/NYSE) |
(17)% |
|
Alaska Airlines (ALK/NYSE) |
(44)% |
|
Southwest Airlines (LUV/NYSE) |
(28)% |
Source: www.stockcharts.com
Airline stocks at the best of times can be subject to swift gains and swift losses. That’s the nature of the business. Air Canada over the five-year period covered has fallen 34%. Yet they remain above the low seen in April 2025 following the “Liberation Day” tariffs. But for how much longer?
The lower chart shows how gasoline prices have leaped since the war broke out. GASO is up 66% since just before the war started on February 27, 2026. We would have shown jet fuel prices, but StockCharts doesn’t cover jet fuel. We did learn that jet fuel has jumped 76% since February 27. Because fuel and other costs are going up, it is no surprise to discover that airline tickets are now costing more as well. Fuel surcharges alone add $50 to $200 to the average ticket. Last-minute bookings are hit the hardest.
The question is, will this war be over quickly or will it drag on? Even if it were to end unexpectedly quickly, considerable damage has been done, and prices are not liable to come down quickly. While the chart of Air Canada shows that it can spike downward sharply, the recovery can also spike to the upside. It seems that airline stocks are only for the brave. Prices are most likely destined to go lower.
Stocks
Source: www.stockcharts.com
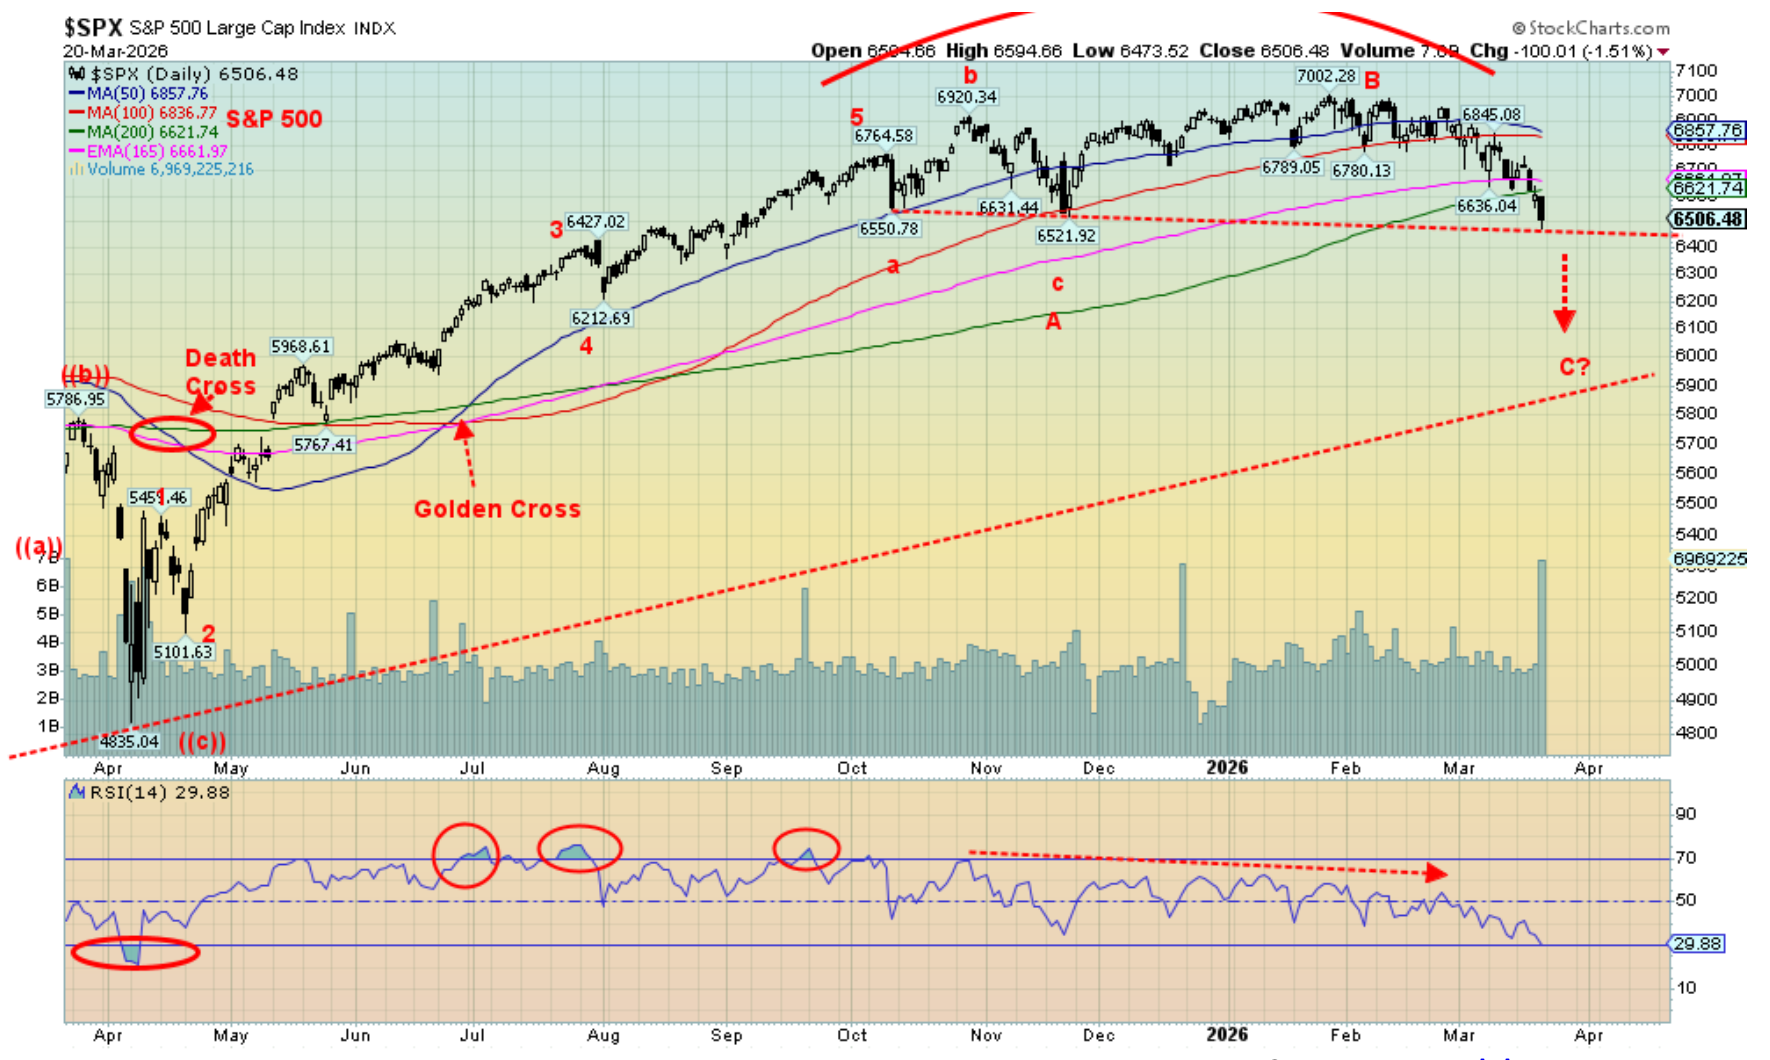
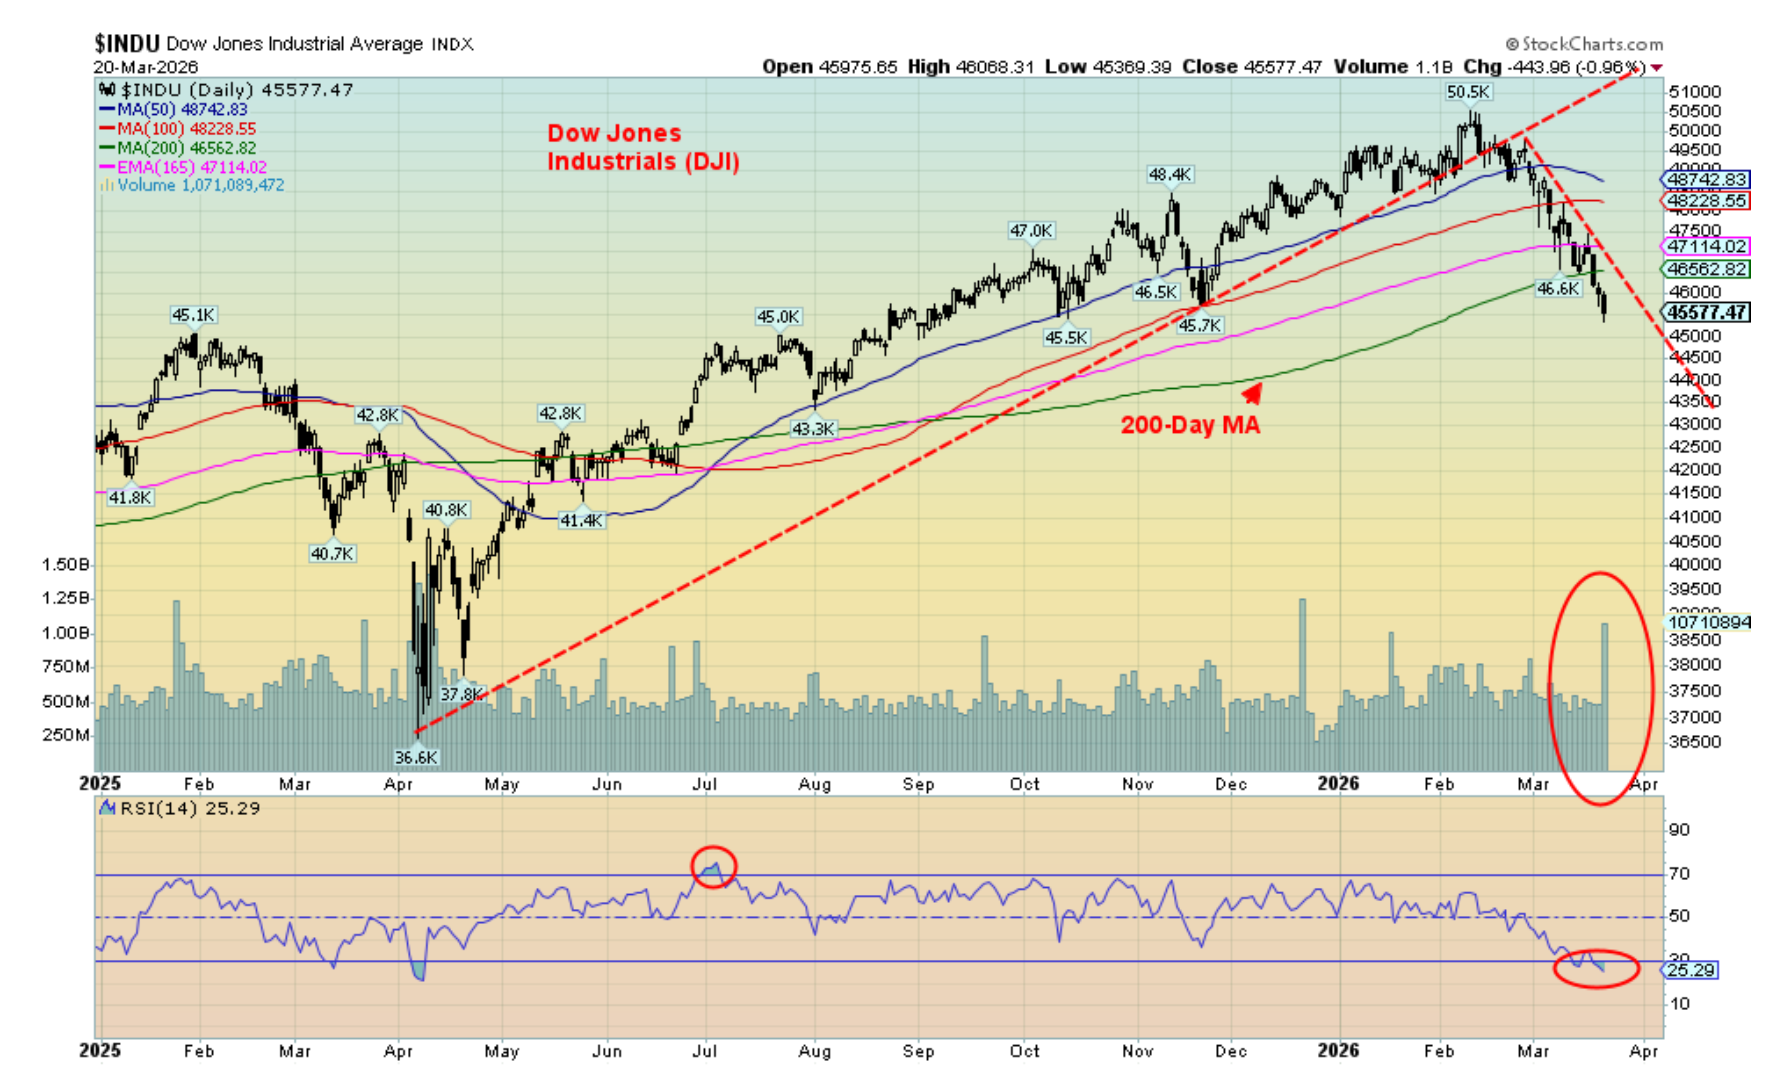
Is the stock market about to break down? The Dow Jones Industrials (DJI) has already broken support near 45,700 and broken the 200-day MA. Ditto for the NASDAQ, now under 22,100 support and the 200-day MA. The S&P 500 still needs to break 6,500 support, but, as can be seen, we are now under the 200-day MA. A potential C wave down is underway. Not a good sign.
President Trump gets nervous when the stock market falls. Then he talks about winding down the war. But with the Straits of Hormuz already effectively shut, winding down may not necessarily get them open again. Gulf allies do not have the military capability of the U.S. to open them, even as their oil and gas facilities are under fire from Iran, given many important areas for tourism and banking and finance are also under fire. Already, more warships are on the way to the Gulf along with more troops, plus a request for $200 billion in more funding. Winding down?
On the week, the S&P 500 fell 1.9%, the DJI was down 2.1%, the Dow Jones Transportations (DJT) continues to be a winner, up 0.7%, and the NASDAQ fell 2.1%. The S&P 400 (Mid) fell 1.3% and the S&P 600 (Small) was down 1.3%. The S&P 500 Equal Weight Index dropped 1.7% while the NY FANG Index fell 2.9%. All indices except for the DJT are now down on the year. It is mostly a sea of red ink.
Source: www.stockcharts.com
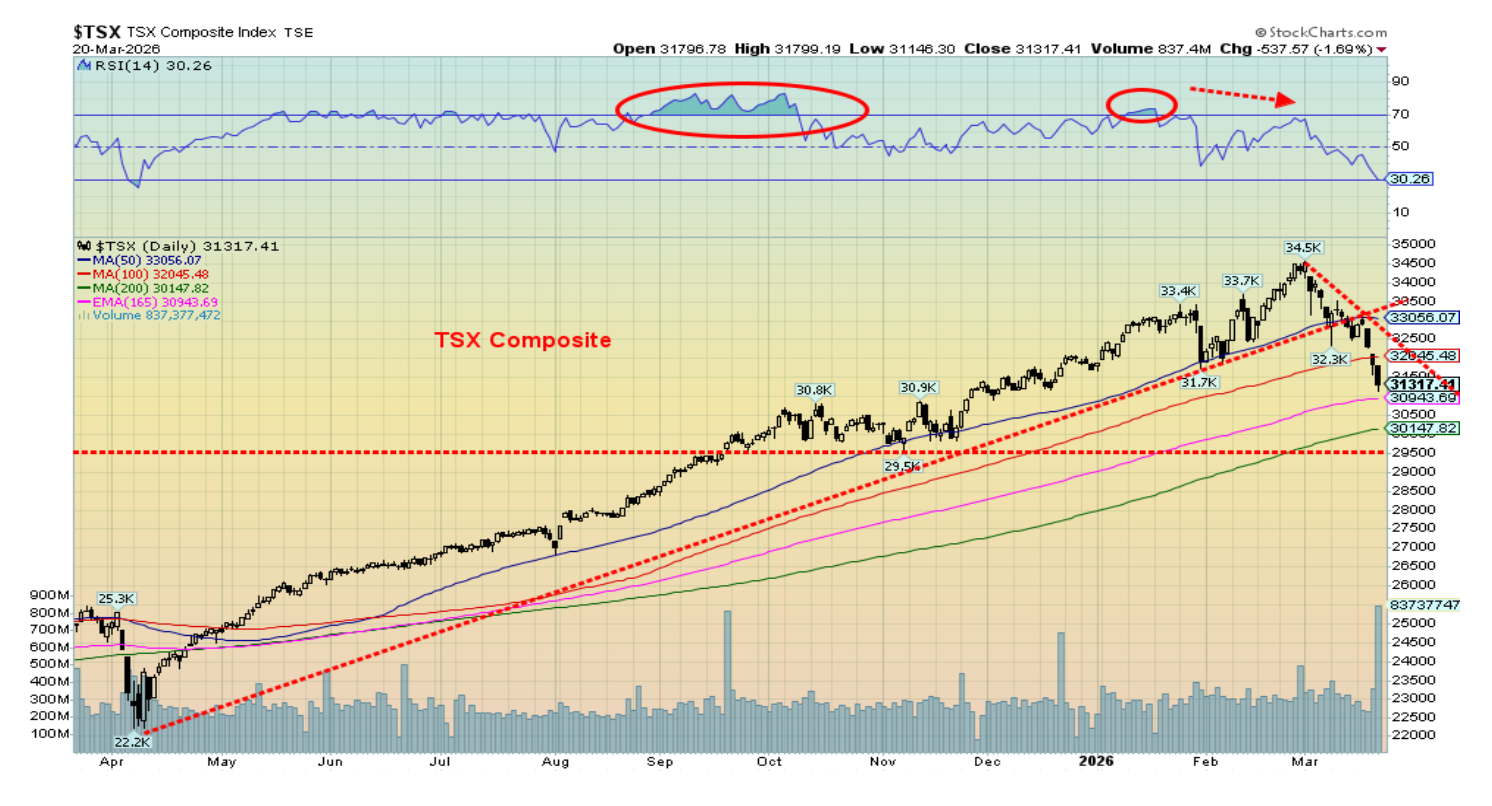
In Canada, the TSX Composite fell 3.8% while the TSX Venture Exchange (CDNX) dropped 10.5%. Both are down on the year. In the EU, the London FTSE fell 3.3%, the EuroNext was off 3.1%, the Paris CAC 40 fell 3.1%, while the German DAX dropped 4.6%. In Asia, China’s Shanghai Index (SSEC) dropped 3.4%, the Tokyo Nikkei Dow (TKN) fell 0.8%, while Hong Kong’s Hang Seng (HSI) fell 0.7%. India’s Nifty Fifty was almost a winner, down only 0.2%. Red ink all around. The daily short-term trends have all turned down while the intermediate weekly trends are rolling over. So far, the long-term monthly trends remain positive. The MSCI World Index (ex-USA) fell 2.6% and is down on the year 1.2%. Bitcoin, which has been down all year, fell 1.8%, now down 20.2% in 2026. No joy anywhere.
All seven MAG7 stocks fell this past week. Of the FAANGs, the only one that was up was Advanced Micro (AMD), gaining 4.2%. Trump Media (DJT) hit new all-time lows once again. No wonder Trump is beginning to panic. The TSX sub-indices fared poorly except for Energy (TEN), making 52-week highs. Telecommunications (TTS) gained a meagre 0.2% while Golds (TGD) led the way down, off 14.3%. Ouch! It was difficult to find joy anywhere unless you owned puts and oil and gas stocks.
We are approaching oversold, so are we looking at a bounce? Maybe Trump’s winding-down wishes will help. But even if a bounce happens, it will most likely be temporary. In 1973, the Arab Oil embargo lasted six weeks and the DJI fell 45%. We are only three weeks in, but so far, we’ve only entered correction territory for the DJI and the NASDAQ down 10% from the highs. We need to be down 20% + to register a bear market. The economy is mixed with unemployment rising, but corporations are still making good profits. However, the longer this war drags on, the more pronounced the fall in the stock markets will get. Puts and shorts have done well so far.
Source: www.stockcharts.com
Bonds
Source: www.tradingeconomics.com, www.home.treasury.gov, www.bankofcanada.ca
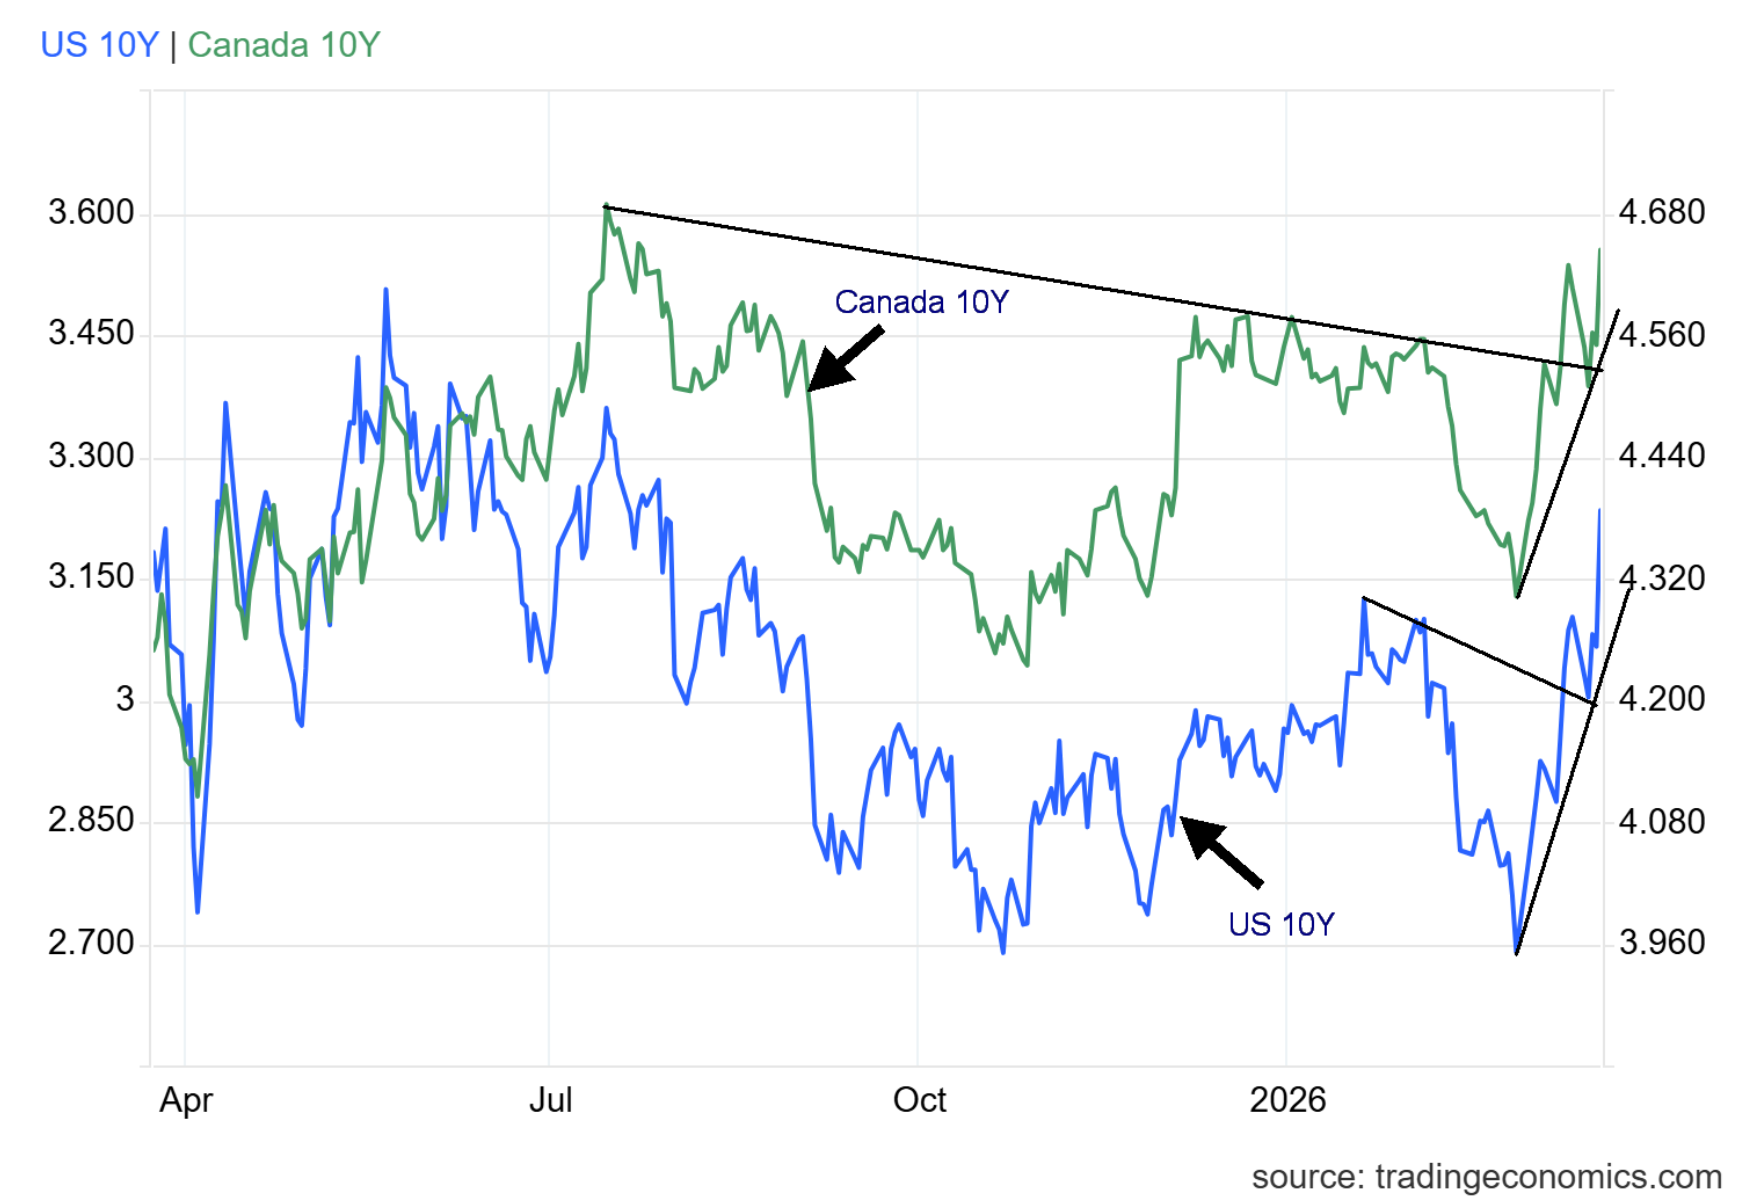
It should be no surprise that, given the rise of oil with the invasion of Iran, bond yields are also rising. This past week the U.S. 10-year Treasury note rose 2.3%, leaping over our resistance line of 4.30% closing at 4.39%. Ditto for the 10-year Canadian Government bond (CGB), up 1.1% to 3.55%. The Canadian bond needs to break over 4.70% to make new 52-week highs. The U.S. 10-year needs to get over 4.60% to make new 52-week highs.
As we have noted, the Fed is caught between a rock and hard place. Its ability to withstand a severe stock market drop and sliding of the economy into recession is limited, thanks to the already record levels of unsustainable debt. Yet this war is already adding billions to the deficit, and they’ve requested another $200 billion for defense. It’s a dilemma. A policy trap. They can’t tighten because the stock market and the economy are weakening. They can’t cut because inflation is rising.
Gold and Silver
Source: www.stockcharts.com
This is a miserable time to be a gold bug. If there is light at the end of the tunnel, we note that gold, silver, and gold stocks were hammered down during the 2008 financial crisis and again during the pandemic. For gold stocks, especially the small junior developers/near producers, the bids just fade away. As a result, they fall into a vacuum. Note that during the 2008 financial crisis gold fell 34%, silver was down 40%, the Gold Bugs Index (HUI) dropped 71%, while the S&P 500 fell 35% (and ultimately 55%). Gold, silver, and the gold stocks bottomed in October and were the first to rise.
The 2020 pandemic saw a similar occurrence. Gold fell 15%, silver was down 38%, the HUI was off 45%, while the S&P 500 dropped 35%. And that was all in one month – March 2020. Once again, gold, silver, and gold stocks were the first to begin to rally. New highs were seen a month later in April.
This time around gold has fallen from its high by 20%, silver is down 44%, the HUI is off 31%, while the S&P 500 has fallen only 7% so far. The precious metals are in a bear market. Stocks are not even in correction territory -yet. The DJI and NASDAQ are close.
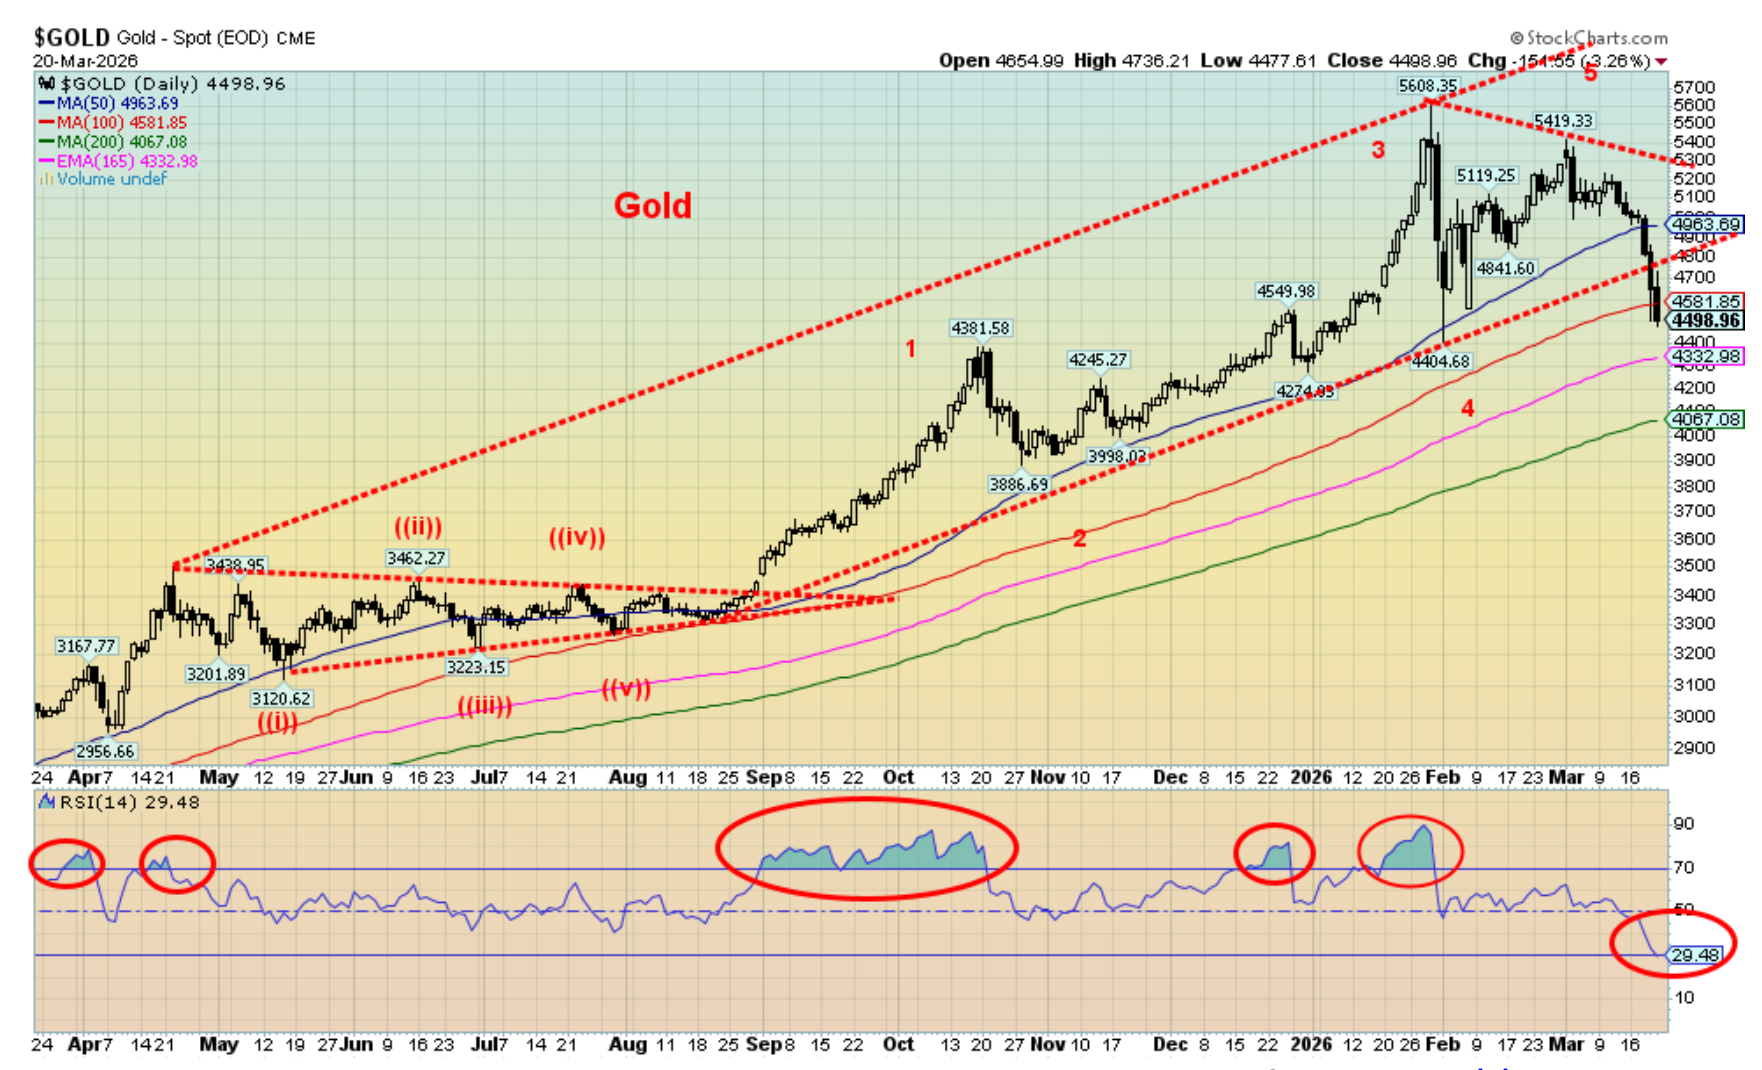
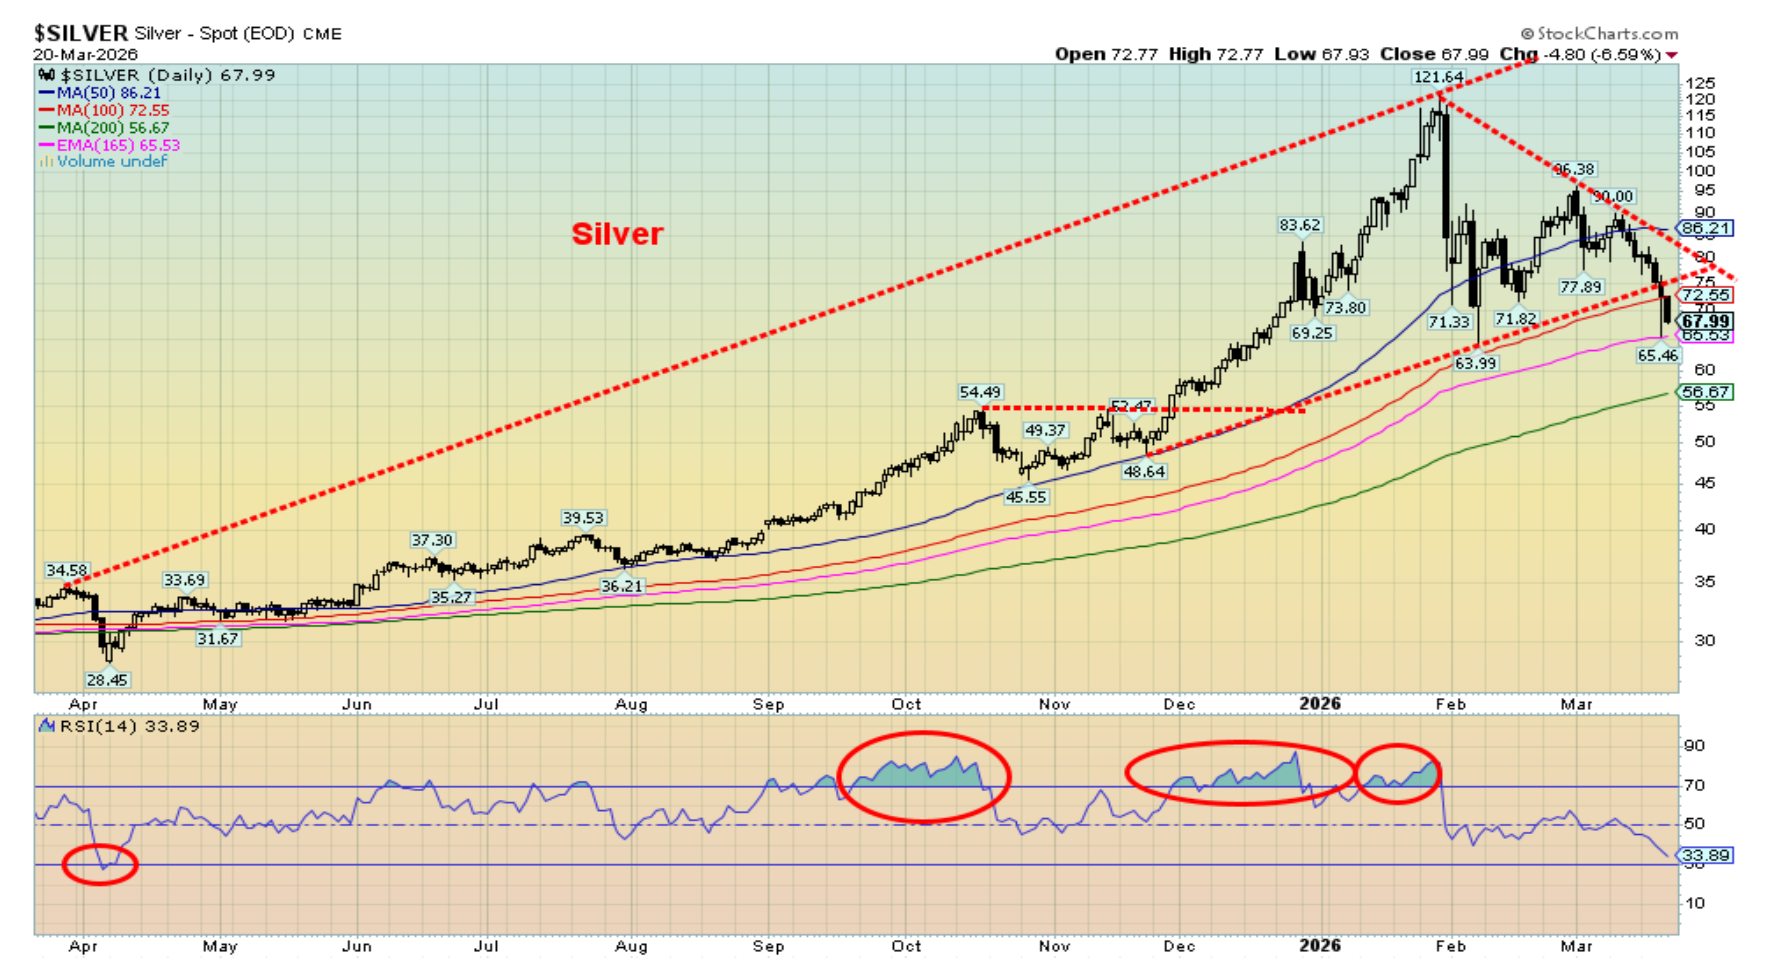
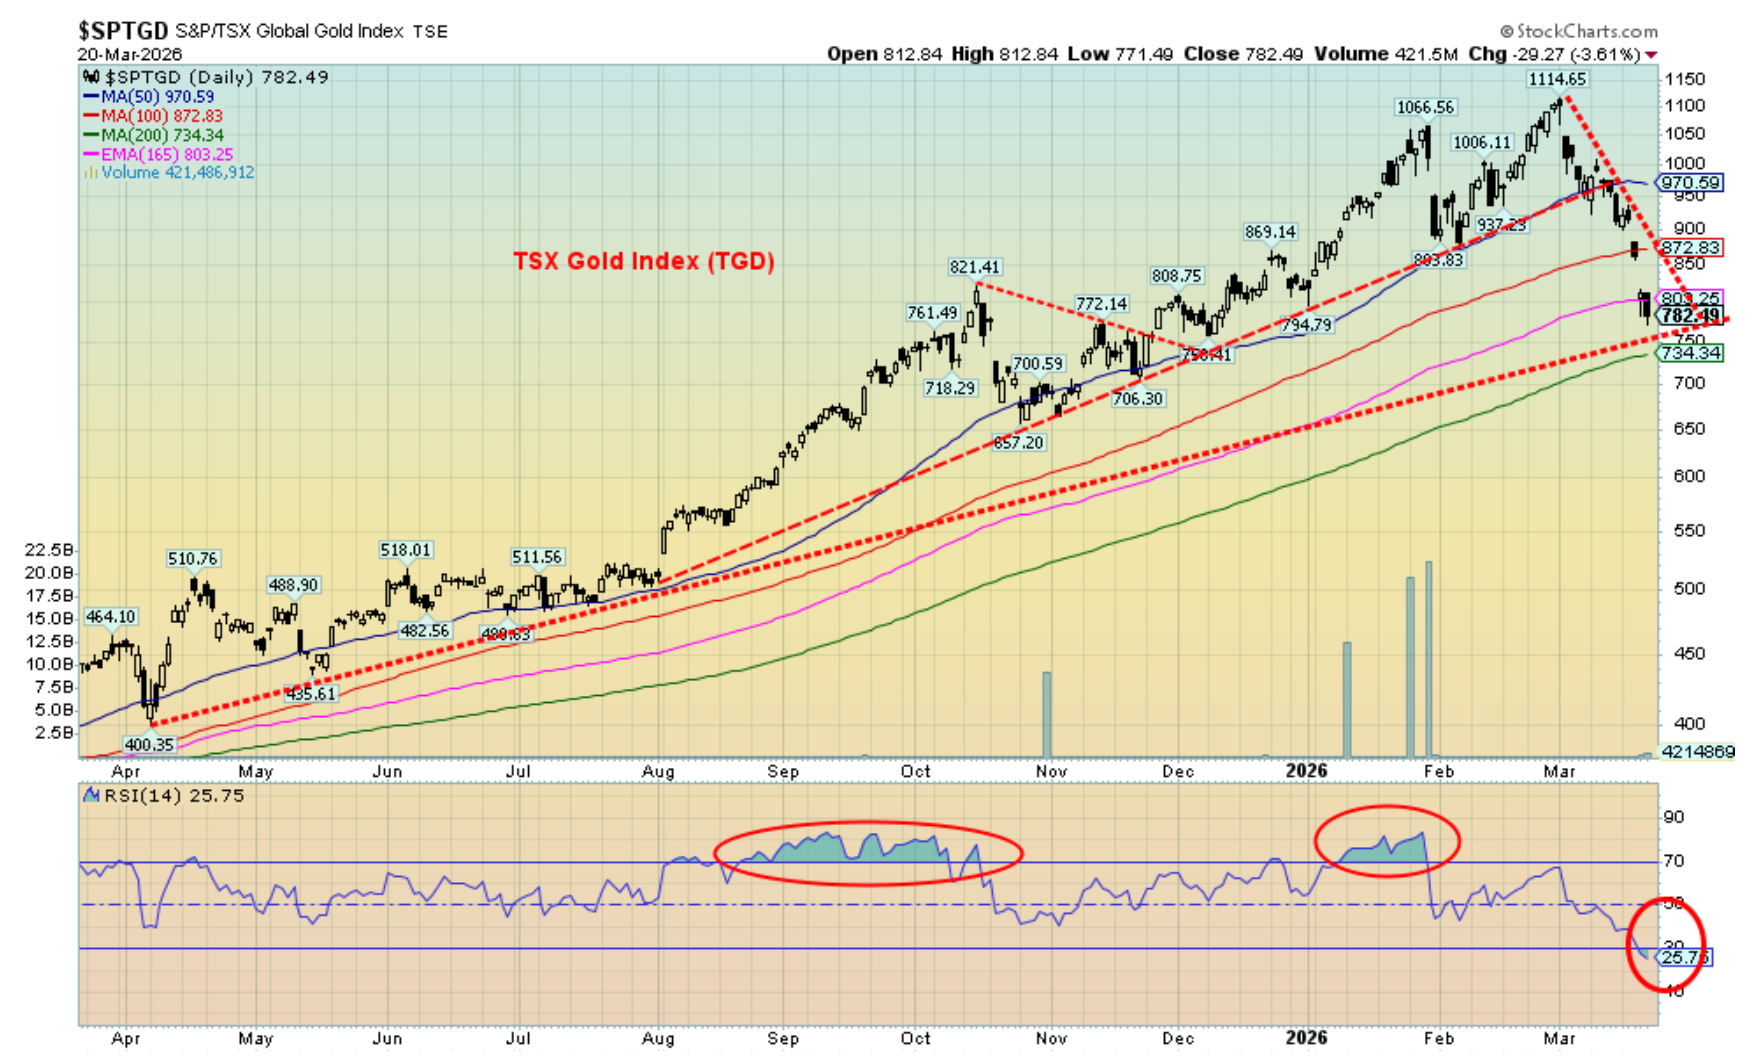
Naturally, we can’t say we’ve bottomed yet but given oversold conditions a rebound may be in the offing. We’ve noted some brave souls are nibbling at buying gold, silver, and gold stocks. On the week, gold fell 10.4%, silver dropped 15.7%, platinum fell 5.0%, while the near precious metals saw palladium off 9.2% and copper down 6.6%. The Gold Bugs Index (HUI) dropped 14.7% while the TSX Gold Index (TGD) was off 14.3%. The CRB Index, which is dominated by energy, fell only 0.4%. The CRB also made 52-week highs.
We don’t want to panic here. It may turn out to be the proverbial buying opportunity. However, for confirmation we’d need to see gold back over $5,000, silver over $90, the TGD over 1,000, and the HUI over 902. Gold has fallen to the 100-day MA and could be making a double bottom (not confirmed). Silver bounced off the 165-day EMA, while the TGD is just above trendline support, just under the 165-day EMA and not far from the 200-day MA (734). The RSIs are in oversold territory, an area often associated with lows but not guaranteed. Even the TSX Venture Exchange (CDNX), which is dominated by junior gold and metal stocks, fell 10.5% this past week and is down on the year by 7.7%, although it also hit the 200-day MA support.
So far, all are making what appears to be an ABC-type correction. But we don’t yet know whether this C wave has bottomed yet. The ABC correction could also morph into an ABCDE-type correction. On any rebound, failure to make new highs would be a negative sign and signal this isn’t over yet. Seasonally, gold is often weak into June/July before making a low and beginning a seasonal rise into September/October. On that basis, gold bugs will just have to be patient.
Source: www.stockcharts.com
Right now, the charts don’t look good. The correction was overdue following a record run. From a significant low in 2022 there was only one correction of any size in April through October 2023 where gold fell about 13%. Overall, from that September 2022 low gold rose almost 250%. So, is the glass half full or half empty? Gold is still up 69% since 2025. The TGD is up 132% since 2025, even after a 30% pullback.
Source: www.stockcharts.com
What to watch for going forward? Gold, silver, and the gold stocks have been beaten up and bloodied. But overall, they are still in good shape. However, the reality is once we start a rebound, we need to eventually see new all-time highs to confirm that the bottom is in and a fifth wave up is underway. We remember that, after the 2011 high, 2012 saw a back-and-forth market that failed to make new highs. Then came that devastating drop in April 2013. That is something we’ll want to avoid this time around.
Oil and Gas
Source: www.stockcharts.com
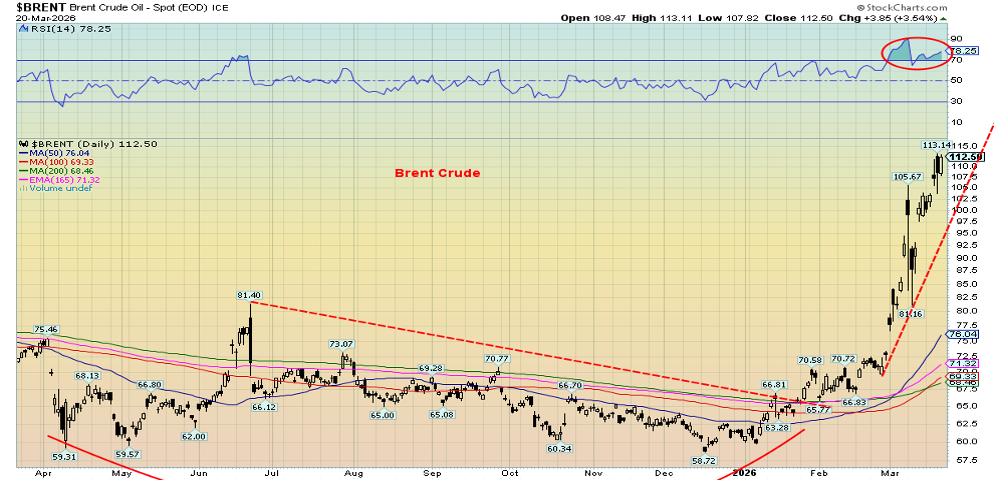
Oil, the lifeblood of the economy, has gone up for five weeks in a row. That coincides with the Straits of Hormuz effectively being closed, or at least heavily delayed, for the third week in a row. Brent crude soared to new 52-week highs this past week, even as WTI oil actually eased slightly. WTI oil is North American, with their own sources in the U.S., Canada, and Mexico, whereas Brent prices oil in Asia and Europe. Sanctions continue against major oil producer (and sources) Russia, even as sanctions were eased at least temporarily to help bring down prices.
WTI oil actually fell slightly this past week, off 1.6%. That’s small consolation when WTI is up some 70% in 2026. Meanwhile, Brent rose 8.3%, now up 84.5% in 2026. The story for natural gas (NG) is much the same. The Henry Hub in North America benefits from being over here as it fell 1.0% this past week and is actually down in 2026 by 16%. Not so lucky EU NG at the Dutch Hub as it rose 16.9% this past week to new 52-week highs. It’s up 110% in 2026. So, while North America has plenty of oil and NG, Europe and Asia are suffering, including shortages. No, that hasn’t brought the price of oil down in North America as oil is a global commodity priced in U.S. dollars. Gasoline prices at the pump are up 30% or more in both Canada and the U.S. since the invasion of Iran.
One benefit is the oil and gas stocks continue to rise with both key indices making 52-week highs once again. The ARCA Oil & Gas Index (XOI) rose 3.9% and is up 37.3% in 2026 while the TSX Energy Index (TEN) was up 4.5% and 37.5% on the year. U.S. crude oil stocks continue to drag along near five-year lows. Canada does not hold a comparable supply, given its ability to increase production. U.S. gasoline stocks have been rising, nearing the high of the five-year range.
Oh yes, the U.S. confuses things with its attempts to defuse market concerns with easing of Russian sanctions and now even Iranian sanctions. It has had little impact on prices as the Straits, the world’s biggest energy chokepoint, are effectively closed to almost all traffic. And, as noted, it’s not just oil and gas as fertilizer and other products needed in food production and the manufacturing of chips, for example, also remain stranded.
Source: www.stockcharts.com
Source: www.stockcharts.com
Markets and trends follow
Markets and Trends
|
|
|
|
% Gains (Losses) Trends
|
|
||||
|
|
Close Dec 31/25 |
Close Mar 20/26 |
Week |
YTD |
Daily (Short Term) |
Weekly (Intermediate) |
Monthly (Long Term) |
|
|
|
|
|
|
|
|
|
||
|
S&P 500 |
6,845.50 |
6,506.46 |
(1.9)% |
(5.0)% |
down |
neutral |
up |
|
|
Dow Jones Industrials |
48,063.29 |
45,577.47 |
(2.1)% |
(5.2)% |
down |
neutral |
up |
|
|
Dow Jones Transport |
17,357.19 |
17,849.01 |
0.7% |
2.8% |
down |
up |
up |
|
|
NASDAQ |
23,241.99 |
21,647.67 |
(2.1)% |
(6.9)% |
down |
down (weak) |
up |
|
|
S&P/TSX Composite |
31,712.76 |
31,317.41 |
(3.8)% |
(1.3)% |
down |
up |
up |
|
|
S&P/TSX Venture (CDNX) |
987.74 |
911.53 |
(10.5)% |
(7.7)% |
down |
neutral |
up |
|
|
S&P 600 (small) |
1,467.76 |
1,466.68 |
(1.3)% |
(0.1)% |
down |
neutral |
up |
|
|
ACWX MSCI World x US |
67.18 |
66.37 |
(2.6)% |
(1.2)% |
down |
up |
up |
|
|
Bitcoin |
87,576.98 |
69,917.67 |
(1.8)% |
(20.2)% |
up |
down |
neutral |
|
|
|
|
|
|
|
|
|
|
|
|
Gold Mining Stock Indices |
|
|
|
|
|
|
|
|
|
Gold Bugs Index (HUI) |
701.49 |
683.13 |
(14.7)% |
(2.6)% |
down |
up (weak) |
up |
|
|
TSX Gold Index (TGD) |
817.76 |
782.49 |
(14.3)% |
(4.3)% |
down |
up (weak) |
up |
|
|
|
|
|
|
|
|
|
|
|
|
% |
|
|
|
|
|
|
|
|
|
U.S. 10-Year Treasury Bond yield |
4.17% |
4.39% |
2.3% |
5.3% |
|
|
|
|
|
3.3Cdn. 10-Year Bond CGB yield |
3.44% |
3.55% |
1.1% |
3.2% |
|
|
|
|
|
Recession Watch Spreads |
|
|
|
|
|
|
|
|
|
U.S. 2-year 10-year Treasury spread |
0.69% |
0.48% |
(12.7)% |
(30.4)% |
|
|
|
|
|
Cdn 2-year 10-year CGB spread |
0.85% |
0.48% |
(33.3)% |
(43.5)% |
|
|
|
|
|
|
|
|
|
|
|
|
|
|
|
Currencies |
|
|
|
|
|
|
|
|
|
US$ Index |
98.26 |
99.55 |
(0.9)% |
1.3% |
up |
up |
down |
|
|
Canadian $ |
72.87 |
72.87 |
0.1% |
flat |
down |
up |
neutral |
|
|
Euro |
117.48 |
115.63 |
1.2% |
(1.6)% |
down |
down |
up |
|
|
Swiss Franc |
126.21 |
126.82 |
0.3% |
0.5% |
down |
up (weak) |
up |
|
|
British Pound |
134.78 |
133.37 |
0.9% |
(1.1)% |
down |
down (weak) |
up |
|
|
Japanese Yen |
63.83 |
62.77 (new lows) |
0.2% |
(1.7)% |
down |
down |
down |
|
|
|
|
|
|
|
|
|
|
|
|
|
|
|
|
|
|
|
|
|
|
Precious Metals |
|
|
|
|
|
|
|
|
|
Gold |
4,311.97 |
4,498.96 |
(10.4)% |
4.3% |
down |
up |
up |
|
|
Silver |
71.16 |
67.99 |
(15.7)% |
(4.5)% |
down |
up |
up |
|
|
Platinum |
124.81 |
1,923.00 |
(5.0)% |
(6.1)% |
down |
up |
up |
|
|
|
|
|
|
|
|
|
|
|
|
Base Metals |
|
|
|
|
|
|
|
|
|
Palladium |
1,619.50 |
1,417.50 |
(9.2)% |
(12.5)% |
down |
neutral |
up |
|
|
Copper |
5.64 |
5.26 |
(6.6)% |
(6.7)% |
down |
neutral |
up |
|
|
|
|
|
|
|
|
|
|
|
|
Energy |
|
|
|
|
|
|
|
|
|
WTI Oil |
57.44 |
97.76 |
(1.6)% |
70.2% |
up |
up |
up |
|
|
Nat Gas |
3.71 |
3.10 |
(1.0)% |
(16.5)% |
down (weak) |
down |
neutral |
|
Source: www.stockcharts.com
* New All-Time Highs
Note: For an explanation of the trends, see the glossary at the end of this article.
New highs/lows refer to new 52-week highs/lows and, in some cases, all-time highs.
Copyright David Chapman 2026
GLOSSARY
Trends
Daily – Short-term trend (For swing traders)
Weekly – Intermediate-term trend (For long-term trend followers)
Monthly – Long-term secular trend (For long-term trend followers)
Up – The trend is up.
Down – The trend is down
Neutral – Indicators are mostly neutral. A trend change might be in the offing.
Weak – The trend is still up or down but it is weakening. It is also a sign that the trend might change.
Topping – Indicators are suggesting that while the trend remains up there are considerable signs that suggest that the market is topping.
Bottoming – Indicators are suggesting that while the trend is down there are considerable signs that suggest that the market is bottoming.
Disclaimer
David Chapman is not a registered advisory service and is not an exempt market dealer (EMD) nor a licensed financial advisor. He does not and cannot give individualised market advice. David Chapman has worked in the financial industry for over 40 years including large financial corporations, banks, and investment dealers. The information in this newsletter is intended only for informational and educational purposes. It should not be construed as an offer, a solicitation of an offer or sale of any security. Every effort is made to provide accurate and complete information. However, we cannot guarantee that there will be no errors. We make no claims, promises or guarantees about the accuracy, completeness, or adequacy of the contents of this commentary and expressly disclaim liability for errors and omissions in the contents of this commentary. David Chapman will always use his best efforts to ensure the accuracy and timeliness of all information. The reader assumes all risk when trading in securities and David Chapman advises consulting a licensed professional financial advisor or portfolio manager such as Enriched Investing Incorporated before proceeding with any trade or idea presented in this newsletter. David Chapman may own shares in companies mentioned in this newsletter. Before making an investment, prospective investors should review each security’s offering documents which summarize the objectives, fees, expenses and associated risks. Although Artificial Intelligence (AI) may be deployed from time to time, AI output is monitored and adjusted, if necessary, for accuracy. David Chapman shares his ideas and opinions for informational and educational purposes only and expects the reader to perform due diligence before considering a position in any security. That includes consulting with your own licensed professional financial advisor such as Enriched Investing Incorporated. Performance is not guaranteed, values change frequently, and past performance may not be repeated.
About the author


Website: https://www.enrichedinvesting.com
Disclaimer: David Chapman is not a registered advisory service and is not an exempt market dealer (EMD) nor a licensed financial advisor. We do not and cannot give individualised market advice. David Chapman has worked in the financial industry for over 40 years including large financial corporations, banks, and investment dealers. The information in this newsletter is intended only for informational and educational purposes. It should not be considered a solicitation of an offer or sale of any security. The reader assumes all risk when trading in securities and David Chapman advises consulting a licensed professional financial advisor before proceeding with any trade or idea presented in this newsletter. David Chapman may own shares in companies mentioned in this newsletter. We share our ideas and opinions for informational and educational purposes only and expect the reader to perform due diligence before considering a position in any security. That includes consulting with your own licensed professional financial advisor.