Due to our upcoming move, reports going forward will be shorter ones until we get resettled.
The Fed as expected left rates unchanged. Fed Chair Jerome Powell noted that inflation was sticky; he did not feel we were entering a period of stagflation. The April jobs report (Chart of the week, page 5) was weaker than expected and pundits now believe the Fed could cut rates in September. Consumer confidence is also waning according to the latest Conference Board consumer confidence index.
All this excited the markets that went on and put in an up week. Not for commodities as gold and oil both fell despite a decline in the US$ Index. The materials sector dragged down the TSX Composite on the past week. The EU indices also faltered this past week as economic weakness persists. Is the excitement in the stock market premature? A sucker's rally? While for commodities it could be a shake out before the next leg up. This could benefit Lundin Gold Inc., for example, which pays a dividend, is held in the Enriched Capital Conservative Growth Strategy,* and is expected to have increased exposure to rising gold prices and increased amounts of free cash flow, once its buyout of the Stream Facility and Offtake is complete as it will then be debt-free.
Another U.S. regional bank went under and there are many more on the watch list for potential failure. We look at banking panics and crises and discover that on average there is one every 3-4 years. Every now and then there is a severe one like the 1930's Great Depression and the Great Recession and the financial crisis of 2007-2009. Behind every recession, one can usually find a banking crisis.
April showers bring May flowers. Also brings us sell in May and go away.
Have a great week!
DC
“An interesting thing happened in 1989, right as I was graduating: the stock market crashed and really changed the landscape of the art world in New York. It made the kind of work I was doing interesting to galleries that wouldn't have normally been interested in it.”
—Matthew Barney, American contemporary artist, film director, creator of The Cremaster Cycle 1994-2002; b. 1967
“History proves…that a smart central bank can protect the economy and the financial sector from the nastier side effects of a stock market collapse.”
—Ben Bernanke, American economist, 14th Chairman of the Federal Reserve 2006–2014, Chairman, Council of Economic Advisors 2005–2006, distinguished fellow Brookings Institution, former professor Princeton University; b. 1953
“I've learned that things change. The whole boy band thing almost turned into a stock market crash.”
—Max Martin, Swedish record producer and songwriter, production producer for 1990s hits, including the Backstreet Boys, many hits on Billboard; b. 1971
On April 26, Federal regulators seized Philadelphia Republic First Bancorp. The bank was sold to Fulton Bank, a unit of Fulton Financial (FULT). It was the first bank failure of 2024. Republic First was not a particularly large bank as it had only $6 billion in assets.
Still, it was a sign that the banking crisis that got underway in 2023 may not be over. In 2023, five banks went under, including the second, third, and fourth largest regional bank failures in the U.S.—Silicon Valley Bank, Signature Bank, First Republic Bank, Heartland Tri-State Bank, and Citizens Bank. Not since 2017 and the 2008 financial crisis before that had so many banks gone under in the same year. Banks going under in the U.S. almost seems to be a regular occurrence. There are currently 186 banks in the U.S. that are at risk of failure or collapse due to high interest rates and a high proportion of uninsured deposits.
As of October 2023, there remained 4,049 commercial banks and 565 savings and loan associations. None, of course, were the big money center banks led by JP Morgan Chase, Bank of America, Citigroup, Wells Fargo, Goldman Sachs, and Morgan Stanley. Regional banks, it seems, can go under, but the potential failure of a large money center bank would bring massive intervention by the monetary authorities to prevent a financial meltdown.
For comparison, Canada, where we are located, has only 35 banks plus 3 regulated credit unions. Like the U.S. money center banks, Canada has the six large ones known as the “Big Six”: Royal Bank (RBC), Toronto-
Dominion Bank (TD), Canadian Imperial Bank of Commerce (CIBC), Bank of Montreal (BMO), Bank of Nova Scotia (BNS), and the smallest, National Bank of Canada (NBC).
Banking and financial crises, it seems, are a regular occurrence. There were banking crises noted as far back as the first century when Roman banking houses fell. An entire book was dedicated to them, This Time is Different, Eight Centuries of Financial Folly, by Carmen M. Reinhart and Kenneth S. Rogoff (2009). Some of them are famous—Tulip Mania (1637), the South Sea Bubble (1720), the Great Depression (1929–1930), the 1970s energy crisis with the OPEC price shock (1973), the savings and loan crisis in the late 1980s to early 1990s, the Japanese asset price bubble (1986–1992), and, more recently, the Great Recession (2008–2010) and the European debt crisis (2009–2019). There were many others.
Banking panics also appear to occur regularly. Since 1900, there have been at least 34 banking and financial panics. Many of them resulted in recessions, including the Great Depression (1929–1939) and the Great Recession (2007–2009). That’s one roughly every 3–4 years. Not all of them had a global impact. Some of them were isolated to the countries where they occurred.
Numerous financial crises have broken out over the past century. They also appear to have quickened after the world went off the gold standard in 1971. Since 1971 we’ve had five stock market crashes of note: the energy crisis crash (1973–1974), the October panic (1987), the dot.com crash (2000–2002), the global financial crisis (2007–2008), and the pandemic crash (2020). Those are just the ones in North America. Elsewhere, we had the Japanese bubble burst (1990–1992), the Asian financial crisis (1997), the Russian currency and banking collapse (1998), the September 11 (9/11) crash, the China stock market bubble crash 2007, the European debt crisis 2010–2014, China again (2015), the cryptocurrency crash (2018), the Russian stock market crash (2022), and the Chinese real estate crash (2024).
We’ve also had a number of currency crises. Most notable was the collapse of the Bretton Woods system that got underway in the 1960s. After the end of the gold standard in 1971 the world was taken off the fixed exchange rate system and the U.S. dollar backed by gold, and entered a period of fiat currencies floating against each other with the U.S. dollar as the reserve currency. Other notable currency crises were the attack against the British pound sterling that forced Britain to withdraw from the European Exchange Rate Mechanism (1992), the Mexican peso crisis (1994), the Asian financial crisis (1997), the Russian ruble collapse and banking crisis (1998), the collapse of the Argentinian peso, financial crisis, and depression (2000–2002), and the previously mentioned financial crisis of 2007–2009. One could also add the gold crash of 2013 if one considers gold as a currency.
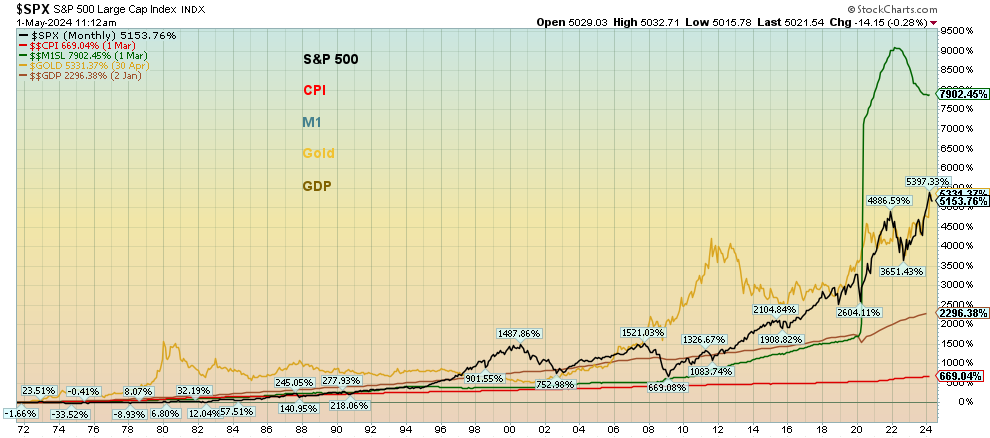
Since the end of the gold standard in August 1971, the world has not only seen an unusual number of crashes and crises, but we’ve also seen money and debt explode. Our chart below shows the performance of the S&P 500 vs. the CPI, M1 money supply, gold, and GDP. Not shown are U.S. federal debt and U.S. all debt (government, corporate, and consumer).
Leading the way is an explosion in money (M1), up 7,902%. Gold is up 5,331%, showing its ability to hold value. The S&P 500 is up 5,154%, GDP is up 2,296%, while the CPI is up only 669%. Not shown (no data available on
StockCharts) is federal debt, up 8,422%, and all debt (government, corporate, and consumer), up 5,719%. These numbers are for the U.S. only. The growth of debt and money has outpaced the rise in the S&P 500 by 1.6 times for U.S. federal debt and by 1.5 times for M1 money supply. When compared to GDP growth, federal debt has outpaced GDP by 3.7 times and M1 has outpaced GDP by 3.4 times. In dollar terms, U.S. federal debt is up by $34.5 trillion whereas GDP is up only $27.2 trillion, implying it took $1.26 of federal debt to purchase $1 of GDP. Over time that number has gone up further. It takes an increasing amount of debt to purchase an additional dollar of GDP. In 1971 the U.S. Federal debt to GDP was 35%. Today it is 122%, a 3.5-times increase. The federal debt to GDP is higher today than it was in 1946 as World War II was winding down.
That is the prime reason that we say the Fed and all the central banks are between a rock and hard place. Their ability to deal with the next financial crisis is extremely limited. That’s why there are now bail-ins, not bail-outs and why things appear to be deteriorating, even as the stock markets are near all-time highs and unemployment is near record lows. Inequity has grown. In 1971, the Gini coefficient, a measurement of inequity (0 is no inequity, 100 is absolute inequity), was 36.9% in 1971. Today, it is 42.0% as inequity has grown over time. Some have reported it even higher as wealth becomes more and more concentrated in fewer hands. Canada was last reported as 31.7%. The highest reported is South Africa at 63%.
Performance Selected Measurements 1971–2024
Source: www.stockcharts.com
Is Republic First Bancorp just another canary in the coal mine? The world has endured numerous crises since 1971, with each subsequent crisis seemingly worse than the previous one. Today we are faced with wars, deep polarization and divisions both geopolitical and domestic, a growing climate crisis, and debt that is out of control. Solutions are few and often the ones on offer are from populist and extremist parties.
“It was the best of times, it was the worst of times, it was the age of wisdom, it was the age of foolishness, it was the epoch of belief, it was the epoch of incredulity, it was the season of light, it was the season of darkness, it was the spring of hope, it was the winter of despair.”
—Charles Dickens, English novelist, social critic, A Tale of Two Cities (1859); 1812–1870
Chart of the Week
US Job Numbers
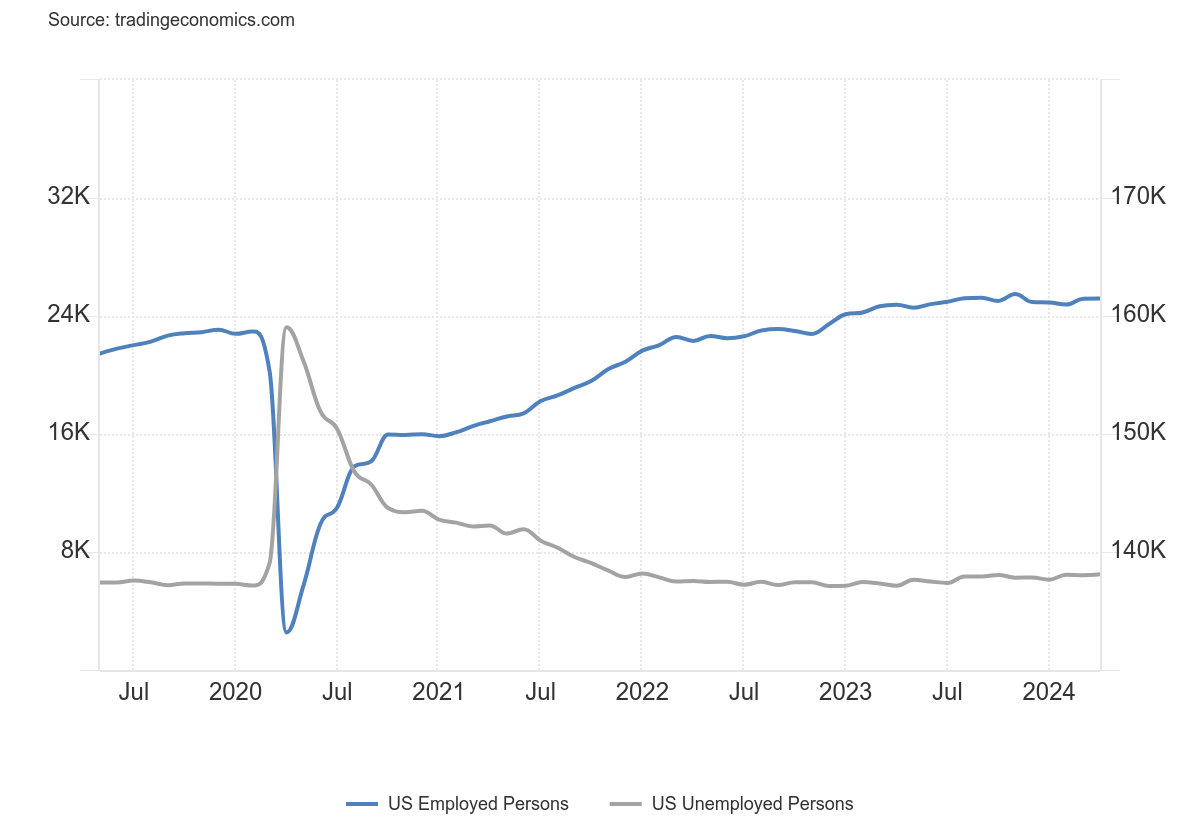
Employed Persons vs. Unemployed Persons 2019–2024
Source: www.tradingeconomics.com, www.bls.gov
We finally got nonfarm payrolls that were below expectations. The number was the weakest in six months. This has got the market excited so that they have moved their thoughts on a Fed rate cut up to September from December. Possibly helping are rumours that the Bank of England (BOE) may cut as soon as next week. The U.K. is already in a mild recession (two consecutive quarters of negative growth). The most recent quarter for the U.S. was lower than expected, an event that got many excited that the Fed may cut sooner than later. But the Fed is data driven and is also watching inflation tick higher. Despite their denial of stagflation, that is what it may very well be.
Nonfarm payrolls for April came in at 175,000, below the expected 238,000. In March, nonfarm was 315,000, an upward revision from 303,000. Nonfarm payrolls come from the Establishment survey, meaning they contact business to determine how many are on the payroll. The Household survey, which covers almost everything else, can be quite different even if over time it balances out.
The weaker than expected nonfarm did set the U.S. 2-year treasury note back as yields dropped from 5.00% to 4.78%. That narrows the spread with the U.S. 10-year treasury note to 31 bp. The U.S. dollar fell against other major currencies, but gold’s response was feeble. Stock markets rallied.
The civilian labour force grew by only 87,000 in April, even as the employment level only grew 25,000. The population level of those 15 years of age and older grew by 182,000. Those not in the labour force also grew up 94,000 in the month. More people are eligible to work, yet more people are joining the not in labour force category, even as the labour force grew and the total employed grew even less.
The unemployment rate (U3) ticked higher to 3.9% from 3.8%, while the U6 unemployment level (plus all persons marginally attached to the labour force, plus total employed part time for economic reasons, as a percent of the civilian labour force, plus all persons marginally attached to the labour force) rose as well to 7.4% from 7.3%. The Shadow Stats (www.shadowstats.com) number is U6 plus long-term discouraged workers defined out of the labour force in a 1994 revision. This number combined with short-term discouraged workers (U6) forms the Shadow Stats number. Shadow Stats unemployment rose to 25.9% from 25.8%.
The labour force participation rate was unchanged at 62.7% while the employment population ratio was 60.2% vs. 60.3% in March. What that means is fewer people as a percentage of the labour force are working. According to the household survey, only 25,000 more were working in April vs. March. However, full-time jobs jumped, up 132,940 on the month while part-time fell 914,000.
The average number of weeks unemployed also fell down 1.7 weeks to 19.9 weeks from 21.6 weeks. The number for unemployed 27 weeks or longer also fell down 88,000. The average work week was unchanged at 34.3 hours. Private sector payrolls fell 76,000.
Average hourly earnings slowed, rising 3.9% year-over-year (y-o-y), down from 4.1% the previous month. Slowing jobs, slowing wages. But inflation remains sticky. All this was music to the ears of the market as it shot up. Bond yields fell. Gold did nothing. The Goldilocks economy? Beats the U.K. already in recession. Nonetheless, the Fed remains fixated on numbers, not the emotions of the stock market. Oil prices fell.
Slowing jobs, falling bond yields, rising stock market. Music to the Fed’s ears. Music to the market.
Canada reports its job numbers next Friday.
Markets & Trends
|
|
|
|
% Gains (Losses) Trends |
|
||||
|
|
Close Dec 31/23 |
Close May 3, 2024 |
Week |
YTD |
Daily (Short Term) |
Weekly (Intermediate) |
Monthly (Long Term) |
|
|
Stock Market Indices |
|
|
|
|
|
|
|
|
|
S&P 500 |
4,769.83 |
5,127.29 |
0.6% |
7.5% |
neutral |
up |
up |
|
|
Dow Jones Industrials |
37,689.54 |
38,675.68 |
1.1% |
2.6% |
neutral |
up |
up |
|
|
Dow Jones Transport |
15,898.85 |
15,348.40 |
1.2% |
(3.5)% |
down (weak) |
down (weak) |
up |
|
|
NASDAQ |
15,011.35 |
16,156.33 |
1.4% |
7.6% |
neutral |
up |
up |
|
|
S&P/TSX Composite |
20,958.54 |
21,947.21 |
(0.1)% |
4.7% |
neutral |
up |
up |
|
|
S&P/TSX Venture (CDNX) |
552.90 |
581.70 |
(0.8)% |
5.2% |
up |
up |
down |
|
|
S&P 600 (small) |
1,318.26 |
1,301.48 |
1.4% |
(1.3)% |
up (weak) |
neutral |
up |
|
|
MSCI World |
2,260.96 |
2,300.36 |
0.7% |
1.7% |
down |
up |
up |
|
|
Bitcoin |
41,987.29 |
62,973.32 |
(1.5)% |
50.0% |
down |
up |
up |
|
|
|
|
|
|
|
|
|
|
|
|
Gold Mining Stock Indices |
|
|
|
|
|
|
|
|
|
Gold Bugs Index (HUI) |
243.31 |
260.64 |
(3.2)% |
7.1% |
up |
up |
up |
|
|
TSX Gold Index (TGD) |
284.56 |
311.11 |
(3.0)% |
9.3% |
up |
up |
up |
|
|
|
|
|
|
|
|
|
|
|
|
% |
|
|
|
|
|
|
|
|
|
U.S. 10-Year Treasury Bond yield |
3.87% |
4.52% |
(3.0)% |
16.8% |
|
|
|
|
|
Cdn. 10-Year Bond CGB yield |
3.11% |
3.68% |
(4.4)% |
18.3% |
|
|
|
|
|
Recession Watch Spreads |
|
|
|
|
|
|
|
|
|
U.S. 2-year 10-year Treasury spread |
(0.38)% |
(0.31)% |
8.8% |
18.4% |
|
|
|
|
|
Cdn 2-year 10-year CGB spread |
(0.78)% |
(0.53)% |
(3.9)% |
32.1% |
|
|
|
|
|
|
|
|
|
|
|
|
|
|
|
Currencies |
|
|
|
|
|
|
|
|
|
US$ Index |
101.03 |
105.06 |
(1.0)% |
4.0% |
up (weak) |
up |
up |
|
|
Canadian $ |
75.60 |
73.14 |
(0.2)% |
(3.3)% |
down (weak) |
down |
down |
|
|
Euro |
110.36 |
107.61 |
0.6% |
(2.5)% |
neutral |
down |
down (weak) |
|
|
Swiss Franc |
118.84 |
110.47 |
1.0% |
(7.0)% |
neutral |
down |
neutral |
|
|
British Pound |
127.31 |
125.47 |
0.5% |
(1.5)% |
neutral |
down (weak) |
down (weak) |
|
|
Japanese Yen |
70.91 |
65.33 |
3.2% |
(7.9)% |
neutral |
down |
down |
|
|
|
|
|
|
|
|
|
|
|
|
|
|
|
|
|
|
|
|
|
|
Precious Metals |
|
|
|
|
|
|
|
|
|
Gold |
2,071.80 |
2,308.60 |
(1.6)% |
11.4% |
neutral |
up |
up |
|
|
Silver |
24.09 |
26.69 |
(2.1)% |
10.8% |
neutral |
up |
up |
|
|
Platinum |
1,023.20 |
965.30 |
4.7% |
(5.7)% |
up |
neutral |
down (weak) |
|
|
|
|
|
|
|
|
|
|
|
|
Base Metals |
|
|
|
|
|
|
|
|
|
Palladium |
1,140.20 |
948.40 |
(1.0)% |
(16.8)% |
down |
down |
down |
|
|
Copper |
3.89 |
4.56 |
(0.2)% |
17.2% |
up |
up |
up |
|
|
|
|
|
|
|
|
|
|
|
|
Energy |
|
|
|
|
|
|
|
|
|
WTI Oil |
71.70 |
78.11 |
(6.9)% |
8.8% |
down |
up (weak) |
up (weak) |
|
|
Nat Gas |
2.56 |
2.14 |
11.5% |
(16.4)% |
up |
down |
down |
|
Source: www.stockcharts.com
Note: For an explanation of the trends, see the glossary at the end of this article.
New highs/lows refer to new 52-week highs/lows and, in some cases, all-time highs.
- * New All-Time Highs
Source: www.stockcharts.com
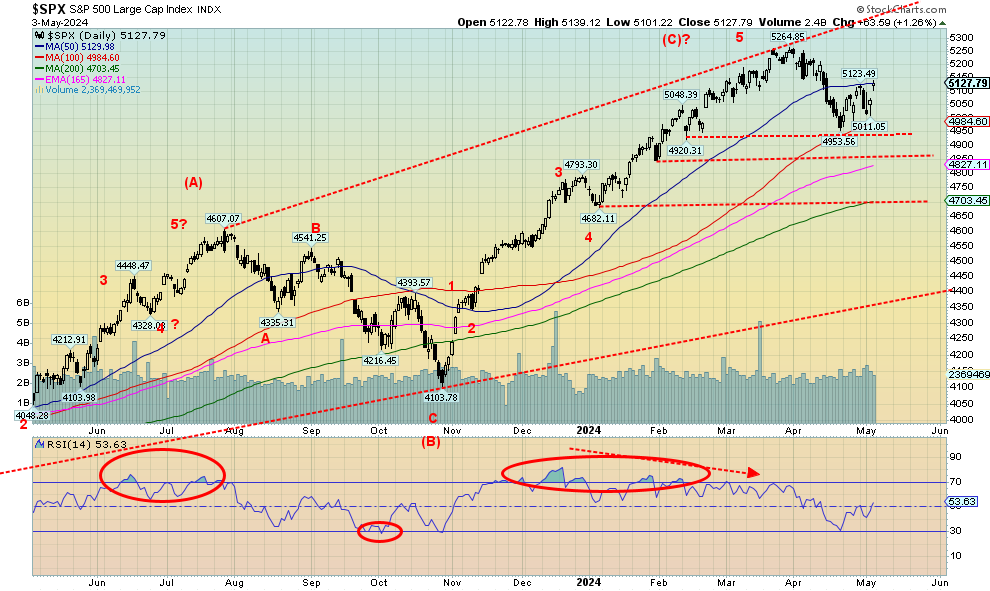
Thanks to the weaker than expected jobs report, coupled with thoughts that the Fed could cut rates in September, stocks rallied this past week. Also helping was the supposed easing of geopolitical tensions. That’s irrespective of the campus riots, which are having little or no impact on markets. All we have done so far is to turn the daily trend neutral from down and we are now testing the 50-day MA. A move above 5,200 would be more positive and suggest new highs ahead. First 5,000, then 4,900 remain the breakdown points. Below 4,800 a bigger breakdown occurs. Below 4,700 and we are most likely in a bear market.
The S&P 500 gained 0.6% this past week, the Dow Jones Industrials (DJI) was up 1.1%, the Dow Jones Transportations gained 1.2%, and the NASDAQ jumped 1.4%. The S&P 400 (Mid) was up 1.2% while the S&P 600 (Small) gained 1.4%. Bitcoin fell this week, losing 1.5%, but continues to hold above $60,000. In Canada, the TSX Composite lost 0.1%, thanks to weakness from the commodity sector while the TSX Venture Exchange (CDNX) was down 0.8%.
In the EU, the London FTSE continued to make new all-time highs, up 0.9%, the EuroNext fell 1.0%, the Paris CAC 40 lost 1.6%, and the German Dax was off 0.9%. Not a good week for the European exchanges. In Asia, China’s Shanghai Index was up 0.5%, the Tokyo Nikkei Dow (TKN) was up 0.8%, while Hong Kong’s Hang Seng (HSI) was the best, up 7.1% to new 52-week highs.
Volume wasn’t particularly robust on the rebound this past week. That makes us believe this is just a rebound rally and not the start of a new up leg. We’d have to regain above 5,200 to suggest the decline might be over. It’s “sell in May and go away” time of the year. No, that saying does not always hold and it remains an urban legend. Since 1950 there have been 45 up months and only 28 down months. Still, the period is the worst six-month performance compared to the best six-month performance from November to April. Crashes often occur in the worst six-month period. Indeed, weak Mays are usually followed by a rebound into the summer before a sell-off gets underway that sometimes culminates in crashes in September/October.
The recent sell-off turned the market down and this appears to be nothing more than a relief/rebound rally. Our expectations are that it will fail. A “suckers” rally?
Source: www.conference-board.org, www.nber.org
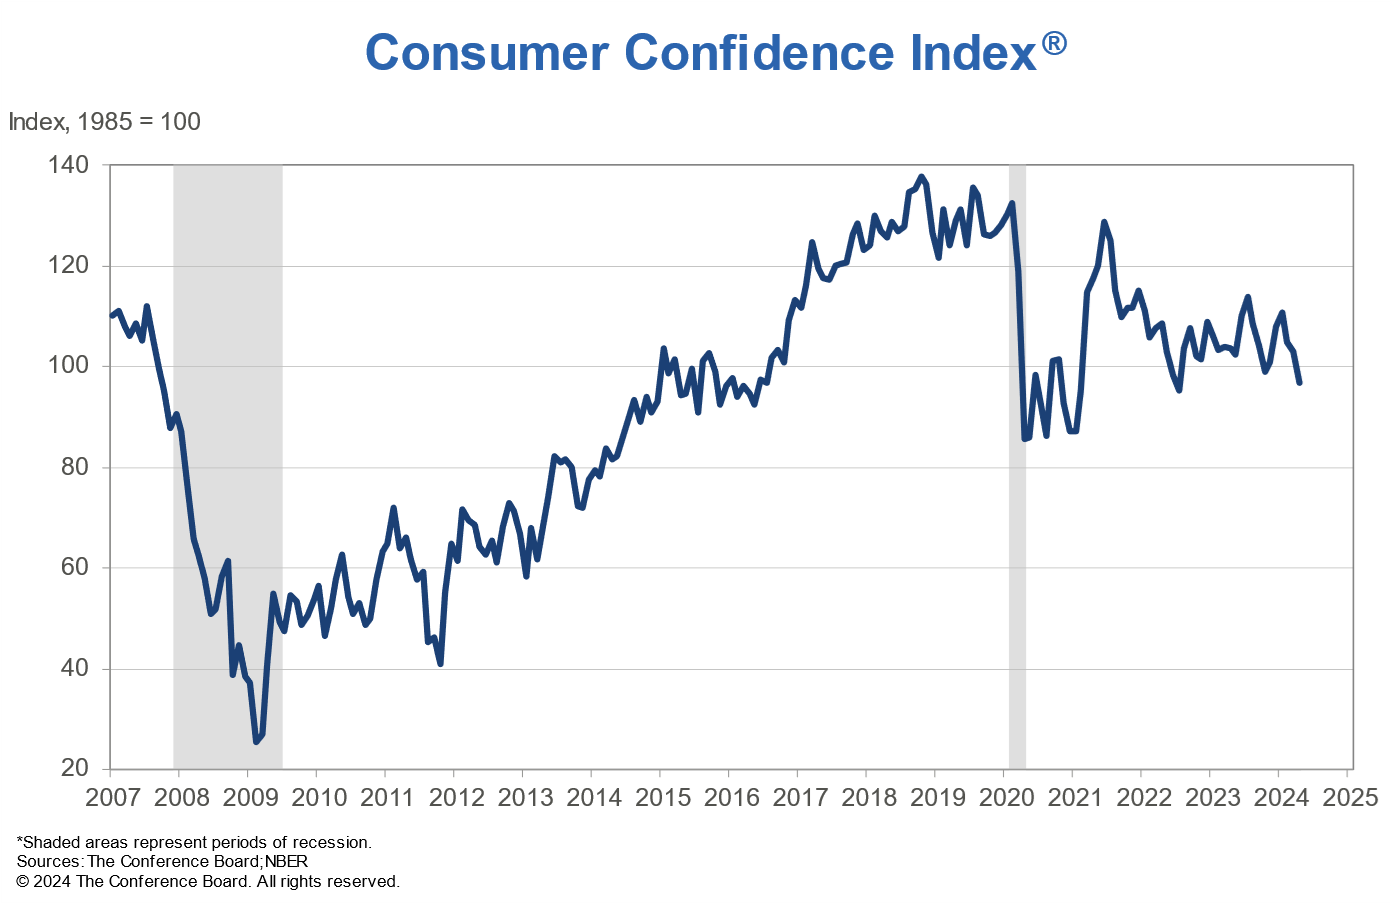
The Consumer Confidence Index, according to the Conference Board, fell to 142.9 in April following a downwardly revised 146.8 for March. The Expectations Index fell to 66.4 from an upwardly revised 74.0. The Expectations Index below 80 usually signals a forthcoming recession.
Higher interest rates have not, it appears, impacted the stock market but they are impacting consumer confidence. The huge massive fiscal stimulus as a result of the pandemic took the U.S. and others out of the
recession quickly. It boosted corporate profits and certainly lifted the stock market. Initially the consumer was able to save but then it appears they went on a spending binge quickly depleting the savings. Then came higher interest rates as a result of the generated inflation. That in turn is now suppressing spending at a time when those savings have been largely depleted. Inflation also occurred because of the outbreak of the Russia/Ukraine war which added to all the supply disruptions and soaring oil prices. It’s now suppressing consumer confidence.
There is no recession yet. But with sticky inflation and depleted savings the consumer’s confidence is starting to wane. Now it needs an accident and we could easily see a plunge as we saw during the 2008 financial crisis.
Source: www.stockcharts.com
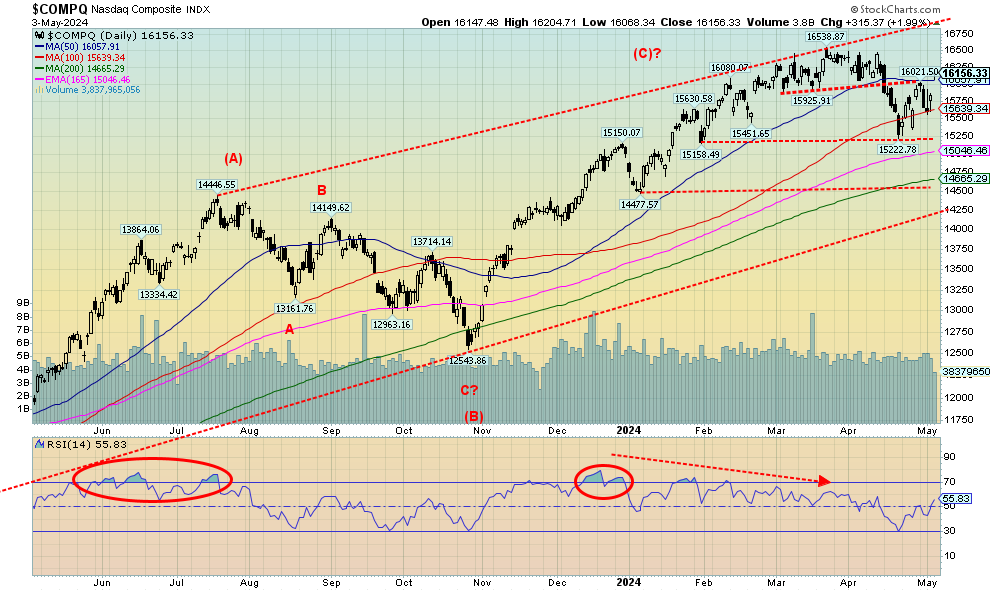
The NASDAQ rose 1.4% this past week, thanks to the return of the Magnificent Seven as the NY FANG Index jumped 1.8%. Not all the Magnificent Seven jumped this past week, but Apple gained 8.3%, Amazon was up 3.7%, Netflix was up 3.2%, and Tesla jumped 7.7%. Google fell 2.7%. The biggest gain on the week was Baidu, up 12.8% while Alibaba was up 7.7%. Broadcom lost 4.9% and AMD was off 4.3%. The NASDAQ jumped above the 100-day MA and is trying to jump above that small topping pattern trend line near 16,000. The NASDAQ closed at 16,156. Above 16,225 new highs are possible. That channel’s top is now near 16,750. So far, this looks like a rebound after the start of a decline. Not the start of a new upswing. Volume was not high despite being egged on by the weaker than expected jobs report and rumblings of a September rate cut by the Fed. On the downside, the fall continues with new lows under 15,220. The downtrend has weakened but hasn’t turned positive.
Source: www.stockcharts.com
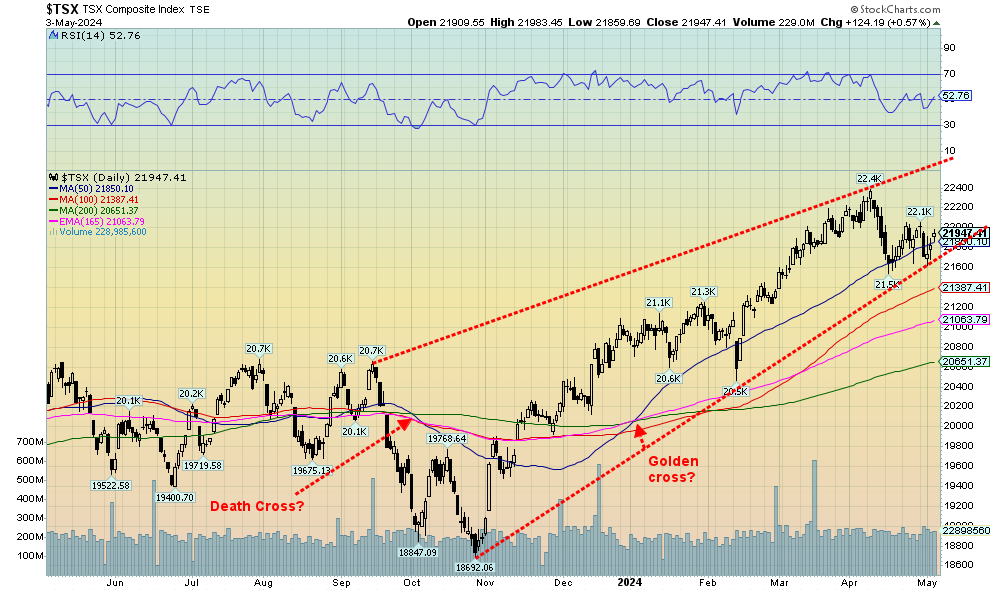
The TSX Composite did not join the rally party on Wall Street this past week. The TSX was dragged down by underperformance in energy, materials, golds and metals. They were the leaders on the way up, so when they falter the TSX falls. Given strong performances from interest rate sensitive sectors, the TSX fell only 0.1%. The TSX Venture Exchange (CDNX) was off 0.8% as it continues to struggle. Of the 14 sub-indices, seven fell and seven rose. Leading the way up were Income Trusts TCM, up 4.5%, and Utilities TUT up 4.4%. Health Care THC gained 3.2%. The biggest loser was Energy TEN, off 3.9%. Given it is the second largest component of the TSX, it helped drag the entire index down. Golds TGD lost 3.0% while Metals & Mining TGM were off 1.5% and Materials fell 2.0%. During that long rally from the October 2023 low it was Energy, Metals & Mining, Golds and Materials that led the way up. They still remain the leaders on the TSX for the year. Just not last week. Technically, we appear to be testing an uptrend line from the October 2023 low and the 50-day MA. A firm break under 21,600 would, however, point to lower prices for the TSX. Support is seen down to 21,400, 21,000, and 20,600. Under 19,600 the odds of new lows below the October low of 18,692 becomes probable. Above 22,100 we could rebound further. Above 22,200 new highs could be seen.
U.S. 10-year Treasury Note, Canada 10-year bond CGB
Source: www.tradingeconomics.com, www.home.treasury.gov, www.bankofcanada.ca
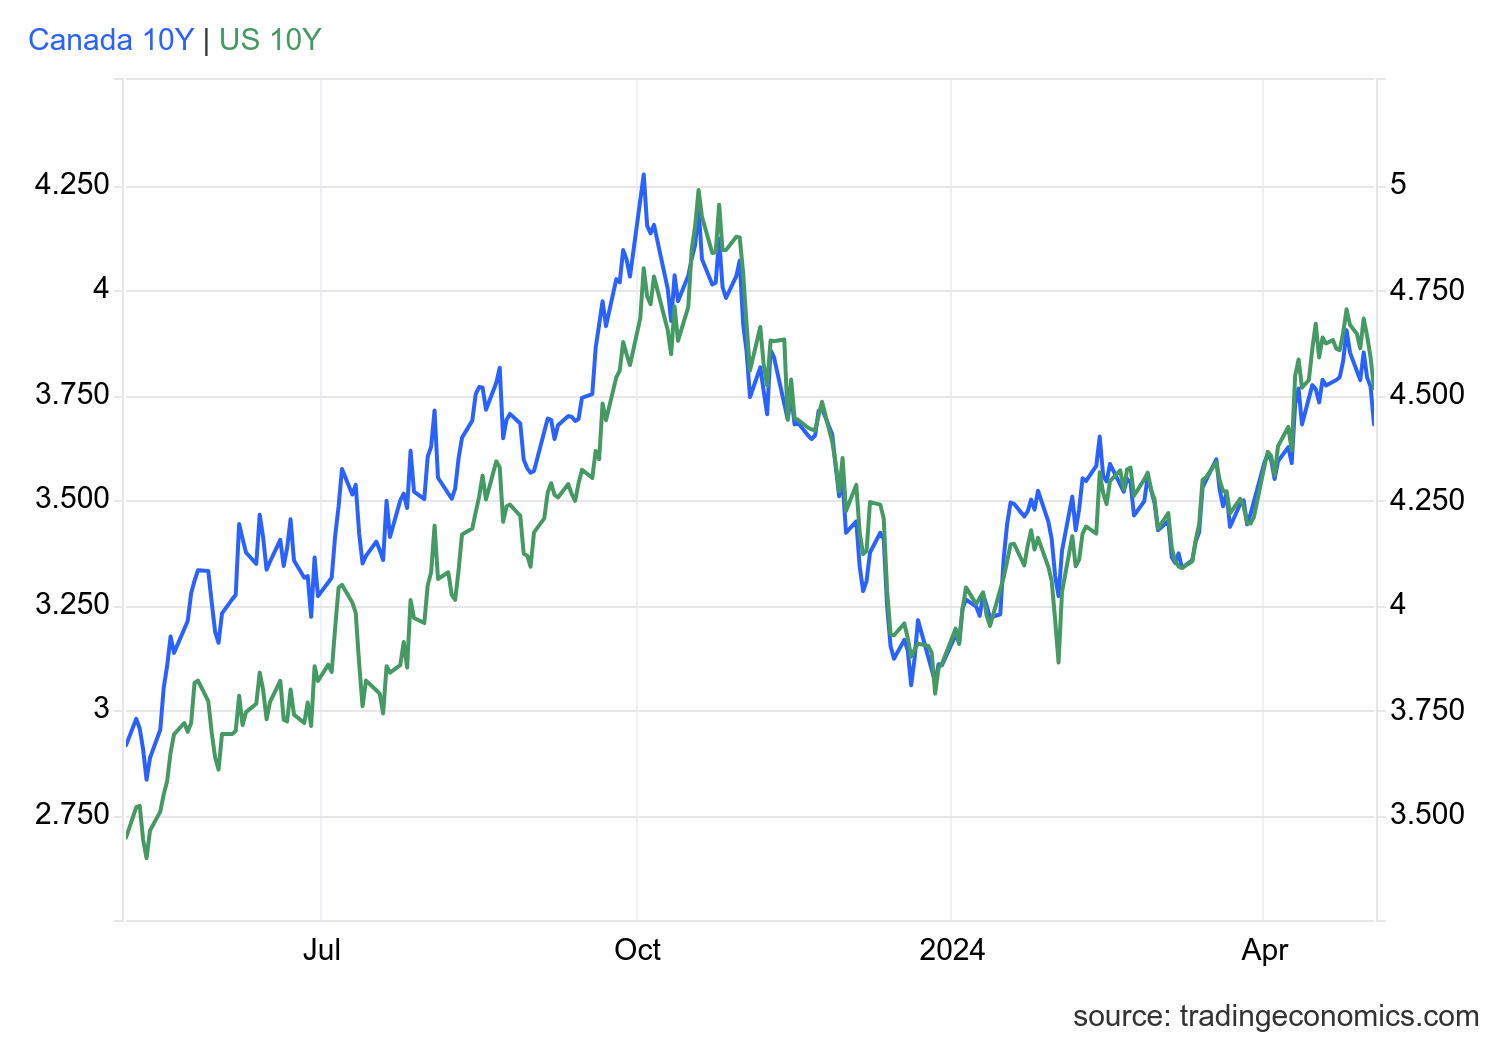
Thanks to the weaker than expected jobs report, U.S. treasuries saw prices rise and yields fall this past week. The weak jobs report prompted everyone to revise once again thoughts on when the Fed will cut rates. September is now the consensus. The Fed interest rate decision also occurred this week. Rates, as expected, were left unchanged. Fed Chair Jerome Powell spoke afterward and, as usual, was ambiguous about rate cuts and inflation. Thought there was no stagflation. But then, as we have so often noted, what did one expect him to say? After all, inflation was just transitory until it became obvious it was not and there is no stagflation until it becomes obvious there is. Stating the obvious is simply justification for traders to react the opposite way and could trigger sell-offs or even the opposite. It’s not the job of the Fed Chair to manipulate the stock market.
The 10-year U.S. treasury note fell to 4.52%, down from 4.66%. The Canadian Government of Canada 10-year bond (CGB) dropped to 3.68% from 3.85%. The 2–10 spreads were mixed with the U.S slightly lower at negative 31 bp and Canada at negative 53 bps. Recessions don’t usually start until the spread is closer to zero. So, this could be the Goldilocks economy. Not too hot, not too cold.
Other economic numbers were mixed. One that stood out was the Case-Shiller home price y-o-y that rose 7.3% above the expected 7.0%. Canada’s surprise was on the downside as the March GDP was at 0% when they expected a rise of at least 0.1%.
So far, this looks like a pullback with a period of rising rates. Under 4.25%, however, could signal lower yields ahead. With inflation ticking up, yields might not have much further to fall.
Source: www.stockcharts.com
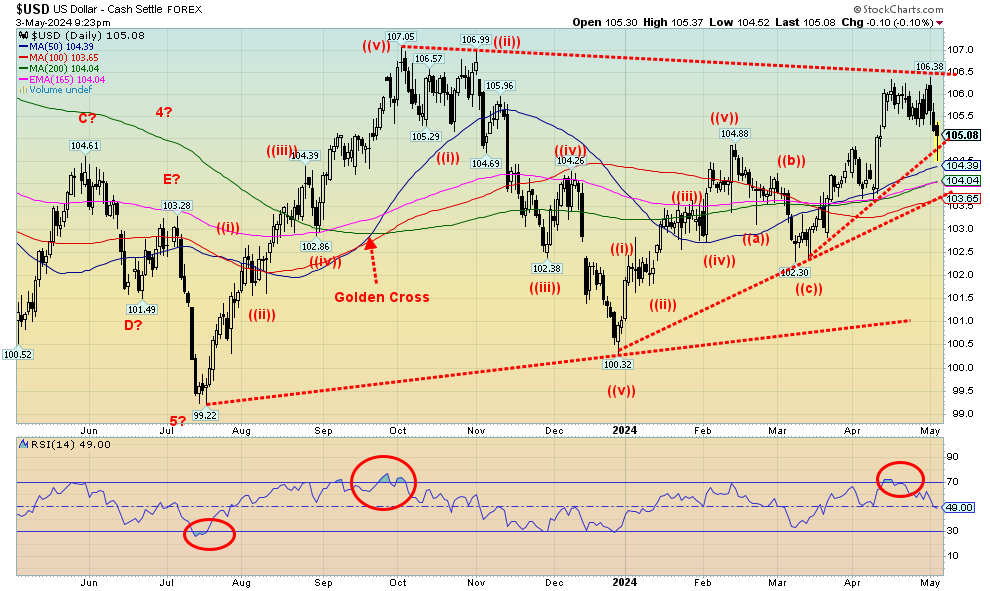
The US$ Index finally dropped this past week after the report of the lower-than-expected job numbers. The US$ Index lost about 1.0%. The main beneficiary was the Japanese yen that leaped 3.2%. The up move came as a result of heavy BOJ intervention in the markets. Part of the reason the yen dropped, other than being deeply oversold, is due to expectations of the Fed cutting rates into September. There is little expectation that the BOJ will cut rates, despite the perennially weak state of the Japanese economy. The latest holdings of U.S. treasuries by foreign entities show the BOJ added in February. But we don’t as yet have the March/April numbers.
Other currencies saw the euro rise 0.6%, the Swiss franc up 1.0%, and the pound sterling up 0.5%. The Cdn$ fell a small 0.2%. One area that had been impacting the Japanese yen is arbitrage players. They sell yen to buy dollars, and then use the dollars to purchase U.S. bond securities at considerably higher yields. As long as the yen remains weak, it’s a lucrative carry trade. But reversing it is not easy as you need players going the opposite way. But with ultra-low interest rates in Japan, there is no argument to support switching from dollars to yen. This arbitrage play only works selling for dollars and buying yen.
Support is here, but a solid break under 104 would signal a further decline towards 103. However, we also note support around 103.65, so falling to that level would not necessarily end the dollar rally. The technical pattern, however, suggests lower not higher.
Source: www.stockcharts.com
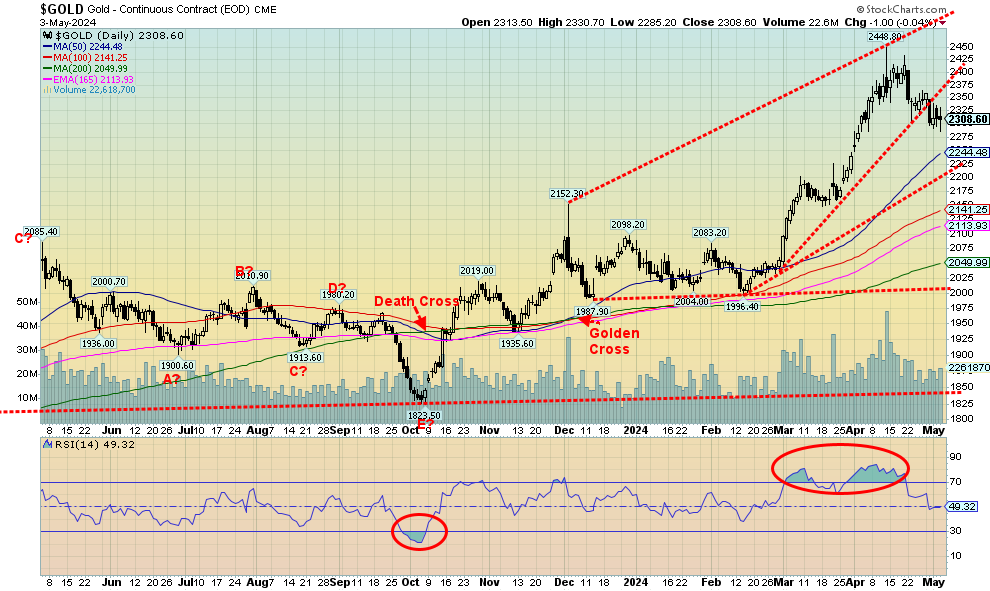
Gold had a rough week, despite the weaker than expected job numbers and a weaker US$ Index. With signs that we are headed for stagflation plus continued tensions on the geopolitical front, gold should have been higher, not lower. On the week, gold lost 1.6%, silver fell 2.1%, and platinum surprised, gaining 4.7. The near precious metals saw palladium lose 1.0% while copper consolidated, off a small 0.2%. The gold stock indices joined the metals as the Gold Bugs Index (HUI) fell 3.2% and the TSX Gold Index (TGD) was off 3.0%.
As to stagflation fears, Fed Chair Jerome Powell dismissed it. But then it is a statement we’d expect just as the Fed also said inflation was transitory. The trouble is, inflation remains stickily high while we are seeing the economy begin to slow, suggesting stagflation. That employment continues to be good is not unusual either.
Unemployment usually peaks after the recession ends not before. Wage growth also continues to be stronger than the Fed would prefer. Wages grew 4.4% y-o-y, not consistent with the Fed’s 2% inflation.
With the weakness in the jobs report and growing expectation that the Fed will cut rates in September, the fact that gold fell even as the stock market soared and the U.S. dollar fell was a surprise. Gold also broke the trendline up from the February 2024 low. However, the volume was not very high, suggesting that this breakdown is more like a waffle down than a breakdown. We continue to hold above $2,300. Further support can easily be seen, down to $2,240/$2,250. A breakdown under $2,200/$2,225 would be more problematic as we’d question the rally.
The positive aspect of this consolidation is that we have eased the overbought conditions that have prevailed. Volume rose sharply on the rise and, in typical corrective action, volume has tailed off considerably. A golden cross remains firmly in place, but then it is a lagging technical indicator. The only question we have is, is this a five-wave decline or merely a zig-zag? The gold bug bull-boards remain extremely bullish, which is a small negative as bullish extremism usually translates into “they are wrong.”
As we have so often noted, gold remains a lightly owned commodity as the focus remains on AI stocks. But central banks have noticed and in the desire to de-dollarize they keep adding to their gold reserves particularly the BRICs countries. Except, of course, the Bank of Canada (BofC) that sold all their gold back in 2016, the only major country to do so. The Bank of England (BOE) also sold off a good amount of their gold holdings and criticism of that action now dominates some discussions.
Still, the signs remain positive for gold and we should eventually see $3,500. The commercial COT remains low at 26.4% when we’d prefer to see that at least in the mid 30s to suggest higher prices. Below $2,300 we could fall further towards $2,200. Above $2,400 we should start the process of testing or exceeding the recent high of $2,449.
Source: www.stockcharts.com
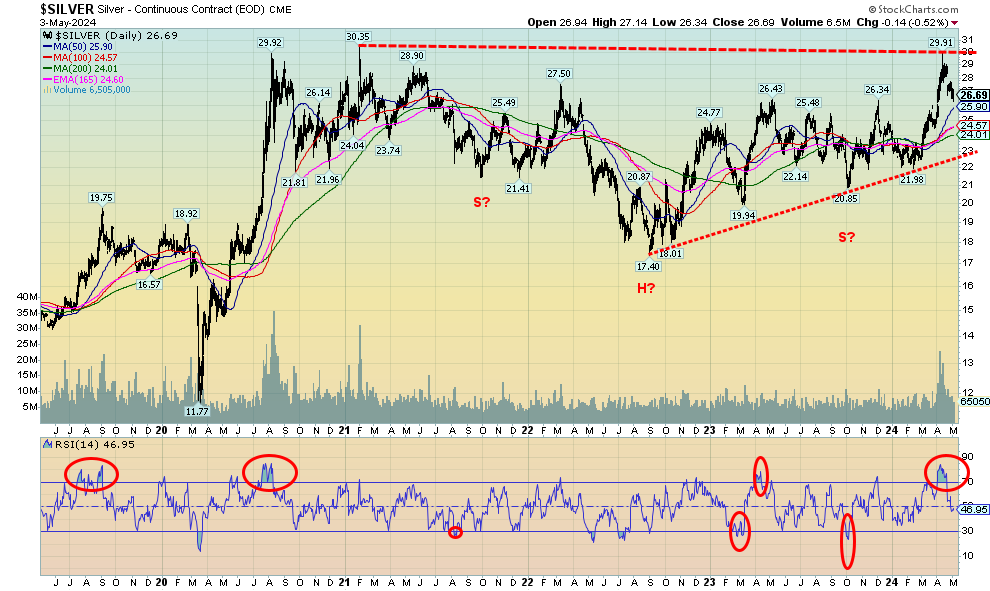
Silver fell this past week, despite as we noted a weaker than expected jobs report and a weaker US$ Index. Silver lost 2.1% as it continued to test $26.50 support. Further support can be seen to $26, but under that level the current rally becomes more questionable. The commercial COT is no help as it is at 26%, well below levels we’d consider bullish. This is despite silver experiencing supply shortages and remaining cheap vis-à-vis gold. We have support as noted to $26 and bigger support down to $24. But under $26 we’d have to question the rally that topped out so far just under $30. By reaching $30 we presumed that eventually we’d take out the February 2021 high of $30.35. So far, no such luck. A head and shoulders bottom also remains compelling. By taking out $26.50, targets were now up to $39/$40. This could just be a test of the breakout level, so in theory the breakout is still in place. Under $26, a problem exists but over $30 our targets should eventually be seen.
Source: www.stockcharts.com
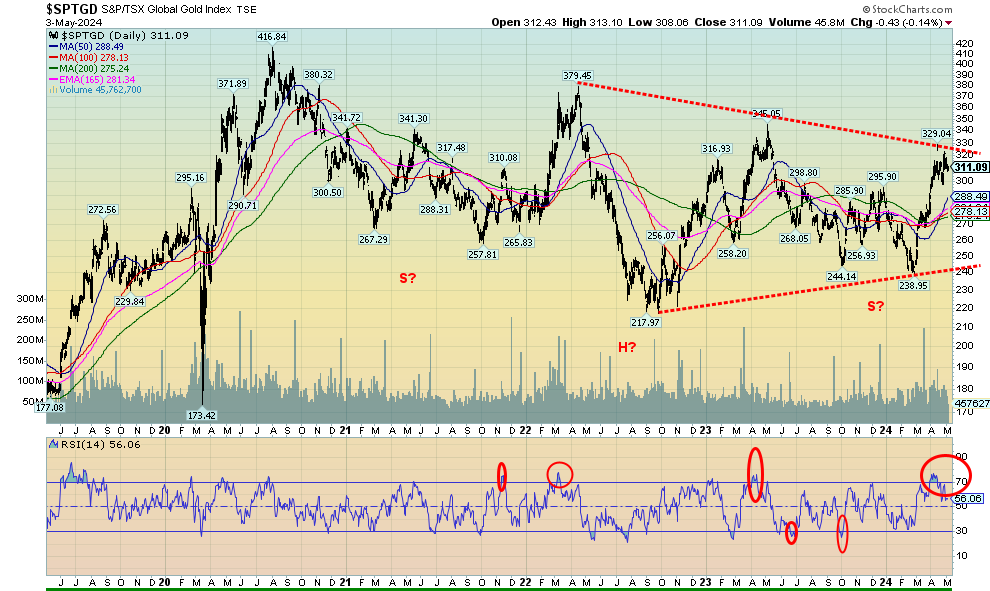
With both gold and silver faltering this past week, it was no surprise to see the gold stocks falter as well. The TSX Gold Index (TGD) fell 3.0% while the Gold Bugs Index (HUI) was off 3.2%. Gold stocks remain incredibly cheap by most measurements and the junior gold exploration plays remain mostly unloved and under-owned. The 330 zone for the TGD continues to be stiff resistance for the index. We have good support down to 278, but under 275 we could test lows near 240. The pattern that has formed over the past two years still appears to be a large head and shoulders. Although we have noted that the right shoulder did go lower than the left shoulder when normally it is the other way around. We can’t say it won’t work yet, at least not until we bust under 240. If that falls, we are going lower to test to the 2022 low of 218. Not what the gold bugs want to hear. The good news is we’ve worked off the overbought levels that were seen earlier. The Gold Miners Bullish Percent Index (BPGDM) remains high at 82.14 which was overbought territory. Are we headed for one of those situations that got everyone excited when we rallied but that’s now going to shake everyone out again, sparking a sell-off? We need to hold above 280 and preferably above 300.
Source: www.stockcharts.com
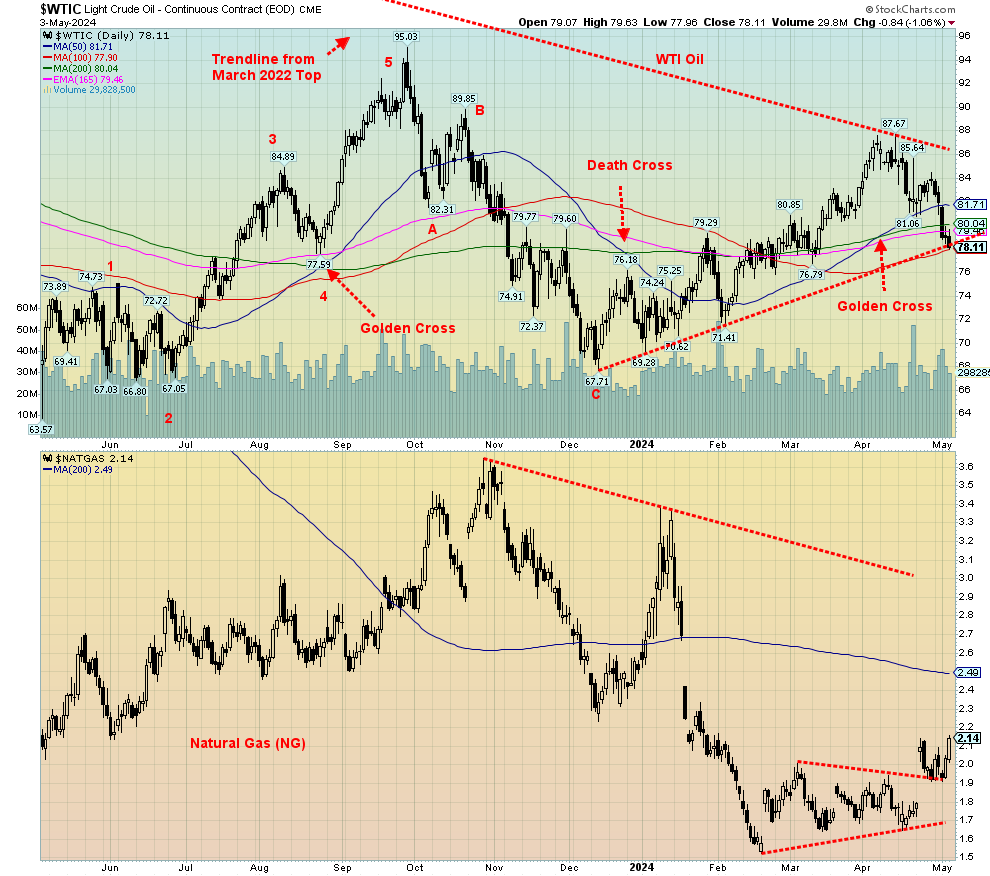
With the economy starting to soften, plus a build-up in inventories that appears to be finished, along with what seems to be a lessening in geopolitical tensions, oil prices fell sharply this past week. Natural gas (NG), on the other hand, jumped this past week as companies cut production back due to previous inventory build-up and lower demand due to warm weather. Despite what many believe is a well-supplied market for NG, prices jumped this past week with NG up 11.5%. NG at the EU Dutch Hub also was up but a much lower 2.4%.
WTI oil was hit hard, falling 6.9% while Brent crude dropped 6.0%. As a result, the energy stocks were not spared and the ARCA Oil & Gas Index (XOI) dropped 4.1% while the TSX Energy Index (TEN) fell 3.0%. Not a good week.
Technically, WTI oil appears to have fallen to an uptrend line from the December 2023 low. That means if WTI were to fall further under $78 and especially under $77, prices are liable to fall more. However, we’d have to fall under $72 to suggest new lows. A stretched normal correction could take us to around $75. That cannot be ruled out. However, any renewal of hostilities, particularly involving Iran, could send oil prices jumping once again. The recent rally failed to get over $90, an important level that suggested higher to $100. At the current $78 we are testing the 100-day MA; under that level and particularly under $77 could send us to test even lower.
NG has once again broken above $,2 but considerable resistance lies above to $2.40. NG wouldn’t truly break out until we get over $3. That energy stock indices did hit record highs despite both oil and NG being well below their all-time highs is a divergence we shouldn’t ignore. The energy stocks appeared to be telling us we should be going higher. Usually at significant tops it is oil making new highs while the stocks lag. All this suggests to us that we may not yet be finished this oil rally.
If there is anything suggesting instead another decline to potentially new lows, it is that the decline from the October high of $95.03 appears to have fallen in five waves. The rebound to $87.67 was a zig-zag pattern suggesting corrective only. Flats are not unusual, so a retest of the December lows can’t be ruled out, despite original signs that we should be going higher instead. Geopolitical tensions remain key to further advances or declines.
Copyright David Chapman 2024
GLOSSARY
Trends
Daily – Short-term trend (For swing traders)
Weekly – Intermediate-term trend (For long-term trend followers)
Monthly – Long-term secular trend (For long-term trend followers)
Up – The trend is up.
Down – The trend is down
Neutral – Indicators are mostly neutral. A trend change might be in the offing.
Weak – The trend is still up or down but it is weakening. It is also a sign that the trend might change.
Topping – Indicators are suggesting that while the trend remains up there are considerable signs that suggest that the market is topping.
Bottoming – Indicators are suggesting that while the trend is down there are considerable signs that suggest that the market is bottoming.
Disclaimer
David Chapman is not a registered advisory service and is not an exempt market dealer (EMD) nor a licensed financial advisor. He does not and cannot give individualised market advice. David Chapman has worked in the financial industry for over 40 years including large financial corporations, banks, and investment dealers. The information in this newsletter is intended only for informational and educational purposes. It should not be construed as an offer, a solicitation of an offer or sale of any security. Every effort is made to provide accurate and complete information. However, we cannot guarantee that there will be no errors. We make no claims, promises or guarantees about the accuracy, completeness, or adequacy of the contents of this commentary and expressly disclaim liability for errors and omissions in the contents of this commentary. David Chapman will always use his best efforts to ensure the accuracy and timeliness of all information. The reader assumes all risk when trading in securities and David Chapman advises consulting a licensed professional financial advisor or portfolio manager such as Enriched Investing Incorporated before proceeding with any trade or idea presented in this newsletter. David Chapman may own shares in companies mentioned in this newsletter. Before making an investment, prospective investors should review each security’s offering documents which summarize the objectives, fees, expenses and associated risks. David Chapman shares his ideas and opinions for informational and educational purposes only and expects the reader to perform due diligence before considering a position in any security. That includes consulting with your own licensed professional financial advisor such as Enriched Investing Incorporated. Performance is not guaranteed, values change frequently, and past performance may not be repeated.


