
"When an asset like real estate becomes overvalued, even if you drop interest rates to zero, you can’t force consumers to borrow more, because they’ve already borrowed too much. Nor can you force lenders to lend, because they’re already puking on ‘bad paper.’ It’s called a liquidity trap."
—Bob Campbell, San Diego Real Estate Timing, from the Campbell Real Estate Timing Letter www.realestatetiming.com, 2008
“…a situation in which conventional monetary policies have become impotent, because nominal interest rates are at or near zero [...]”, a quote that sums up what’s happening with US and generally, monetary policy around the world.”
—Paul Krugman, American economist, Professor of Economics – City University of New York, columnist The New York Times; b. 1953
“There is the possibility…that, after the rate of interest has fallen to a certain level, liquidity-preference may become virtually absolute in the sense that almost everyone prefers cash to holding a debt which yields so low a rate of interest. In this event the monetary authority would have lost effective control over the rate of interest. But whilst this limiting case might become practically important in future, I know of no example of it hitherto.”
—John Maynard Keynes, British economist, director Bank of England, author of The General Theory of Employment, Interest and Money (1936), plus others; 1883–1946
Liquidity Trap. It sounds like something we were taught in macroeconomics in university. Now it is something that is being quietly talked about so as not to alarm anyone. And the best part is no one is really sure if we are in a liquidity trap, but it certainly feels like we could be.
So, first off, what is a liquidity trap? A couple of conditions have to be place. First, interest rates must be very low. Currently the nominal central bank interest rate in the U.S. is zero, and in Canada 0.25%. Second, savings rates must be high. In the U.S. the savings rate shot up to a high of 33.7% in April 2020. It has come back down but has recently started to climb again—currently at 20.5%, the highest level in over 60 years. In Canada the savings rate peaked at 28.2% in July 2020 but has since come down to 12.7%—again, still the highest in 60 years.
With those two conditions in place, monetary policy is, well, kind of useless. People don’t want to buy bonds because the interest rates are so low. So, their money is kept in savings (cash). Or it could be moved into the stock market. For institutions it is the same. They don’t want to buy bonds because they pay so little but many such as pension funds are obligated to buy bonds. Other central banks also buy bonds of other countries to hold as reserves. And the central bank (Federal Reserve, Bank of Canada) also buys the bonds. The Fed is a major buyer at U.S. treasury auctions, thus providing significant support.
Personal Savings Rate, Fed Funds Rate
U.S.
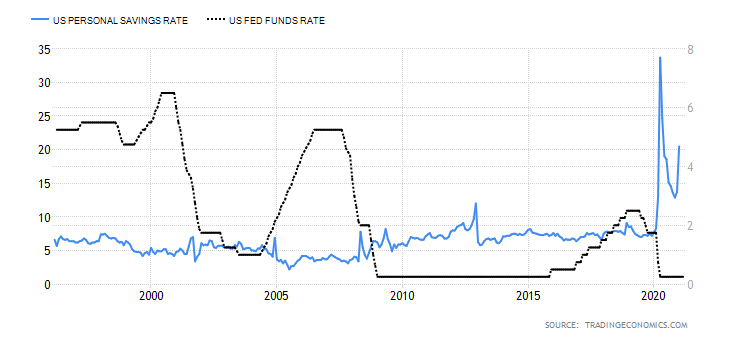
Source: wwwtradingeconomics.com, www.bea.gov, www.federalreserve.gov
Canada
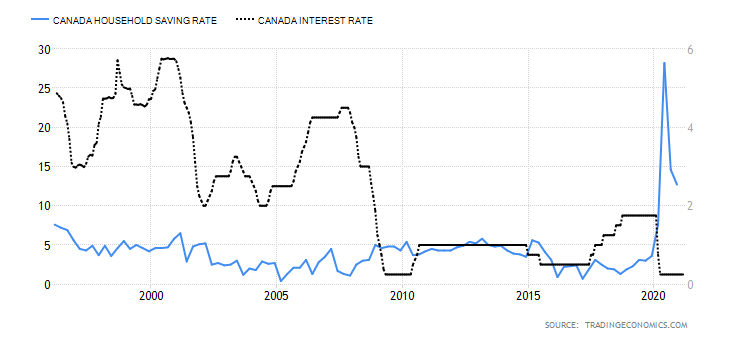
Source: www.tradingeconomics.com, www.statcan.gc.ca, www.bankofcanada.ca
Central banks and governments around the world have been forced by circumstances to go overboard with monetary easing, liquidity injections, and asset purchases (QE). In many countries, particularly in the EU, interest rates are negative. Japan has the longest history of being caught in a liquidity trap. Since the crisis of the 1990s, Japan’s GDP growth rate has been feeble and often negative. For the period 1981-2020 Japan’s average growth rate has been 1.74%. GDP today is roughly the same as it was in back in the early 1990’s. Japan’s official central bank rate is negative 0.1% while its personal savings rate is currently 16.3% with a long-term average of 12.3%. In June 2020 during the pandemic the savings rate hit over 62%.
With few exceptions, the world has been experiencing negative growth for the past year. China, Taiwan, and Egypt are the only ones reported by The Economist to have experienced positive growth in 2020. While expectations are high for 2021 as the pandemic numbers come down and vaccinations occur, high expectations can be shattered if a powerful third wave hits.
GDP and Money Supply (M2)
U.S.
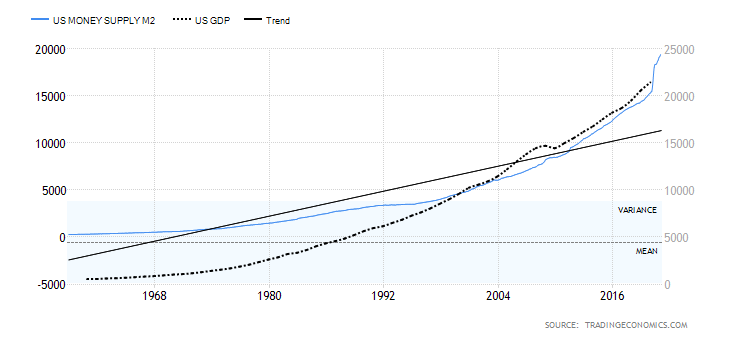
Source: www.tradingeconomics.com, www.federalreserve.gov, www.worldbank.org
Charts continue on the next page
Canada
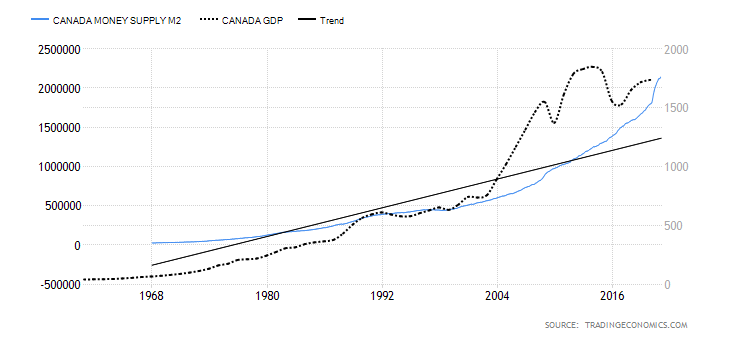
Source: www.tradingeconomics.com, www.statcan.gc.ca, www.worldbank.org
Japan
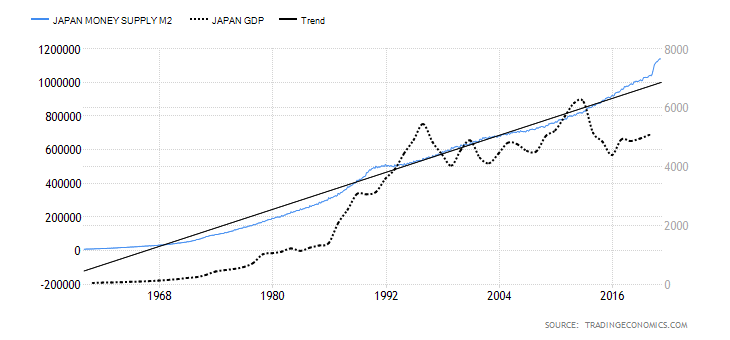
Source: www.tradingeconomics.com, www.boj.or.jp, www.worldbank.org
A similar picture is shown when one looks at GDP and money supply. GDP has stalled, particularly in Japan, as GDP is today no better than it was in the early 1990s. Yet money supply (M2) has exploded. M2 has exploded in both the U.S. and Canada as well, even as GDP has stalled out. What that is signaling is that while more and more money is being thrown at the markets, GDP is not growing or at best growing feebly. What is happening is that it is taking more and more dollars (or yen, etc.) to purchase an additional dollar of GDP.
From 1980 to 2000 it took roughly 80 cents of M2 to purchase $1 of GDP in the U.S. From 2000 to 2010 that number rose to $1.75 of M2 to purchase an additional $1 of GDP. Finally, from 2010–2020 it took an additional $2.75 of M2 to purchase an additional $1 of GDP. If one isolates only 2020, the U.S. economy contracted 2.4% in the 4th quarter over the same quarter a year ago. But money supply (M2) grew $3.8 trillion in 2020. GDP contracted $300 billion. No wonder the Fed is trapped because one has to throw more and more money at the economy to purchase that additional $1 of GDP. We are fast approaching the point of no return where it won’t matter how much one throws at it—the economy will not grow. They are trapped. Japan has been seeing that for years. But that situation is not creating inflation as one would expect. Yet inflation expectations are rising. The inflation rate in Japan has hovered between mildly positive to mildly negative since the early 1990s.
And consumers (which includes corporations) are not spending. We see that in the next chart below where Money Supply (M2) has exploded by almost $4 trillion or 26% since the start of 2020 while the velocity of Money Supply (M2) has fallen almost 20%. The velocity of money measures how fast money turns over in the economy. That shows up in our earlier chart of the sharp rise of personal savings. Worse, people are hoarding cash. With interest rates at the bank so low and even negative in the EU and Japan, it does not pay to leave your cash in the bank and it could cost you. So, they hoard instead.
And this despite the huge increase in money supply in the EU, Japan, U.S., and Canada. Since the pandemic got underway in early 2020, U.S. money supply (M1) which includes cash, chequing accounts, travelers’ cheques, demand accounts, and other chequable accounts has exploded by $12.9 trillion since January 2020. Personal savings alone are up $2.6 trillion. As Martin Armstrong (www.armstrongeconomics.com) calls it, it is the paradox of cash. The use of cash is way down because people use credit cards, debit cards, etc. to pay for goods and services, but on the other hand the hoarding of cash has shot way up.
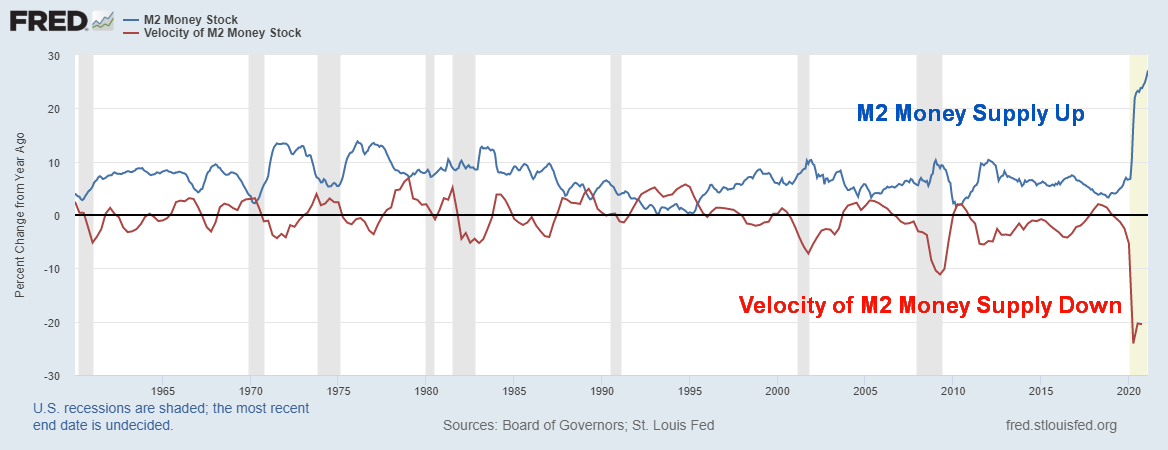
Source: www.stlouisfed.org
Japan has created an even bigger trap for themselves as the BOJ embarked on a program of not only buying bonds but stocks as well. No wonder they have become the zombie economy, chock-full of zombie companies that are barely alive. Under normal circumstances they would fail, but in the fragile economy, failure would translate into possibly millions unemployed and thousands of businesses bankrupt. The same thing is playing out in the EU, U.S., and Japan. The Fed cannot ease up because, if they do, that runs the risk of companies failing which in turn translates into higher unemployment. Governments don’t want that because higher unemployment also potentially leads to social unrest and potentially the rise of populist autocrats claiming they have the solution however simplistic. We saw that in the 1930s with the rise of the dictators and considerable social unrest.
No, the Fed, BOJ, BofC, ECB ‘put’ will be necessary to keep in place. While there is a need to develop an exit strategy, the reality is there is probably no way out. They are trapped. And we haven’t even considered the potential negative effects of climate change.
The Pandemic Rages On!
Is the third wave upon us? Globally the 7-day moving average is now up to almost 545,000 cases daily. That’s up from roughly 361,000 cases daily in mid-February. Deaths are also perking up albeit at a slower pace. In the U.S. things have not picked up much yet with daily cases averaging around 61,000 daily and deaths the average daily toll has slipped to slightly under 1,000. However, in Canada daily cases are up to almost 4,400 daily from around 2,800 daily only a few weeks ago. Deaths are steady at around 30 daily. The big pick up has been in Brazil which is now leading the world in daily cases and deaths. Cases and deaths are picking up in Africa as well with many of them going unrecorded. The EU has also seen a rise in cases particularly of the variants. The result is parts of the economy have been shut down yet again.
Sunday March 28, 2021 – 14:32 GMT
World
Number of cases: 127,455,140
Number of deaths: 2,791,697
U.S.A.
Number of cases: 30,921,244
Number of deaths: 562,045
Canada
Number of cases: 961,083
Number of deaths: 22,852
Source: www.worldometers.info/coronavirus
Chart of the Week
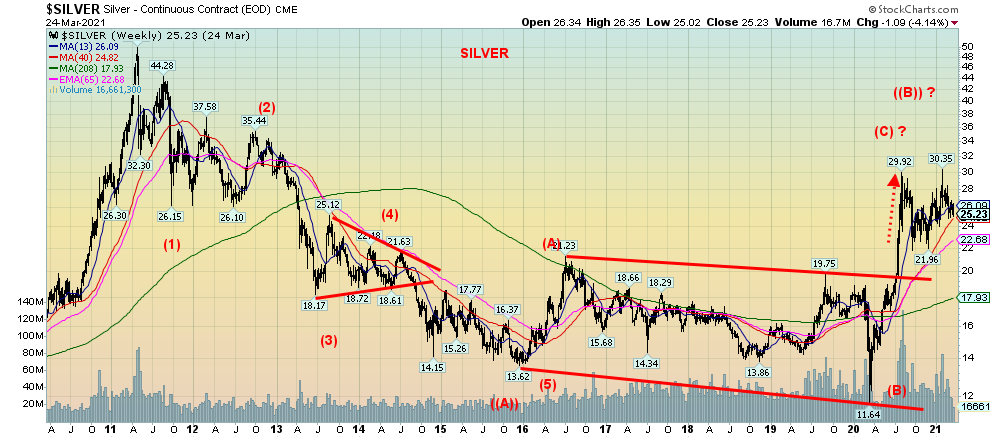
Source: www.stockcharts.com
Elliott Wave Theory is not particularly easy. Some say you need a PhD to be able to apply it properly. We make no pretense to being an expert. One of its major complaints is that you can’t recognize an Elliott Wave until it has already passed. Others include that it’s vague, it’s hard to make trading decisions using it, and it is very uncertain. All of these are true. Irrespective of this, we always find ourselves trying to discern the waves that emerge on charts—any chart. And there are numerous rules that do make sense and do recur. For example, impulse waves in the direction of the trend rise and fall in five waves, and corrective waves against the trend unfold in threes. But that is just the basics. The rest is more complicated.
Elliott Wave Five Waves Patterns
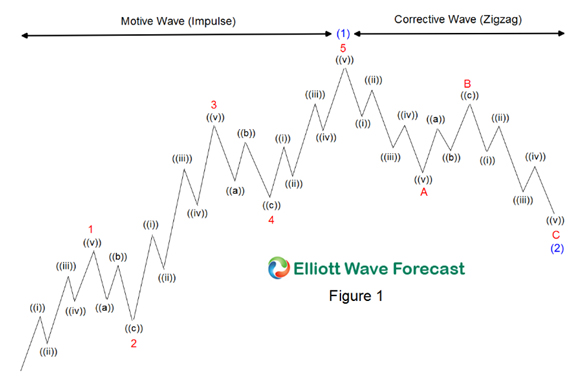
Source: www.elliottwaveforecast.com
So, we look for the waves visually. And there are many variations of these waves: Grand Supercycle lasting multi-centuries; Supercycle lasting upwards of a generation; Cycle – one to several years; Primary – a few months to a couple of months, even a few years; Intermediate – weeks to months; Minor –weeks; Minute – days; Minuette – hours; and Sub-Minuette – minutes. The correct way of course is considerable mathematical relationships that can change. Our weekly chart of silver shows what appears to be a 5-wave decline from the April 2011 top. Those were, we believe, five Intermediate waves down. It took four years for this Primary wave to unfold. It followed an up cycle that lasted 10 years, bottoming in 2001 and topping in 2011. That up wave appeared to have unfolded as five primary waves to the upside which would complete a Cycle.
The five waves down from April 2011 we labelled as our ((A)) Primary wave down. Next comes the Primary ((B)) wave. Intermediate (A) wave up topped in July 2016. Intermediate wave (B) wave, we believe, was quite complex and we labelled it in hindsight as bottoming in March 2020. Naturally, our interpretation could be wrong. So next comes the Primary (C) wave up. We believe Intermediate wave (A) topped in August 2020. Since then, we have been working on Intermediate wave (B). Still to come should be Intermediate wave (C) up. We could, of course, be wrong if we revamped how we view the preceding waves. Some believe that primary wave ((C)) topped in August 2020.
The Intermediate wave (B) is, we believe, unfolding as an ABC made up of three Minor waves.
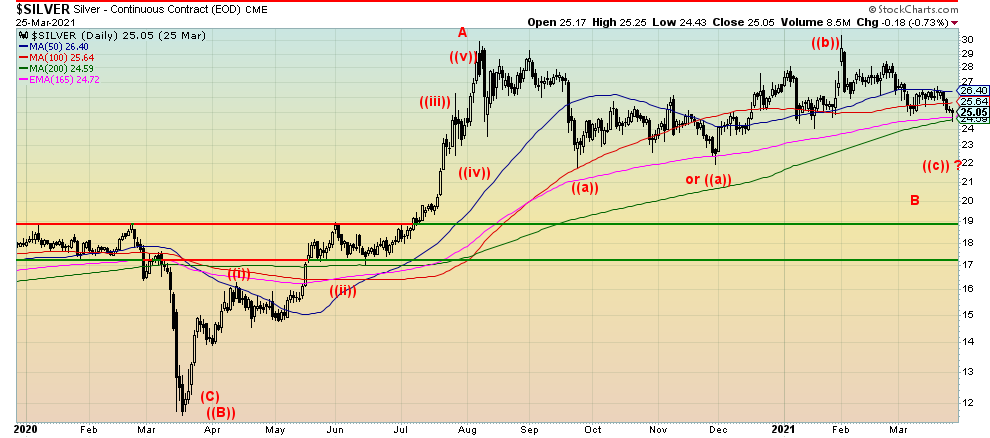
Source: www.stockcharts.com
The question is, how does this final wave unfold? Does it abort as it appears it may have at the 200-day MA near $24.50? Or do we break down to the lows seen in September and November 2020 near $22? Or worse, does it break under $22 and collapse to major long-term support between $18 and $19 to complete wave B down? Regaining above $26.50 would dent the collapse scenario. Regaining above $28 would confirm the low is in and we could be beginning the C wave up. No matter; we continue to believe there is one more major wave to the upside to complete primary wave ((C)). We may only know for sure in hindsight. Such is the nature of Elliott Wave.
MARKETS AND TRENDS
|
|
|
|
% Gains (Losses) Trends
|
|||||
|
|
Close Dec 31/20 |
Close Mar 26/21 |
Week |
YTD |
Daily (Short Term) |
Weekly (Intermediate) |
Monthly (Long Term) |
|
|
Stock Market Indices |
|
|
|
|
|
|
|
|
|
S&P 500 |
3,756.07 |
3,974.54 |
1.6% |
5.8% |
up |
up |
up |
|
|
Dow Jones Industrials |
30,606.48 |
33,078.88 |
1.4% |
8.1% |
up |
up |
up |
|
|
Dow Jones Transports |
12,506.93 |
14,605.79 (new highs) |
3.0% |
16.8% |
up |
up |
up |
|
|
NASDAQ |
12,888.28 |
13,138.72 |
(0.6)% |
1.9% |
down |
up |
up |
|
|
S&P/TSX Composite |
17,433.36 |
18,752.58 |
(0.5)% |
7.8% |
up |
up |
up |
|
|
S&P/TSX Venture (CDNX) |
875.36 |
943.29 |
(5.3)% |
7.8% |
down |
up |
up |
|
|
S&P 600 |
1,118.93 |
1,331.26 |
(1.8)% |
19.0% |
up |
up |
up |
|
|
MSCI World Index |
2,140.71 |
2,222.39 |
(0.6)% |
3.8% |
up (weak) |
up |
up |
|
|
NYSE Bitcoin Index |
28,775.36 |
53,363.50 (new highs) |
(9.6)% |
85.5% |
up |
up |
up |
|
|
|
|
|
|
|
|
|
|
|
|
Gold Mining Stock Indices |
|
|
|
|
|
|
|
|
|
Gold Bugs Index (HUI) |
299.64 |
268.14 |
(4.0)% |
(10.5)% |
down (weak) |
down |
up |
|
|
TSX Gold Index (TGD) |
315.29 |
286.43 |
(2.8)% |
(9.2)% |
down (weak) |
down |
up |
|
|
|
|
|
|
|
|
|
|
|
|
Fixed Income Yields/Spreads |
|
|
|
|
|
|
|
|
|
U.S. 10-Year Treasury Bond yield |
0.91 |
1.68% |
(2.9)% |
84.6% |
|
|
|
|
|
Cdn. 10-Year Bond CGB yield |
0.68 |
1.50% |
(5.7)% |
120.6% |
|
|
|
|
|
Recession Watch Spreads |
|
|
|
|
|
|
|
|
|
U.S. 2-year 10-year Treasury spread |
0.79 |
1.54% |
(2.5)% |
94.9% |
|
|
|
|
|
Cdn 2-year 10-year CGB spread |
0.48 |
1.26% |
(5.3)% |
162.6% |
|
|
|
|
|
|
|
|
|
|
|
|
|
|
|
Currencies |
|
|
|
|
|
|
|
|
|
US$ Index |
89.89 |
92.78 |
0.9% |
3.2% |
up |
neutral |
down |
|
|
Canadian $ |
0.7830 |
0.7940 |
(0.8)% |
1.4% |
up (weak) |
up |
up |
|
|
Euro |
122.39 |
117.97 |
(0.9)% |
(3.6)% |
down |
neutral |
up |
|
|
Swiss Franc |
113.14 |
106.56 |
(1.0)% |
(5.8)% |
down |
down |
up |
|
|
British Pound |
136.72 |
137.92 |
(0.5)% |
0.9% |
down |
up |
up |
|
|
Japanese Yen |
96.87 |
91.20 |
(0.7)% |
(5.6)% |
down |
down |
neutral |
|
|
|
|
|
|
|
|
|
|
|
|
Precious Metals |
|
|
|
|
|
|
|
|
|
Gold |
1,895.10 |
1,732.30 |
(0.5)% |
(8.6)% |
down |
down |
up |
|
|
Silver |
26.41 |
25.11 |
(4.9)% |
(4.6)% |
down (weak) |
neutral |
up |
|
|
Platinum |
1,079.20 |
1,177.90 |
(1.9)% |
9.2% |
down (weak) |
up |
up |
|
|
|
|
|
|
|
|
|
|
|
|
Base Metals |
|
|
|
|
|
|
|
|
|
Palladium |
2,453.80 |
2,672.90 |
1.7% |
8.9% |
up |
up |
up |
|
|
Copper |
3.52 |
4.07 |
(1.0)% |
15.6% |
up (weak) |
up |
up |
|
|
|
|
|
|
|
|
|
|
|
|
Energy |
|
|
|
|
|
|
|
|
|
WTI Oil |
48.52 |
60.97 |
(0.8)% |
25.7% |
neutral |
up |
up |
|
|
Natural Gas |
2.54 |
2.62 |
3.2% |
3.2% |
down |
neutral |
neutral |
|
Source: www.stockcharts.com, David Chapman
Note: For an explanation of the trends, see the glossary at the end of this article.
New highs/lows refer to new 52-week highs/lows and in some cases all-time highs.
Source: www.stockcharts.com
Markets returned to the upside this past week. Well, not all markets and these divergences may be a warning. The S&P 500 gained 1.6%, the Dow Jones Industrials (DJI) was up 1.4%, while the Dow Jones Transportations (DJT), buoyed by vaccinations and an improving economy, made new all-time highs with a gain of 3.0%. The DJT was not the only major index to make new all-time highs this past week as the Dow Jones Composite (DJC) also made new all-time highs. Diverging with the market was the NASDAQ that fell 0.6%. Is the NASDAQ the canary in the coal mine for a correction? The small cap stocks could be another warning as the S&P 600 fell 1.8%. The Russell 2000 small cap index fell 2.6%. In Canada the TSX Composite fell 0.5% but again the small cap TSX Venture Exchange (CDNX) was weak, losing 5.3%. Bitcoin lost 9.6% on the week and it too could be pointing to lower prices ahead.
Overseas, the MSCI World Index fell 0.6%, while in the EU London FTSE gained 0.8% and the German DAX was up 0.9% but the Paris CAC 40 was down 0.2%. In Asia, China’s Shanghai Index (SSEC) was up 0.4% but the Tokyo Nikkei Dow (TKN) was down 2.1%.
Indicators remain positive for the market, although the NYSE McLellan Summation Index (RASI) has fallen to 500. That indicates some weakness so it could too also be a warning. The CBOE put/call ratio at 0.58 is slightly higher but still in bull territory. Still, the recent rise from record lows near 0.40 could be a sign that the bull market is waning. The VIX is not showing any divergences. But some high-profile stocks have shown considerable weakness. Tesla, an early star, has now fallen 30% from its January high and we note that ViacomCBS has collapsed 61% since March 15. Discovery is down 56% from a top on March 19. However, GameStop, the darling of the Robinhood traders, is still up 345% from a recent low in mid-February but down 48% from the insane high in late January at the height of the frenzy. The question remains, are the markets in a bubble or merely very frothy?
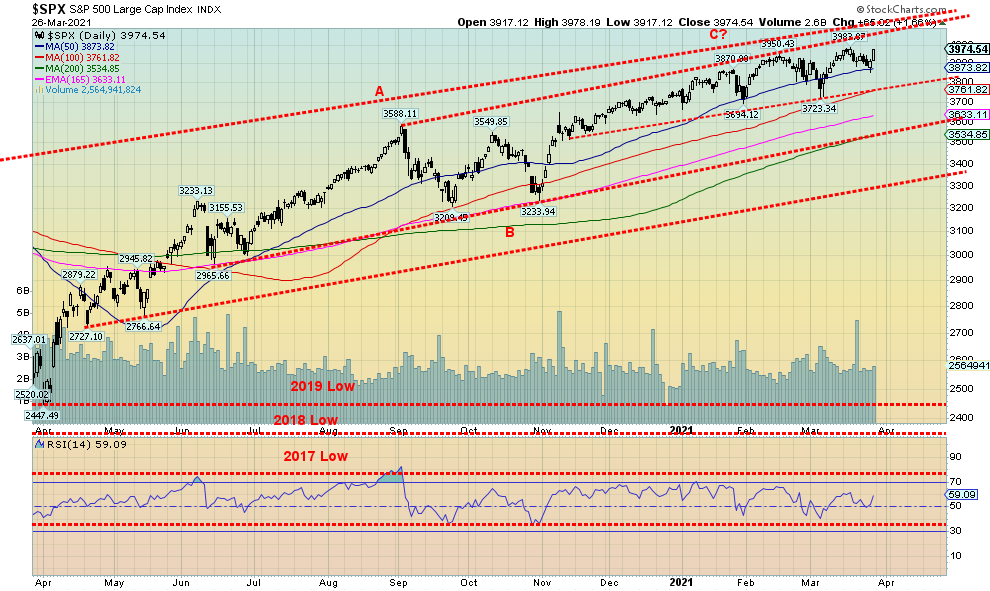
Overall, the markets remain strong. There is a reasonable chance we will see new highs again soon--possibly even next week and the end of the first quarter. If we continue to make new highs in April, any significant correction may not occur until into May. We have seen highs into late March and a fall into April/May in the past. The most notable was the top in March 2000 followed by a swift collapse into April/May 2000 as the dot.com bubble burst.
Right now, the S&P 500 has support down to around 3,800 and as long as we hold above that level then the market should continue to try and march higher. A break of 3,800 would, however, spell trouble as then we would be able to see the 200-day MA down near 3,500. Our major panic breakdown zone keeps rising and is now around 3,400. Overall, we are not seeing a lot that tells us this market is potentially over. And even if we do pull back, it most likely will just be a correction not a major sell-off—unless there was an unexpected event. Even talk from Fed Chair Jerome Powell musing about tapers didn’t really shake the market this past week. But the fact the NASDAQ, the former leader, is now the laggard continues to be a possible warning sign.
Source: www.stockcharts.com
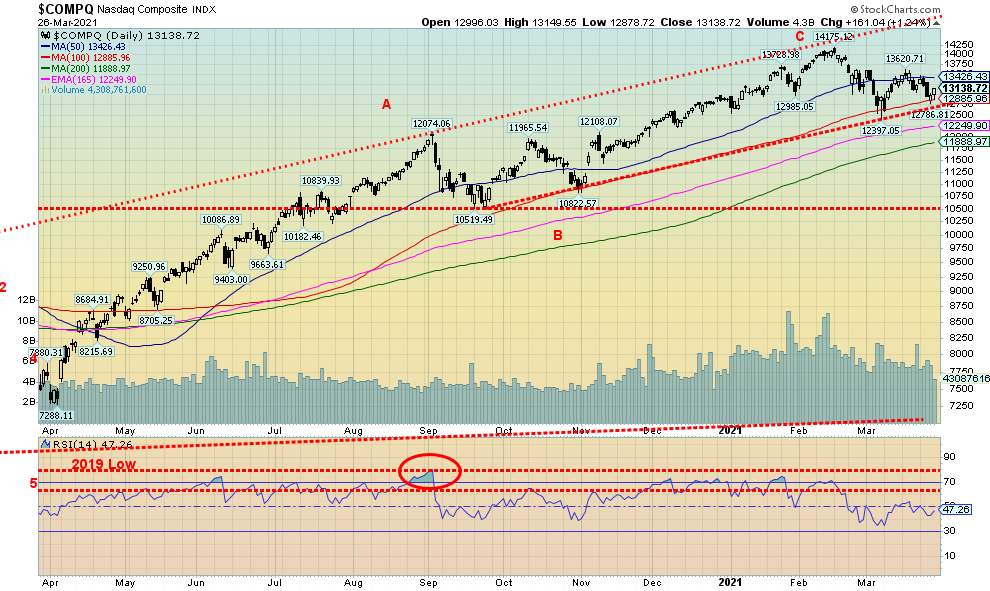
The NASDAQ continues to be out of step with the rest of the market. The NASDAQ fell 0.6% this past week, even as the DJI, DJT, and S&P 500 were up on the week. The NASDAQ biggies saw Facebook fall 2.4%, Amazon down 0.8%, Netflix also off 0.8%, Google drop 0.4%, Tesla fall again, down 5.5% and Twitter drop 7.5%. Apple up 1.0% and Microsoft up 2.7% bucked the trend. The NASDAQ is now down 7.3% from its recent all-time high. After peaking at 82% in February, the number of NASDAQ stocks trading over its 200-day MA has slipped to 66%. Below 50% would indicate that the NASDAQ was in a bear market. The NASDAQ Composite Bullish Percent Index has fallen to 54.5% down from 80% in February. Again, readings below 50% would indicate that the NASDAQ was in a bear market. The NASDAQ’s ongoing divergence with the other indices is a potential sign of trouble going forward with the markets. One wants to see them in sync and when one is out of sync with the others it is often a warning (or, in a bear market, a hint that it may be coming to an end).
Source: www.stockcharts.com
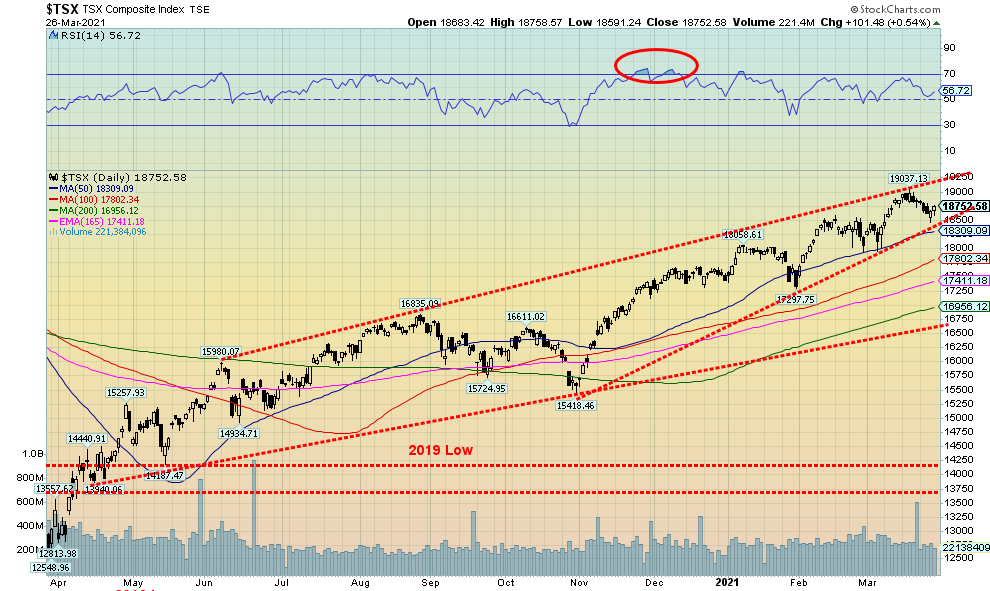
The TSX Composite did not go against the general weakness in many markets this past week as it fell 0.5%. The TSX was dragged down by nine of its fourteen sub-indices falling. The leader was Health Care (THC), down 6.9%. However, Health Care is not a huge component. Bigger drags were seen because of Materials (TMT), down 3.1%, Information Technology (TKK), down 2.2%, and Golds (TGD) down 2.8%. Leading the winners were Utilities (TUT), up 2.5% and Income Trusts (TCM), up 1.8%. The two biggest TSX components saw Energy (TEN) fall 0.5% while Financials (TFS) was up 0.3%. The TSX appears to be continuing its rise in an ascending wedge (bearish). The breakdown point comes in at around 18,500 with confirmation coming on a breakdown under 18,300 and especially under 17,800. Major long-term support is seen down at 16,750. The wedge triangle has resistance up to around 19,250. If we are truly in a wedge triangle, then we could see the TSX top in April sometime and then break down into May. The long-term picture is good as long as the TSX holds above 16,750, although since that is rising, we note the 200-day MA is currently just below 17,000.
U.S. 10-year Treasury Bond/Canadian 10-year Government Bond (CGB)
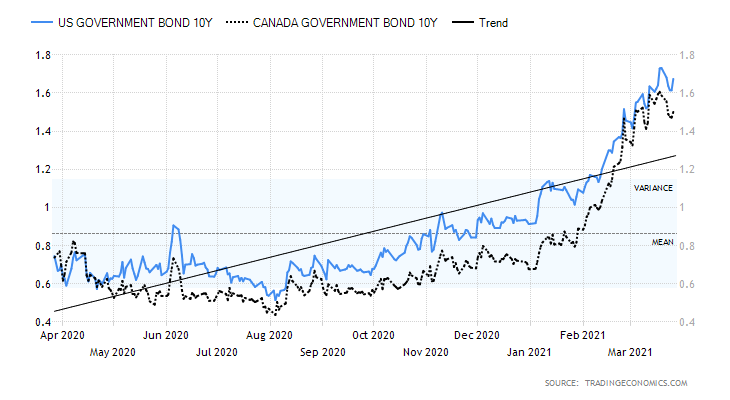
Source: www.tradingeconomics.com, www.home.treasury.gov, www.bankofcanada.ca
Longer dated interest rates eased this past week; however, they did not ease sufficiently to break the uptrend that has been in place since early August. Coincidently, the low for the U.S. 10-year treasury note occurred around the same time that gold topped. That shows some proof of the correlation that exists between gold and longer dated interest rates. This past week the U.S. 10-year treasury note slipped 5 bp or 2.9%. The Canadian 10-year Government of Canada bond (CGB) was off 9 bp or 5.7%. Spreads fell as well with the U.S. 2–10 spread down 4 bp to 1.54% and the Canadian 2–10 spread off 7 bp or 5.3%. The U.S. 30-year treasury bond slipped to 2.37% down from a recent high of 2.45%.
Signs of continued improvement in the U.S. economy continue to keep upward pressure on long-dated interest rates despite the small drop experienced this past week. Highlighting the improvement Q4 GDP was reported to be better than expected at 4.3% vs. the earlier reported 4.1%. Year over year, U.S. GDP was down 2.4%. Other positive numbers saw initial weekly unemployment claims fall to 684,000 down from 781,000 the previous week. It was the lowest initial weekly claims since the pandemic got underway a year ago. Continuing jobless claims also slipped to 3,870 thousand down from 4,134 thousand the previous week. The Michigan consumer sentiment index was at 84.9 vs. 76.8 in February, reflecting improving sentiment by consumers as people get vaccinated. However, personal income in February fell 7.1% which was actually within expectations. Personal spending fell 1.0% which was above expectations of a decline of 0.7%. The U.S. manufacturing PMI composite was at 59.1, only slightly below the expected 59.9. Durable goods orders for February, however, slipped 1.1% when the market had expected a gain of 1.1%. New home sales also were down in February off 18.2%, well below the expected 5% decline. Existing home sales fell 6.6% in February, well below the expected decline of 1.5%. Could high prices finally be becoming a deterrent? The Q4 current account deficit was $188.5 billion which was about as expected. Still, it has been rising and certainly not the intended direction when former president Trump started his trade wars with China.
There is little say here about the interest rates except the uptrend remains intact and we would not be surprised to see the 10-year hit 2%. There is considerable support for the 10-year down to 1.35% and also way down to 0.9%. That level now seems distant.
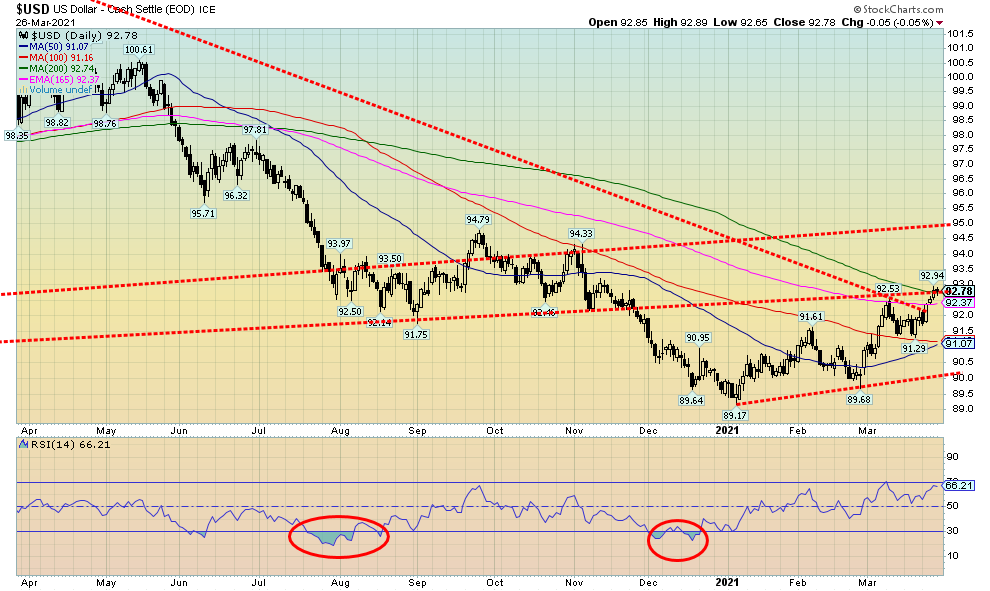
Source: www.stockcharts.com
The rise of the U.S. dollar continues. This past week the US$ Index rose 0.9%. Everybody else fell. The euro was down 0.9%, the Swiss franc continued its recent woes, down about 1.0%, the pound sterling was off 0.5%, while the Japanese yen gapped lower (see next chart), losing 0.7%. The Canadian dollar joined down 0.8%. The U.S. dollar has been strong for a number of reasons: relative to the other major global economies, the U.S. economy is doing better; interest rates in the long end have been rising, attracting funds; and America’s place in the world has risen following the election of Joe Biden in November. The result is that funds flow out of the EU, Japan, China, etc. to buy U.S. dollars and place it in U.S. notes and bonds or the U.S. stock market. A rising US$ Index helps push gold lower. The U.S. dollar does appear that it could move even higher, particularly if it can build value above 93. Targets could then become 94.30 and even up to 95 where it should encounter major resistance. A rising U.S. dollar has negative implications for gold. The US$ Index is currently at 200-day MA resistance so failure here and a return back under 91 would suggest a return to the downside. At an RSI of 66 it still has room to move higher before becoming more overbought. The US$ Index recently broke the downtrend from the March 2020 high so that was another positive development. While the other currencies are approaching oversold except for the Japanese yen, the others appear to have room to move lower. 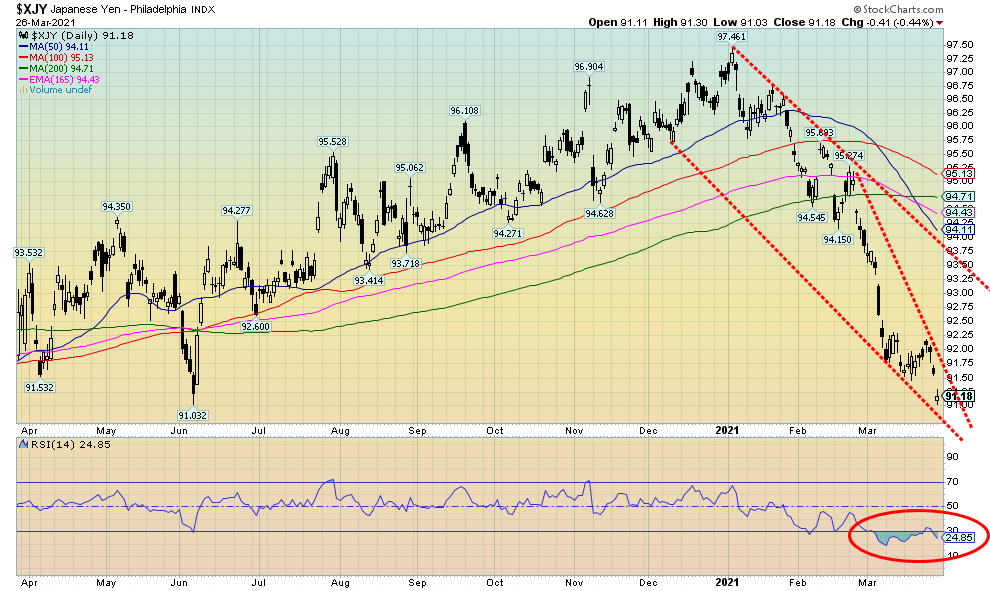
Source: www.stockcharts.com
The Japanese yen has suffered quite a downdraft over the past few months since topping at 97.46 in January. Since then, it has fallen 6.4%. The past few weeks have seen the yen fall precipitously. On Friday the yen gapped down sharply. That caught our attention. What that might be is what we call an exhaustion gap. Exhaustion gaps appear at the end of market moves. Call it a last gasp. These types of gaps can occur in uptrends as well as downtrends. What we now look for is an island reversal. Meaning we end this exhaustion gap with another gap only this time to the upside, leaving potentially a day or few days trading isolated below (the island). Naturally, we won’t know this until we do gap higher. We note that on two occasions as the yen was falling it also left gaps. These are what is known as measuring or runaway gaps. That is another reason this gap is not likely to be another measuring gap but instead the exhaustion gap. The RSI has been regularly under 30 and even lower for most of March. By any measurement the yen is due, even overdue, for a rebound. And, given the length of the decline, the rebound could be just as sharp. We mention all of this as the yen does have a close correlation to gold prices. So, a falling yen usually sees gold falling as well while a rising yen is good for gold. Both gold and the yen topped together in early January. Could both be making lows together as well? Gold is actually above its recent low so the two are diverging in favour of gold. Another potentially positive sign.
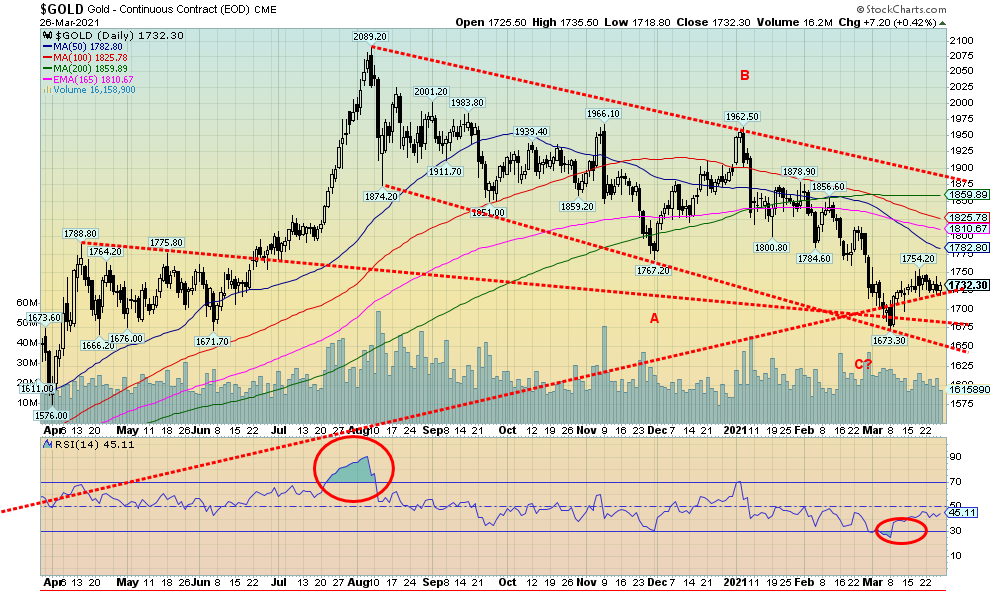
Source: www.stockcharts.com
Gold generally held together this past week, losing only 0.5%. Gold appears to be crawling up an old support line. While silver was losing 4.6% on the week falling to new lows for the current move down, gold didn’t take the bait and held above $1,700 support. Platinum was off 1.9% on the week. Palladium gained 1.7% on the week while copper lost about 1.0%. Gold held tight despite comments from Fed Chair Jerome Powell that they might consider cutting back on their bond purchases if the U.S. economy continues to improve. The market calls that a taper. However, Powell also reiterated that interest rates and monetary policy should remain in place for the foreseeable future and any taper will be targeted and be gradual. As well, the U.S. dollar continued its recent rise, which did not help gold prices. Long interest rates did ease somewhat this past week but were rising slightly again by Friday. Gold might have been encouraged by rising COVID-19 numbers as the variants take hold. As well, ever-present geopolitical risks help gold. Geopolitical risks rose with Chinese warplanes flying over Taiwan. The daily average of COVID-19 cases is now back over 600,000 as spikes are being seen in the EU and particularly in Brazil.
Gold has now developed resistance at around $1,750/$1,760, which is the first hurdle it must overcome. There appears to be support down to $1,700 but below $1,700 gold could test the recent low at $1,673. A breakdown under $1,670 could spark a mini-collapse to $1,575/$1,600. Above $1,760 the next key resistance ranges from $1,780 to $1,825. Above $1,825 gold looks brighter and could rise to $1,860 or higher. Gold breaks the downtrend from the August 2020 high above $1,875. New highs become possible above $1,960. The result is that gold has a bit of work to do to confirm the bull’s expectations. In the interim, gold appears caught in a bit of range trading for the moment. We remain bullish going forward looking for potential new highs later in the year; however, we remain cautious in the short-term until gold firmly breaks above $1,825 so that we can confirm that low at $1,673.
Source: www.cotpricecharts.com
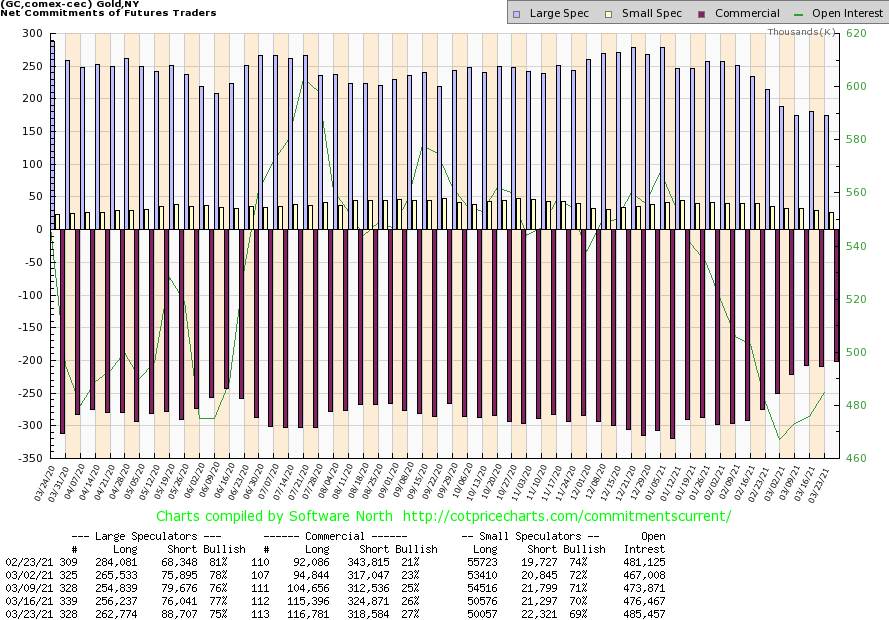
Another encouraging COT report. The commercial COT (bullion companies and banks) rose to 27% this past week from 26%. Long open interest was up over 1,000 contracts while short open interest contracted by over 6,000 contracts. The large speculators COT (hedge funds, managed futures, etc.) fell to 75% from 77% as they added over 12,500 contracts to short open interest but also added over 6,000 contracts to long open interest. All that action from the large speculators helped to increase open interest on the week by about 9,000 contracts. A rise on a week that gold fell is a bit negative, but overall, given the improvement in the commercial COT, we are encouraged. We’d dearly love to see the commercial COT recover back over 30%. Still, we are up from 21% in just the past five weeks.
Source: www.stockcharts.com
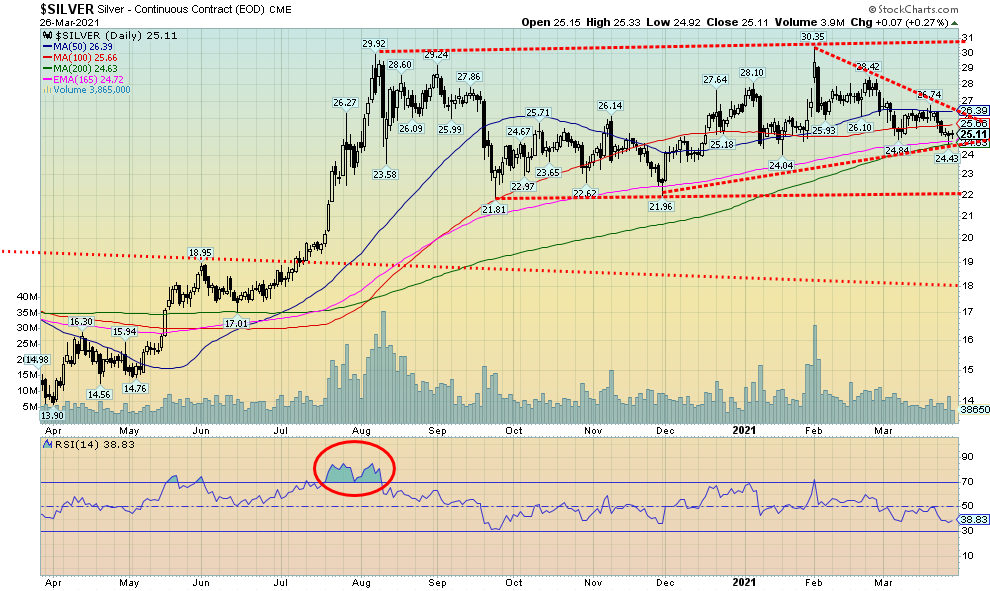
We discussed silver more extensively under our Chart of the Week. The keys here are that silver attempted to break down under a $25 support zone but, overall, it failed. The 200-day MA currently $24.63 held (low was $24.43) and silver clawed back and closed back over $25. Encouraging but not a reason for major celebration as silver still has a lot of work to do. New lows below $24.43 could set up a washout move down to $22. And under $22 silver could fall towards $18–$19. Some, including ourselves, had noted a possible head and shoulders pattern forming although we were and remain a bit skeptical as the right shoulder is higher than the left shoulder. In a classic H&S pattern the left shoulder is the higher of the two shoulders. That pattern broke under $25 and did project down to around $18.70. However, when silver broke under $25 no major selling developed. For the moment, we’ll take that as a win. It could be what we call a failed breakdown or false breakdown. They do occur from time to time and in this case, it suggests that silver’s next move should be up. Key, of course, is that on any further pullbacks the low holds. Silver breaks out above $26.40, but its major breakout zone is not until it is above $28.50 initially then above $31. Until then the minor trend remains down.
We should note that premiums for silver coins remain quite high. A check at SilverGoldBull www.silvergoldbull.ca showed that premiums to spot on 1 oz Maple Leafs was 31%, 1 oz U.S. Eagles 36%, and 1 oz South African Krugerands 27%. A 1 oz Royal Mint Lion Silver Bar carried a premium of 48.5%. However, you could buy a 100 oz Canadian Mint bar for a premium of only 22.5%. But that’s 100 ounces so one has to fork over, over Cdn$3,800. The Mexican central bank has suspended production of silver Libertards. Result, a check at SilverGoldBull revealed that none are available.
Source: www.cotpricecharts.com
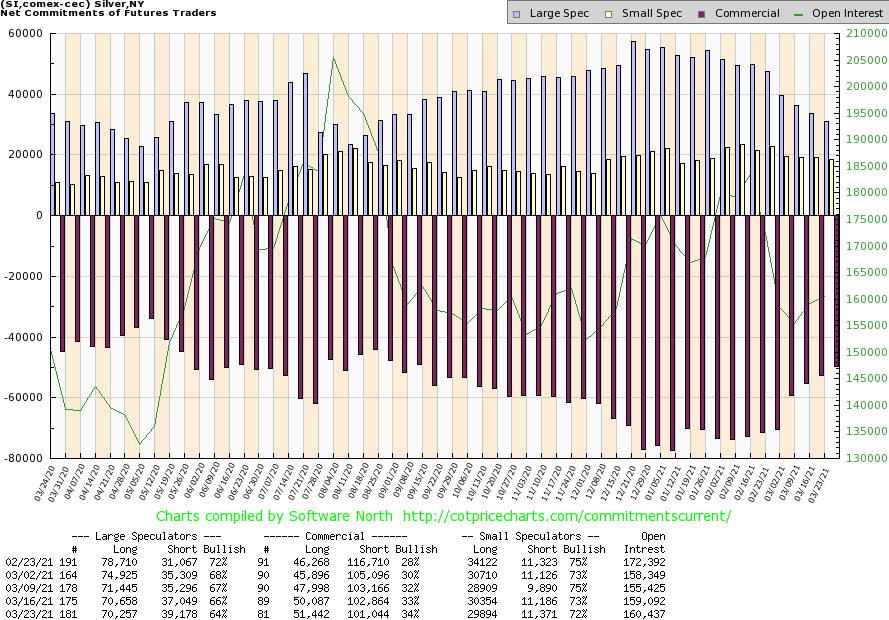
More encouragement from the silver commercial COT that rose to 34% this past week, up from 33%. Long open interest rose over 1,000 contracts while short open interest fell almost 2,000 contracts. The large speculators COT fell to 64% from 66% as they added roughly 2,000 contracts to their short open interest while long open interest only fell about 600 contracts. Overall, open interest rose marginally on a week that silver fell 4.6%. Still, we view the improvement in the commercial COT as positive. Ideally, we’d like to see this over 40%.
Source: www.stockcharts.com
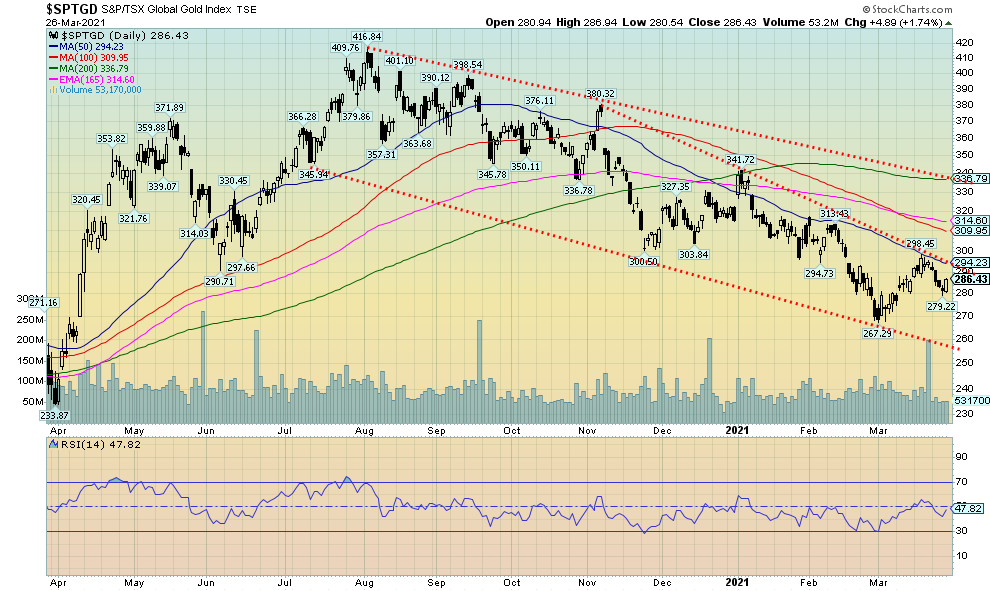
Could the gold stocks be leading? On the surface, that doesn’t appear to be the case. After all, the TSX Gold Index (TGD) fell 2.8% this past week and the Gold Bugs Index (HUI) fared even worse, down 4.0%. Even the junior miners that trade on the TSX Venture Exchange (CDNX) struggled. The CDNX fell 5.3% this past week. We were encouraged by the action on Friday that saw the TGD gain 1.7% and the HUI up 2.1%. Even the CDNX bounced back on Friday, up 0.7%. However, none of the positive action on Friday could save the week. The Thursday action on the TGD may have terminated the small downtrend, given it left a nice Japanese candlestick on the charts closing near its opening and high after spiking lower earlier in the day. The 50-day MA proved to be a barrier for the TGD on the first runup. So that emphasizes the 294/295 area as resistance with further resistance seen at 300. Once over 300, however, the TGD could rise 310/315. Over 320 a run up to 335/340 is probable. The TGD breaks the major downtrend from the August high above 340. Support is now 280 but longer-term support is down to 260. While we have not labeled the TGD, it appears to have fallen in an ABC-type pattern with the A wave down at 357 in August, the B wave up top in September at 398, and then the C wave falling in five waves to bottom in February/March at 267. A possible wedge triangle formed and the TGD breaks out above 295. We were encouraged by the action of the TGD this past week and view it as a pullback within the context of a possible new uptrend developing. Key, of course, is that all support zones hold on any pullback.
Source: www.stockcharts.com
It’s being billed as the world’s biggest (and most expensive) traffic jam. Yes, the super container ship Ever Given is stuck in the Suez Canal. The Suez carries only 30% of the globe’s container traffic every day, represents 12% of global trade, 4.6 million barrels of oil go through there every day and some 52 ships pass through the canal on average daily. The Suez Canal is one of the globe’s major chokepoints, along with the Straits of Hormuz, the Straits of Malacca, the Bab-el-Mandeb, and the Bosphorus.
And the Ever Given is not just any ordinary container ship. It is nearly as long as the Empire State Building is tall. The Ever Given is a 220,000-tonne mega-ship nearly a quarter of mile long that can carry upwards of 20,000 containers. The Suez is only about half the length of the Ever Given at its widest point. It is estimated that the ship is blocking upwards of $9 billion of goods daily with upwards of 200 ships stuck at either end. It is costing the global economy upwards of $10 billion a week. Oh, one can go around the Cape of Good Hope (South Africa), but it adds roughly $800,000 to costs and two weeks’ extra travel time. The Suez is a major route from Europe to Asia and even from Asia to the eastern coast of North America. So, while it would seen not to impact North and South America, they too will feel a delayed sting due to supply disruptions, depending on how long this lasts. The optimists say the Ever Given could be dislodged within a few days while the realists (?) or pessimists say weeks. One has to dig away a lot of sand and lighten the ship of containers and fuel. Surprisingly, while the northern section of the canal has two parallel channels, the southern portion where the Ever Given is stuck has only one channel. The second channel was only built in 2015 although the Suez itself opened in 1869.
Incidently, the Ever Given is listed as a Taiwanese-owned ship (Evergreen Marine) but flies under the flag of Panama. The ship was destined for the Netherlands. Everyone is praying for high tide.

Source: Randomly Found on Facebook, however, it may have originated at www.cnn.com.
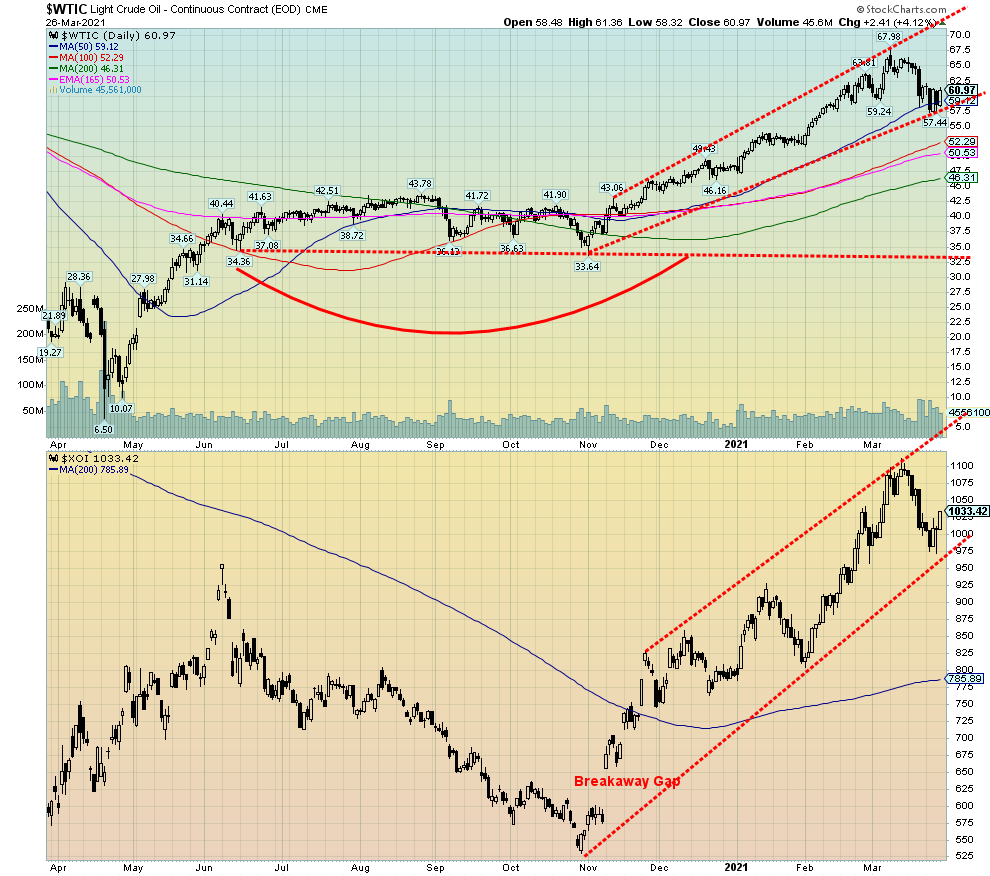
So, what has all this got to do with oil? Oil prices had been falling in the past week. But then following the blocking of the Suez oil prices became volatile. The past four days have seen wild moves down, up, down, up. Friday was up 4.1%. On the week, however, WTI oil fell 0.8%. Natural gas (NG) was up 3.2%. Technically, WTI oil appears to be trying to find support around the 50-day MA. Friday’s close kept oil just above that key support zone. If the blockage continues, WTI oil prices should continue to rise this coming week. As noted, the Suez carries roughly 4.6 million barrels of oil per day, about 5% of the world’s daily consumption.
The energy stocks may be anticipating that as the as both indices bounced back this past week, with the ARCA Oil & Gas Index (XOI) rising 1.6% although the TSX Energy Index (TEN) fell just short closing the week down 0.5%.
Prices are rising at the pump for consumers as the loss of 4.6 million barrels per day does have an impact even in North America. Daily consumption that had fallen to roughly 91 million barrels per day in 2020 is expected to rise to 96 million barrels per day in 2021 as the world gets vaccinated and people begin to travel again.
We had viewed this pullback in WTI oil as a correction following a steep rise. The bull channels appear to be intact and WTI oil could be forming a funnel pattern. A funnel pattern is similar to a bull channel only the channel widens as the price moves higher. Like a regular bull channel, the bull move is over when it breaks the established uptrend. But the ranges can continue to widen, hence the creation of a funnel channel. The current top of the channel is just past $70. So WTI oil could rebound back towards that level in the coming week as long as the Ever Given remains stuck in the Suez. Oil would probably sell off if they free the ship so normal traffic can resume. Otherwise, in the interim, enjoy the trip around the Cape of Good Hope.
An oddity we learned this past week was that the U.S. imported more oil from Russia in 2020 (538 thousand barrels/day vs. 522 thousand barrels/day from Saudi Arabia). Oil cutbacks by Saudi Arabia, refinery problems, and lack of oil from Venezuela due to sanctions sent the U.S. scrambling. Tough talk against Russia? Doesn’t seem to be a problem when it comes to getting oil.
Copyright David Chapman, 2021
|
Charts and commentary by David Chapman Chief Strategist, Enriched Investing Inc. Phone: 416-523-5454 Email: david@davidchapman.com dchapman@enrichedinvesting.com Twitter: @Davcha12 March 29, 2021 |
|
GLOSSARY Trends Daily – Short-term trend (For swing traders) Weekly – Intermediate-term trend (For long-term trend followers) Monthly – Long-term secular trend (For long-term trend followers) Up – The trend is up. Down – The trend is down Neutral – Indicators are mostly neutral. A trend change might be in the offing. Weak – The trend is still up or down but it is weakening. It is also a sign that the trend might change. Topping – Indicators are suggesting that while the trend remains up there are considerable signs that suggest that the market is topping. Bottoming – Indicators are suggesting that while the trend is down there are considerable signs that suggest that the market is bottoming. |
Disclaimer
David Chapman is not a registered advisory service and is not an exempt market dealer (EMD) nor a licensed financial advisor. We do not and cannot give individualised market advice. David Chapman has worked in the financial industry for over 40 years including large financial corporations, banks, and investment dealers. The information in this newsletter is intended only for informational and educational purposes. It should not be considered a solicitation of an offer or sale of any security. Every effort is made to provide accurate and complete information. However, we cannot guarantee that there will be no errors. We make no claims, promises or guarantees about the accuracy, completeness, or adequacy of the contents of this commentary and expressly disclaim liability for errors and omissions in the contents of this commentary. David Chapman will always use his best efforts to ensure the accuracy and timeliness of all information. The reader assumes all risk when trading in securities and David Chapman advises consulting a licensed professional financial advisor before proceeding with any trade or idea presented in this newsletter. David Chapman may own shares in companies mentioned in this newsletter. We share our ideas and opinions for informational and educational purposes only and expect the reader to perform due diligence before considering a position in any security. That includes consulting with your own licensed professional financial advisor.
About the author


Website: https://www.enrichedinvesting.com
Disclaimer: David Chapman is not a registered advisory service and is not an exempt market dealer (EMD) nor a licensed financial advisor. We do not and cannot give individualised market advice. David Chapman has worked in the financial industry for over 40 years including large financial corporations, banks, and investment dealers. The information in this newsletter is intended only for informational and educational purposes. It should not be considered a solicitation of an offer or sale of any security. The reader assumes all risk when trading in securities and David Chapman advises consulting a licensed professional financial advisor before proceeding with any trade or idea presented in this newsletter. David Chapman may own shares in companies mentioned in this newsletter. We share our ideas and opinions for informational and educational purposes only and expect the reader to perform due diligence before considering a position in any security. That includes consulting with your own licensed professional financial advisor.