
The Fed surprised. While there were many thinking a 50 bp cut was in the offing the majority still favoured a 25 bp cut. 50 bp won. The market was volatile both up and down. Gold leaped. Bond yields backed up and the formerly inverted yield curve is now positive again. Every time that has happened after a long period of inversion a recession gets underway. We muse about why the Fed cut 50 bp as opposed to 25 bp. Do they know something we don't know?
Canada's inflation rate fell to 2%, the lowest in 3 years. The CPI is below yields on T-bills and bonds giving everyone a positive spread to inflation following years of a negative spread. It is the subject of our chart of the week (page 8).
Everyone was up this past week. Enghouse Systems Limited, for example, that provides mission critical vertically focused enterprise software solutions and pays a dividend, recently reported increased revenue, income, and cashflow, and is held in the Enriched Capital Conservative Growth Strategy.* Well, almost everyone. Stocks, gold and silver, oil all rose while bonds and the US$ Index fell. Gold once again hit new all-time highs and the US$ Index made 52-week lows. Gold - driven by fear of expanding wars, growing violence in the U.S. as the election approaches, central banks buying, are the main drivers. Gold is a safe haven.
We have a full report this week.
Have a great week!
DC
* Reference to the Enriched Capital Conservative Growth Strategy and its investments, celebrating a 6-year history of strong growth, is added by Margaret Samuel, President, CEO and Portfolio Manager of Enriched Investing Incorporated, who can be reached at 416-203-3028 or msamuel@enrichedinvesting.com
“A good trader has to have three things: a chronic inability to accept things at face value, to feel continuously unsettled, and to have humility.”
—Michael Steinhardt, American billionaire and hedge fund manager, fund Steinhardt Partners 1967–1995, head Wisdom Tree Investments 2004–, philanthropist, antiquities collector; b. 1940
“It’s not that I’m so smart; it’s just that I stay with problems longer.”
—Albert Einstein, German-born physicist, influential on scientists, best known for Theory of Relativity 1905 and 1915, author of famous energy equivalence formula E=MC²; 1879–1955
“The years teach what the days never know.”
—Ralph Waldo Emerson, American essayist, lecturer, philosopher, abolitionist, poet, leader of the Transcendentalist movement of the mid-nineteenth century, highly influential on many; 1803–1882
What’s going on? The Federal Reserve did the unexpected and cut its key rate by 50 bp. 25 bp had been built in, but we admit there were a significant number who thought the Fed might cut by 50 bp. Before the meeting, 47% thought a 50 bp cut was in the offing and 53% picked a 25 bp cut. The 50 bp won.
That’s great for borrowers, but not so great for lenders as most rates adjust lower. Well, not all rates. Short rates fell but long rates rose. While many would think that is strange, it actually makes sense. Why? It signals that the Fed is willing to help ease things to help the economy and borrowers. In its aftermath speech, the Fed emphasized the economy still remains robust and they are less likely to loosen monetary policy further. Maybe it was fate, but the next day the weekly jobless claims actually fell to their lowest level in four months. The jobs market is alive and mostly well. Well, mostly alive and well as employment has a history of staying at a relatively good level until it doesn’t. But employment is a late cycle indicator. Economist David Rosenberg notes that in his latest article in The Globe: “No, I’m not backing away from my recession call, and that means double-digit bond returns await,” The Globe and Mail, September 20, 2024.
That said, markets are now expecting a further 50 bp cut over the remaining 2024 meetings in November and December, with further cuts of at least 100 bp expected in 2025.
So, what’s going on? The most popular thought is, does the Fed know something we don’t know, that the economy is actually worse than it looks? After all, we’ve pointed out the long period of an inverted yield curve that has now turned positive. The inverted yield curve has a long history of predicting recessions, and we’ve never seen such a long period of an inverted yield curve, except before the 1980 and 1981–1982 recessions that were the worst since the Great Depression.
War also has a negative impact on the economy and the potential for higher inflation. With the escalation of war between Israel/Hamas, Hezbollah, Houthis, etc. and the potential for a huge escalation of the Russia/Ukraine war, there are many who believe we are on the cusp of World War III as the West gets closer to being dragged into the wars.
A reminder that the onset of World War I triggered a 40% decline in the Dow Jones Industrials (DJI), while the onset of World War II also triggered a 40% decline for the DJI. A steep recession followed the onset of World War I and, while the economy dipped after the onset of World War II, no official recession occurred until after the war. But this time around, the U.S. is involved in both wars, even if behind the scenes, and at home, the election continues to be highly contentious. We have noted a pick-up in election-related violence. That violence has ranged from assassination attempts on candidate Donald Trump to clashes between supporters of the candidates, disputing the election results if he (Donald Trump) doesn’t win and warning of litigation, threats against election officials, and more.
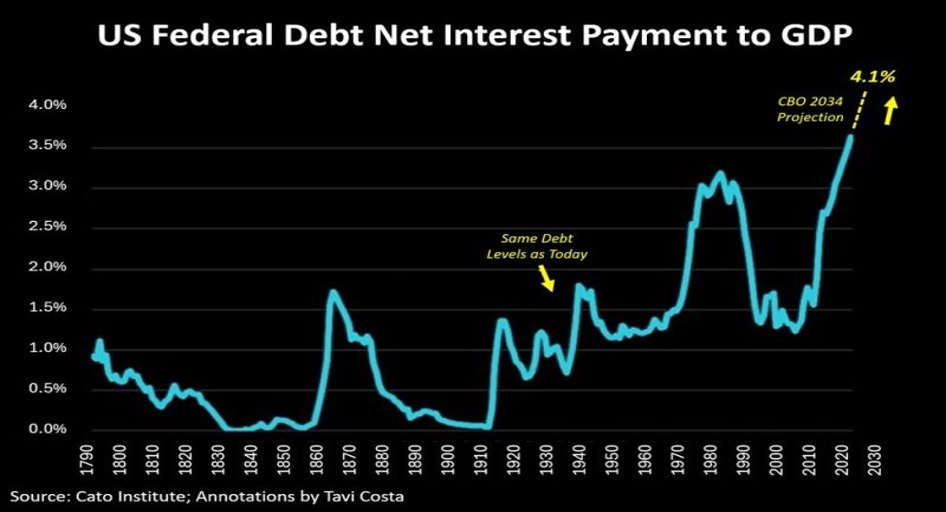
Another reason for the cut might be to ease interest payments, especially for the federal government and its huge debt load. According to statistics, the U.S. federal debt is now $35.3 trillion, a mind-boggling amount representing over 11% of all global debt. Interest payments on the debt are now reaching unheard-of levels at over $1 trillion. That represents some 14% of all government expenses and is larger than what they spend on defense.
 Source: www.cato.org, www.crescat.net, courtesy of Tavi Costa.
The result of all of this has seen the U.S. federal debt to GDP rise to 123.2%. That ranks the U.S. as being the 11th highest country in the world for debt/GDP. But is that saying much when you are behind Lebanon, Venezuela, Sudan, and Italy? Japan leads the way with debt/GDP at 283%. Some 21 countries now have debt/GDP in excess of 100%.
Anything over 100% is a drag on the economy. The debts are now so large that they can never be repaid. Inflation is a friend of debt as it lowers the value of what is owed. Our chart above shows U.S. net interest payments to GDP. That is expected to rise to 4.1% over the next few years. By 2028, federal debt to GDP is expected to rise to 148% and interest payments on the debt could rise to over $4 trillion annually.
The U.S. issues the following type of debt: treasury bills, treasury notes, treasury bonds, treasury inflation-protected notes (TIPS), and floating-rate notes. The table below lists each type of debt with the percentage and amount.
U.S. Treasury Holdings by Type and Holdings ($)
|
Security |
Percentage |
Amount ($) (est.) |
|
Treasury bills |
21% |
$7.4 trillion |
|
Treasury notes |
52% |
$18.4 trillion |
|
Treasury bonds |
17% |
$6.0 trillion |
|
Treasury inflation-protected notes (TIPS) |
8% |
$2.8 trillion |
|
Treasury floating-rate notes (FRNs) |
2% |
$708 billion |
|
Debt held intergovernmental; i.e. social security, Medicare, federal retirement funds |
20% |
$7.1 trillion |
|
Debt held by foreigners |
23.4% |
$8.3 trillion |
|
Debt held by the public; i.e. insurance, banks, funds, sovereign wealth funds, consumers |
56.5% |
$20.0 trillion
|
|
Total U.S. debt |
|
$35.4 trillion |
Source: www.usdebtclock.org, www.pgpf.org, www.fiscaldata.treasury.gov
Social Security is the largest holder of U.S. debt intergovernmental ($2.6 trillion) while Japan is the largest foreign holder of U.S. debt ($1.2 trillion).
All this suggests is that, by lowering the Fed rate, the cut has the biggest impact on treasury bills and notes, FRNs, and TIPS, with a slightly negative effect on treasury bonds as long rates rose. Other lending rates could follow; i.e. mortgages and lines of credit. The average maturity of U.S. treasury securities currently sits around 64 months (5 years, 4 months).
What does all this debt mean for the federal budget and the economy?
The amount of federal debt issued to the public can affect the country’s fiscal and economic health in a number of ways. The nation’s high and rising levels of such debt can affect economic growth and poses a number of risks. It could:
- Reduce private investment and slow the growth of the economy
- Increase interest payments to foreign holders, thereby potentially reducing national income
- Elevate the risk of a fiscal crisis
- Lead to higher interest rates
- Constrain lawmakers from implementing policies to respond to crises or to invest in the future
- Impede intergenerational equity, preventing future generations from accessing public goods and services
Source: www.pgpf.org Peter G. Peterson Foundation
If there is another reason for the 50 bp rate cut, it is the accusation that it is all this is designed to help the election chances for Kamala Harris in November. That reason holds less credibility, given the source. The Fed is an independent agency and does not take its instructions from politicians. That would threaten the independence and credibility of the Fed and could spark a bond sell-off.
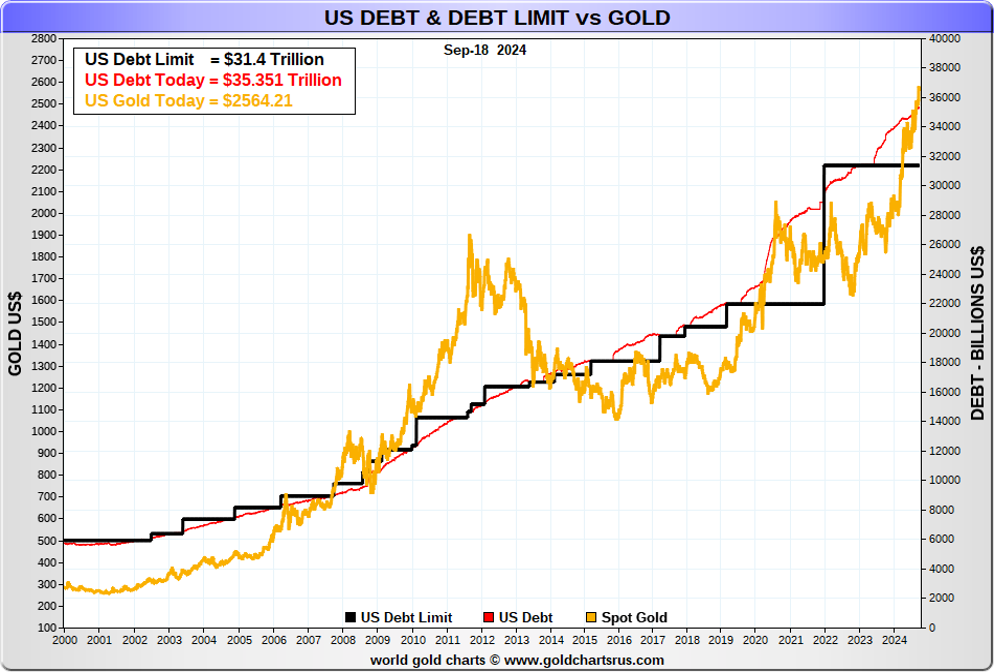
But what about the debt limit as the U.S. debt soars? Of late, the U.S. dollar is not soaring. Instead, it is selling off.
The current debt limit is $31.4 trillion vs. debt outstanding of $35.4 trillion. The debt limit was suspended on June 3, 2023 under the Fiscal Responsibility Act of 2023. This stopped the debt ceiling crisis at the time, but the suspension ends January 1, 2025, two days before the new congress is to be seated, five days before Congress tallies the results on January 6, 2025, and 19 days before inauguration day January 20, 2025. Attempts to raise the debt limit over the past 20 years plus have seen the U.S. brought to the brink of default on more than one occasion. A prolonged debt limit battle could also shut down the government. So, the Fiscal Responsibility Act ending January 1, 2025 brings the response of what could go wrong.
So maybe it’s no surprise that gold appears to rise in lockstep with the rise of U.S. debt and the debt limit. It is interesting to note that gold topped in 2011 during the same period the U.S. was locked in a debt ceiling crisis and the S&P downgraded U.S. debt. The stock market also tumbled during the tumultuous period.
After that peak, gold tumbled some 54% to lows in December 2015. Gold stocks and silver were hit even harder. Since then, however, gold has been rising, albeit in a choppy manner, but generally in lockstep with the rise in U.S. debt and the stock market. Another prolonged debt limit crisis or worse could allow gold to soar just like it did in 2011.
Source: www.goldchartsrus.com
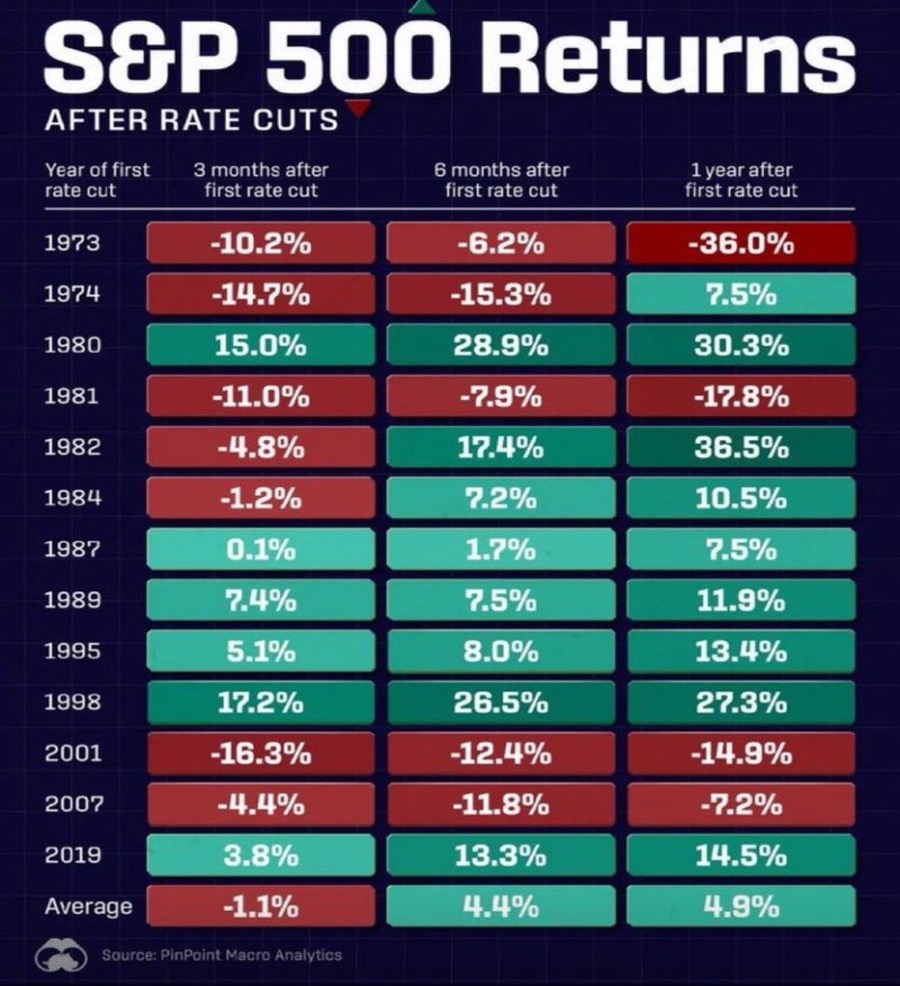
So, what of the stock market after an interest rate cut? The chart below from PinPoint Macro Analytics (www.pinpointmacro.com) shows how the stock market performed following the first rate cut, dating back to 1973. While it performed well in some years such as 1980, 1998, and to a lesser extent in 2019, overall, the performance has been mediocre at best. On only four occasions was the S&P 500 negative after one year out of the 13 cuts. But, overall, performance wasn’t overwhelming, even if, initially at least, the markets reacted negatively the day of the cut but soared the next day. After three months, on average stock markets were down.
The Fed cut of 50 bp was a surprise to many. The biggest message we get from it is that the economy is in trouble, even if it doesn’t seem to be obvious at the moment. And the biggest threats are the expansion of the wars and the deep divisions in the U.S. that could, at worst, culminate in civil war.
Source: www.pinpointmacro.com
Chart of the week
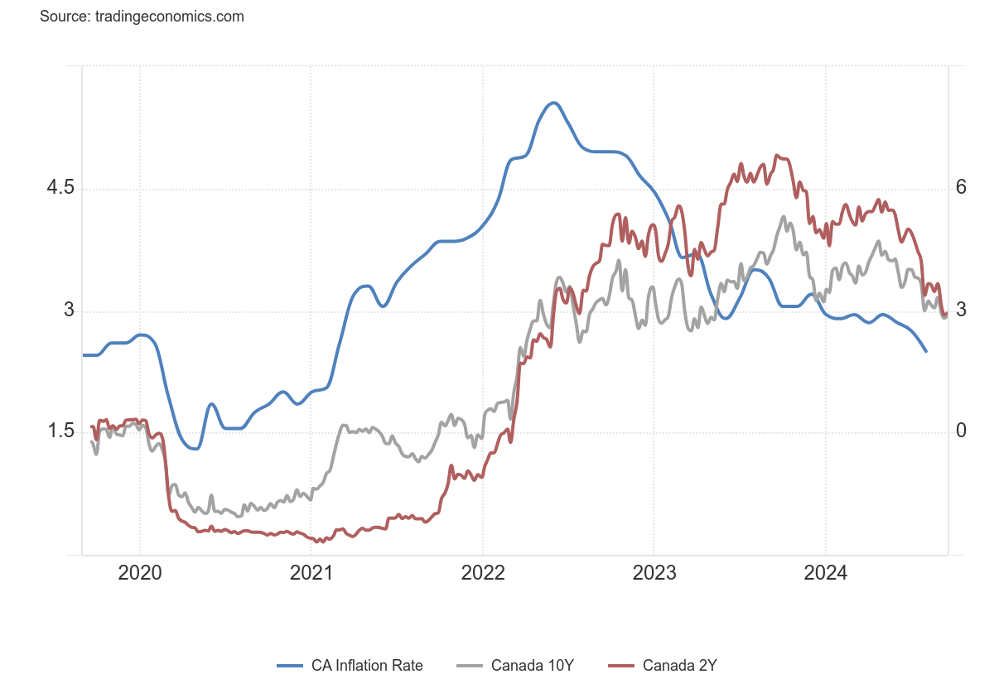
Canada Inflation Rate vs. Canada 10Y and Canada 2Y 2019–2024
 Source: www.tradingeconomics.com, www.statcan.ca, www.bankofcanada.ca
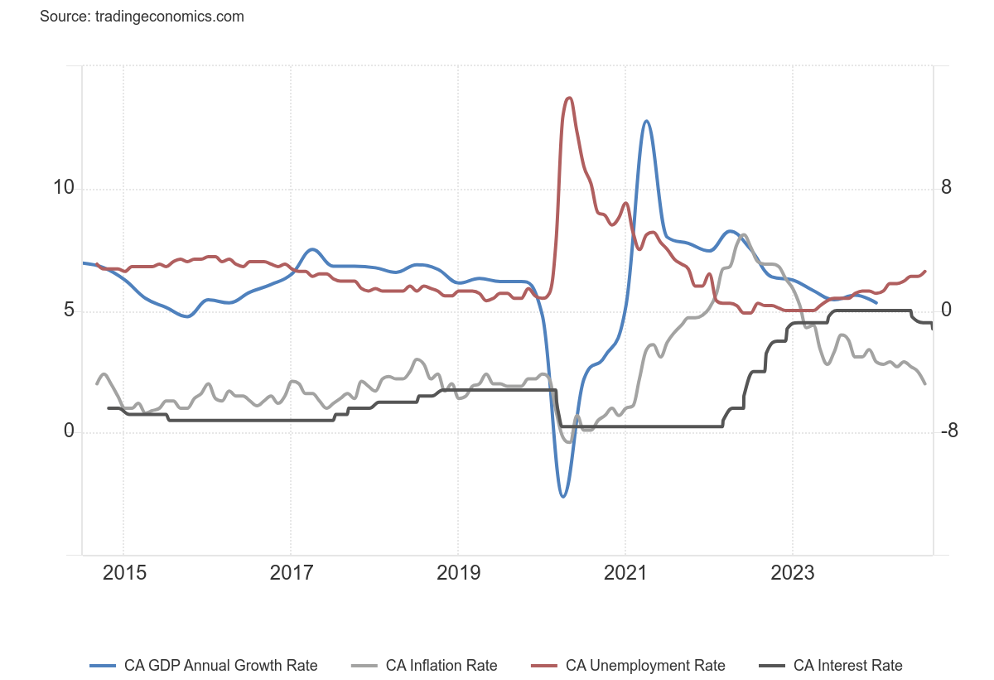
For the third month in a row, Canada’s inflation rate fell. It was last reported for August 2024 at 2%, the lowest level in three years. Canada’s inflation rate peaked at 8.1% in June 2022. Since April 2023, the spread vs. Canada 10-year and Canada 2-year has become positive. This is a dramatic change as from January 1992 the CPI rate has been above the Canada 10-year, a negative spread. That would mean that a bond holder was receiving less than the rate of inflation. A positive spread is good for investors as they are now earning above the rate of inflation. But it was a time when central banks (Canada wasn’t the only one) pushed interest rates low and eventually to-unheard of levels to try and grow the economy, or at least try to stem the effects of a recession, especially during the 2008 financial crisis and the 2020 pandemic.
The CPI growth rate is now below the rate of GDP growth, the unemployment rate, and the BoC key interest rate. All of this suggests that the BoC hiking interest rates is working in bringing down the rate of inflation.
With the rate of inflation now down to the BoC’s targets, they can shift their focus to the labour market
and the growing number of defaults, bankruptcies, and delinquencies. Business bankruptcies have been halved since January 2024. However, consumer defaults, delinquencies, and bankruptcies continue to rise, largely because of high mortgage rates and overborrowing during the housing price boom (bubble?)
Canada Inflation Rate vs. GDP Growth Rate, Unemployment Rate and BoC Interest Rate 2014–2024
 Source: www.tradingeconomics.com, www.bankofcanada.ca, www.statcan.ca
With the rate of inflation now below the key interest rates, it could begin to restore some normalcy. A long period of interest rates below the rate of inflation was eventually proven to be folly, encouraging borrowers to borrow beyond their means and not prepare themselves for the eventual return of a more normal yield curve.
Nonetheless, the BoC now has a difficult job in trying to control rising unemployment and slowing economic growth.
Markets & Trends
|
|
|
|
% Gains (Losses) Trends |
|
||||
|
|
Close Dec 31/23 |
Close Sep 20, 2024 |
Week |
YTD |
Daily (Short Term) |
Weekly (Intermediate) |
Monthly (Long Term) |
|
|
Stock Market Indices |
|
|
|
|
|
|
|
|
|
S&P 500 |
4,769.83 |
5,702.55 (new highs)* |
1.4% |
19.6% |
up |
up |
up |
|
|
Dow Jones Industrials |
37,689.54 |
42,063.36 (new highs)* |
1.6% |
11.6% |
up |
up |
up |
|
|
Dow Jones Transport |
15,898.85 |
15,755.00 (new highs) |
0.2% |
(0.9)% |
up |
up |
up |
|
|
NASDAQ |
15,011.35 |
17,948.32 |
1.5% |
19.6% |
up |
up |
up |
|
|
S&P/TSX Composite |
20,958.54 |
23,867.55 (new highs)* |
1.3% |
13.9% |
up |
up |
up |
|
|
S&P/TSX Venture (CDNX) |
552.90 |
584.91 |
0.8% |
5.8% |
up |
up |
down |
|
|
S&P 600 (small) |
1,318.26 |
1,415.08 |
2.2% |
7.3% |
up |
up |
up |
|
|
MSCI World |
2,260.96 |
2,467.35 |
2.2% |
9.1% |
up |
up |
up |
|
|
Bitcoin |
41,987.29 |
62,765.34 |
5.2% |
49.5% |
up |
up (weak) |
up |
|
|
|
|
|
|
|
|
|
|
|
|
Gold Mining Stock Indices |
|
|
|
|
|
|
|
|
|
Gold Bugs Index (HUI) |
243.31 |
328.75 (new highs) |
0.1% |
35.1% |
up |
up |
up |
|
|
TSX Gold Index (TGD) |
284.56 |
378.79 (new highs) |
0.3% |
33.1% |
up |
up |
up |
|
|
|
|
|
|
|
|
|
|
|
|
% |
|
|
|
|
|
|
|
|
|
U.S. 10-Year Treasury Bond yield |
3.87% |
3.75% |
2.5% |
(3.5)% |
|
|
|
|
|
Cdn. 10-Year Bond CGB yield |
3.11% |
2.97% |
1.7% |
(4.5)% |
|
|
|
|
|
Recession Watch Spreads |
|
|
|
|
|
|
|
|
|
U.S. 2-year 10-year Treasury spread |
(0.38)% |
0.15 |
114.3% |
140.5% |
|
|
|
|
|
Cdn 2-year 10-year CGB spread |
(0.78)% |
0.00 |
100.0% |
100.0% |
|
|
|
|
|
|
|
|
|
|
|
|
|
|
|
Currencies |
|
|
|
|
|
|
|
|
|
US$ Index |
101.03 |
100.80 (new lows) |
(0.3)% |
(0.2)% |
down |
down |
neutral |
|
|
Canadian $ |
75.60 |
73.70 |
0.2% |
(2.5)% |
up (weak) |
neutral |
down |
|
|
Euro |
110.36 |
111.60 |
0.8% |
1.1% |
up |
up |
up (weak) |
|
|
Swiss Franc |
118.84 |
117.55 |
(0.2)% |
(1.1)% |
up (weak) |
up |
up |
|
|
British Pound |
127.31 |
133.16 (new highs) |
1.4% |
4.6% |
up |
up |
up (weak) |
|
|
Japanese Yen |
70.91 |
69.45 |
(2.1)% |
(2.1)% |
up |
up |
up (weak) |
|
|
|
|
|
|
|
|
|
|
|
|
|
|
|
|
|
|
|
|
|
|
Precious Metals |
|
|
|
|
|
|
|
|
|
Gold |
2,071.80 |
2,046.20 (new highs)* |
1.4% |
27.7% |
up |
up |
up |
|
|
Silver |
24.09 |
31.50 |
1.4% |
30.8% |
up |
up |
up |
|
|
Platinum |
1,023.20 |
981.90 |
(2.5)% |
(4.0)% |
up (weak) |
up (weak) |
neutral |
|
|
|
|
|
|
|
|
|
|
|
|
Base Metals |
|
|
|
|
|
|
|
|
|
Palladium |
1,140.20 |
1,078.10 |
0.7% |
(5.5)% |
up |
up (weak) |
down |
|
|
Copper |
3.89 |
4.34 |
2.5% |
11.6% |
up |
up |
neutral |
|
|
|
|
|
|
|
|
|
|
|
|
Energy |
|
|
|
|
|
|
|
|
|
WTI Oil |
71.70 |
71.00 |
3.4% |
(1.1)% |
down |
down |
down |
|
|
Nat Gas |
2.56 |
2.72 |
17.8% |
6.3% |
up |
up |
down |
|
Source: www.stockcharts.com
Note: For an explanation of the trends, see the glossary at the end of this article.
New highs/lows refer to new 52-week highs/lows and, in some cases, all-time highs.
- * New All-Time Highs
 Source: www.stockcharts.com
It was the week of the Fed and its 50 bp rate cut. Stock markets responded in a volatile fashion. First, they were down, then the next day they were up, but on Friday we turned down again. The action suggests a possible top. The S&P did make new all-time highs but not everyone joined them. The S&P 500 (SPX) gained 1.4% on the week, the Dow Jones Industrials (DJI) made all-time highs up 1.6%, and the Dow Jones Transportations (DJT) was up 0.2% but nowhere near all-time highs as it continues to underperform the DJI. The NASDAQ was nowhere near its all-time highs, but did gain 1.5%. Others making all-time highs were the S&P 500 Equal Weight Index +1.3%, the Value Line +1.9%, the Dow Jones Composite (DJC) +1.0%, the Russel 1000 and 3000, both +1.5%, and the Wilshire 5000 +1.5%.
In Canada, the TSX Composite made all-time highs, up 1.3% while the TSX Venture Exchange (CDNX) gained 0.8%. In the EU, the London FTSE fell 0.5%, the EuroNext +0.2%, the Paris CAC 40 +2.0%, and the German DAX +1.6% to new all-time highs. In Asia, China’s Shanghai Index bounced back, up 1.2%, the Tokyo Nikkei Dow (TKN) gained 3.1%, while Hong Kong’s Hang Seng (HSI) was up almost 5.0%. The MSCI World Index gained 2.2%. Bitcoin was up 5.2% and back over $60,000.
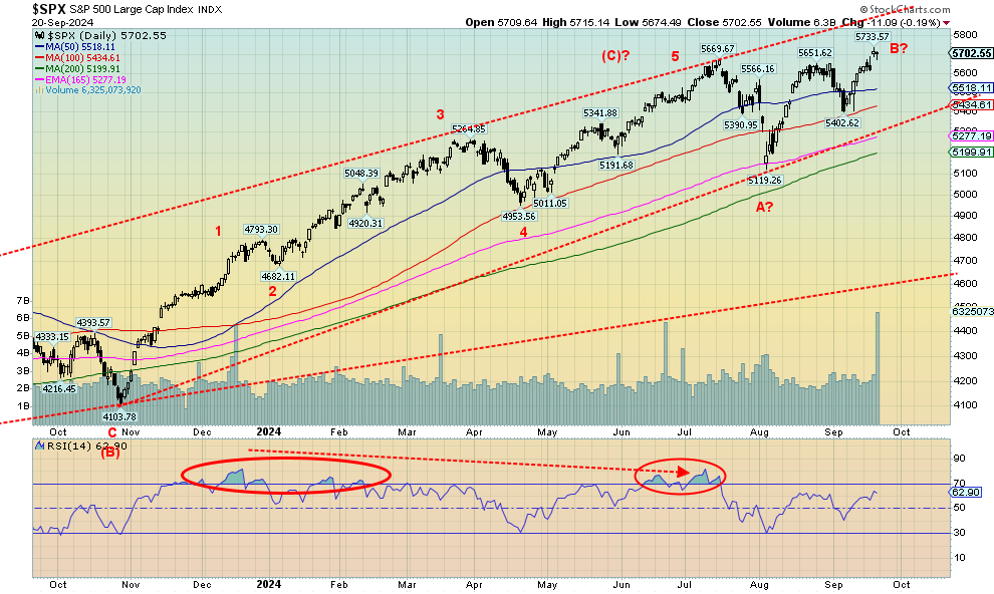
We believe the real top for the SPX was in July. It was followed by a 10% decline briefly into correction territory (A). But the rebound rally has all the makings of B wave up, even with the new all-time highs. In looks, it has a bit of shades of the 2007 top. And we know what happened next with that, even if it took another year. We are in the vicinity of the four-year cycle low, dating from the March 2020 pandemic low. We have also entered the period of the 18-year cycle low dating from March 2009. But the 18-year cycle has a range of at least 15 (2024) to 21 years (2030), centered on 2027. The six-year cycle low would be due in 2028, dating from the 2022 bear market. The most recent low was near 5,400, so a break of that level would suggest we are going lower. But the key break is under 5,120 as that would signal the bull is over. That could also signal we’re falling into a more serious drop.
Numerous divergences exist between the indices, with some making all-time highs and others not. Indicators are also diverging. The background is not positive with a weakening economy, the wars, and the domestic political split. But the stock market has kept going higher, signaling all is well. Until it isn’t.
 Source: www.stockcharts.com
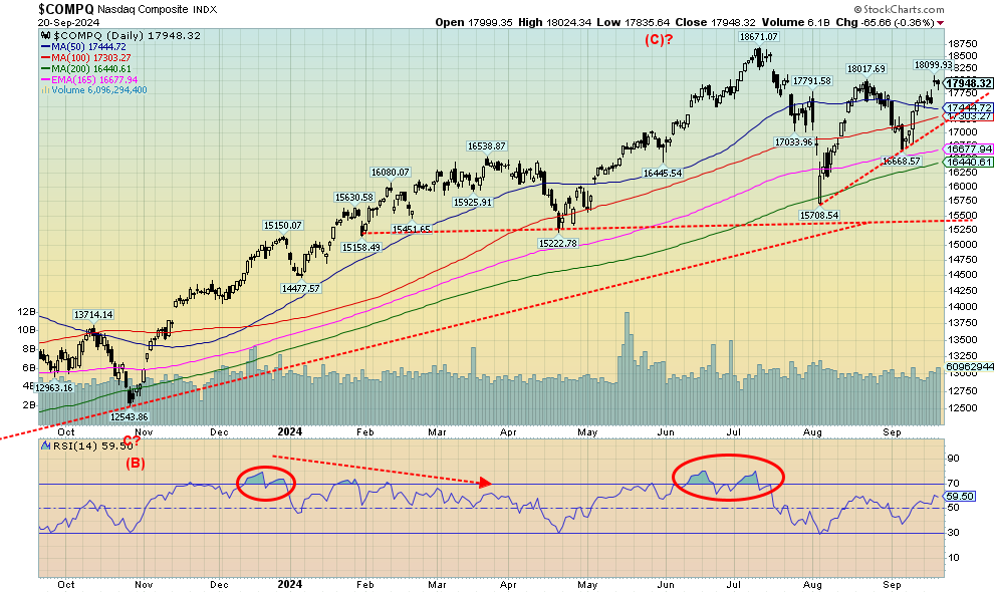
One reason the markets seem to be continuing in a topping pattern is that the NASDAQ, that led the market up, did not make new all-time highs this past week with the S&P 500 and DJI. The NASDAQ is about 4% off that high. On the week, the NASDAQ gained 1.5%. The NY FANG Index that contains the Mag 7 was up 1.9% as the Mag 7 rose on the week. Meta gained 7% and made fresh all-time highs. It was the big winner on the week. Google was up about 4%. But Nvidia, the previous big winner, continued its recent woes, falling 2.6%.
While not a member of the NY FANG Index it is noteworthy Trump Media and Technology (DJT) fell another 24.6% this past week, making fresh 52-week lows. DJT is now down 83% from its March 2024 high. Apparently, one of the reasons cited was the end of the lockup period for insiders who bought at issue. That includes Donald Trump, who apparently owns roughly 115 million shares, currently worth about $1.6 billion. At their high, they were worth $9.1 billion. Trump has said he would not be selling any, at least not until he does. If he starts selling (it has to be declared given he is an insider), then it could cause a panic and send DJT even lower. The NASDAQ making a lower top and a possible lower double top does not bode well. The breakdown point for the potential double top is at 16,670. The recent high at 18,017 does suggest we could make new highs, but the sharp pullback followed by the rebound, which so far remains below that level (hence the possible double top), is something to watch carefully. Failure means we will fall.
 Source: www.stockcharts.com
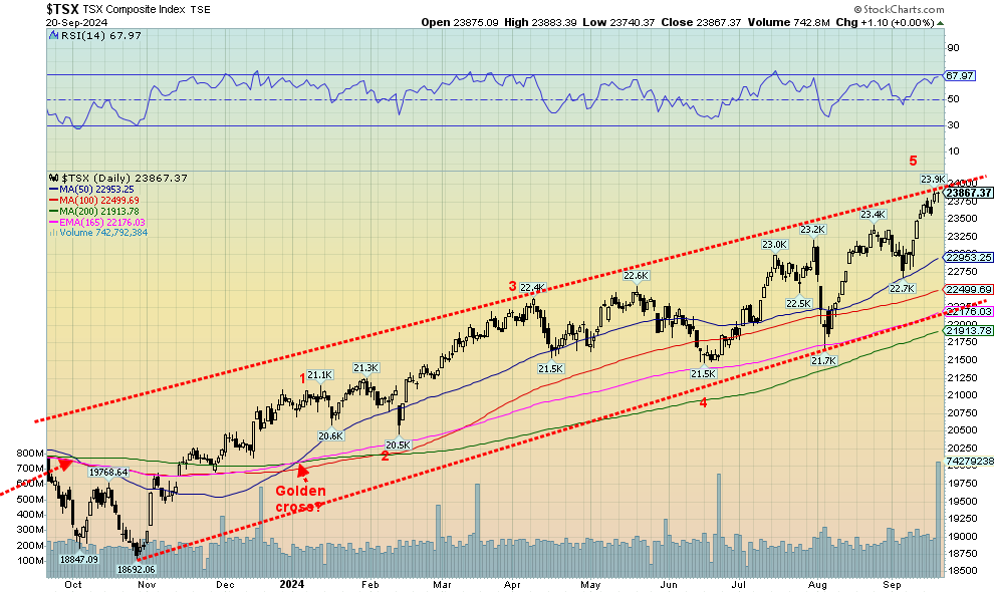
The TSX Composite continues to make new all-time highs. Lately, it is being led by the Materials index, along with Golds and Mining and Metals. Financials are also playing a big role in the rise. The TSX Composite was up 1.3% this past week and the TSX 60 also made new all-time highs, up 1.1%. The TSX Venture Exchange (CDNX) gained 0.8% but remains below its 52-week high. Of the sub-indices, nine were up while five were down. Some sub-indices made fresh all-time highs. That includes Income Trusts (TCM) +0.1%, Consumer Discretionary (TCD) +1.8%, Financials (TFS) +1.8%, and Information Technology (TKK) +3.3%. The biggest gain on the week was Health Care (THC) +4.9%. The biggest loser was Consumer Staples (TCS), down 1.3%. Energy (TEN) jumped 3.0%, thanks to the rebound in oil and gas prices. The TSX is now at the top of a channel. We’d say the odds of it breaking out are slim to none. But we could be surprised, especially if the materials sector powers higher. Financials appear to be overbought. A pullback would not be a disaster, as long as we are climbing in the bull channel. The breakdown point isn’t until under 22,170. Under 22,000 it may be all over. Volume was quite high this past week, signalling either more to come or a high. We are just not sure which, but the top of the channel suggests a high.
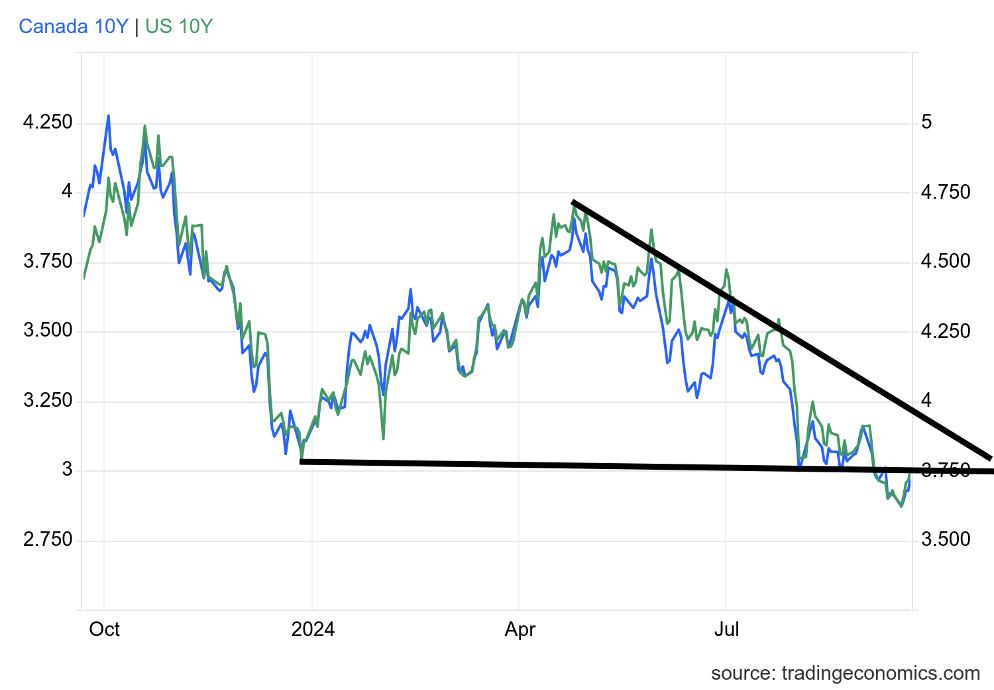
U.S. 10-year Treasury Note, Canada 10-year Bond CGB
 Source: www.tradingeconomics.com, www.home.treasury.gov, www.bankofcanada.ca
The Fed cut its key rate and, while short-term U.S. treasuries saw yields fall, long-term U.S. treasuries saw yields rise. Rates rose because Fed Chair Jerome Powell emphasized that the U.S. economy remains robust and the Fed is in no rush to loosen monetary policy. The Fed intends to continue its $25 billion a month quantitative tightening program. This coming Thursday the final GDP for Q2 is released, which is widely expected to come at a robust 3%. That’s above Q1 growth of 1.4%. The no-landing, soft-landing people are cheering. It’s the Goldilocks economy. We’ve heard that before, just before the economy has fallen into a deeper recession. The spread on the yield curve has turned positive, at least for the 2–10 spread that is now +0.15%. Canada also had its 10-year Government of Canada bond (CGB) rise to 2.97%, up from 2.92%. The U.S. 10-year rose to 3.75% from 3.66%. Canada’s 2–10 spread is now flat. A positive yield spread after a long period of negative spreads has consistently proven to be the sign of an impending recession. If we continue above 3.75% towards 4.00%, we’ll know rates have bottomed for now. It will also make the U.S. treasury’s bonds more expensive, putting upward pressure on interest rate payments on the Federal debt that has now approached one trillion dollars.
Other key numbers out this coming week include new home housing prices, the S&P Global PMI flash, S&P Case Shiller housing price index, the Conference Boards consumer confidence, the Michigan Sentiment Index for September final, Richmond Fed’s manufacturing index, new home sales, PCE prices, durable goods, the ongoing weekly jobless claims, the trade balance, and personal spending and income. Lots to chew on this coming week. We’ll see if the economy is as strong and robust as the Fed says. Still, the expectations are for another minimum 50 bp cut this year and maybe even a 100 bp cut.
 Source: www.stockcharts.com
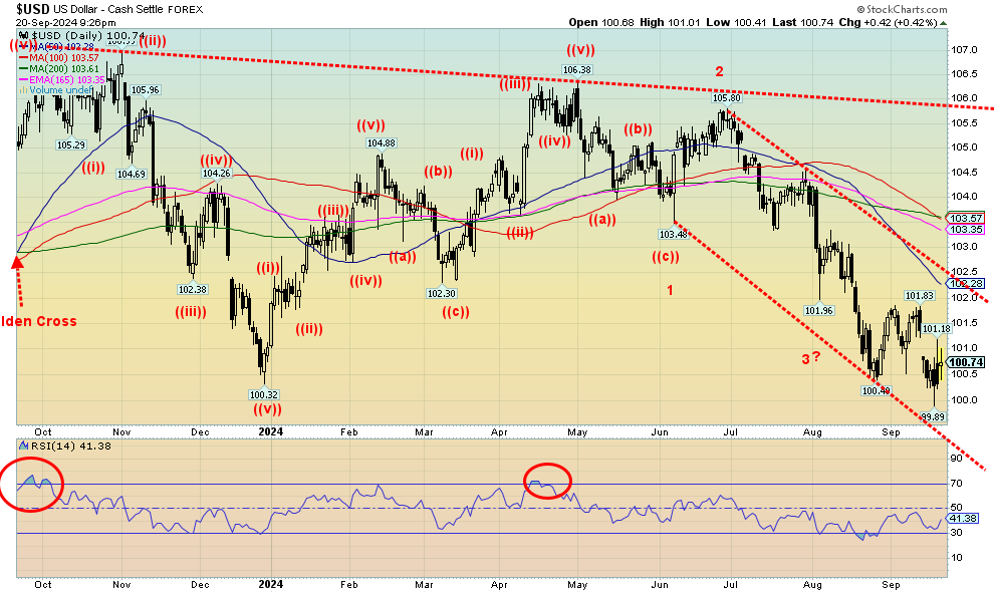
The US$ Index continues to tumble, hitting a 52-week low of 99.89 this past week. It was the first time under 100 since July 2023 and that proved to be a low. On the week, the US$ Index lost 0.3%. The prime beneficiary was the pound sterling that gained 1.4%. That was a good offset to the fall of the Japanese yen, down 2.1%. The euro was up 0.8% while the Swiss franc fell 0.2%. The Canadian dollar gained about 0.2%. The yen fell because of increased volatility and thoughts the BOJ might hold interest rates at its next meeting rather than raise rates further at this time. Technically, we hit or at least came near the bottom of a channel. The expectation now is we might have a bounce. But that it might be short-lived. Nonetheless, the reasons for the US$ Index’s fall are quite similar to why gold is rising, which we explain next. A return back under 100.25 should then project the US$ Index to fall further under 100. One positive aspect of a falling US$ Index is that US$-denominated debt in emerging countries now becomes a bit cheaper. To project higher, we’d first have to regain above the recent high of 101.83.
 Source: www.stockcharts.com
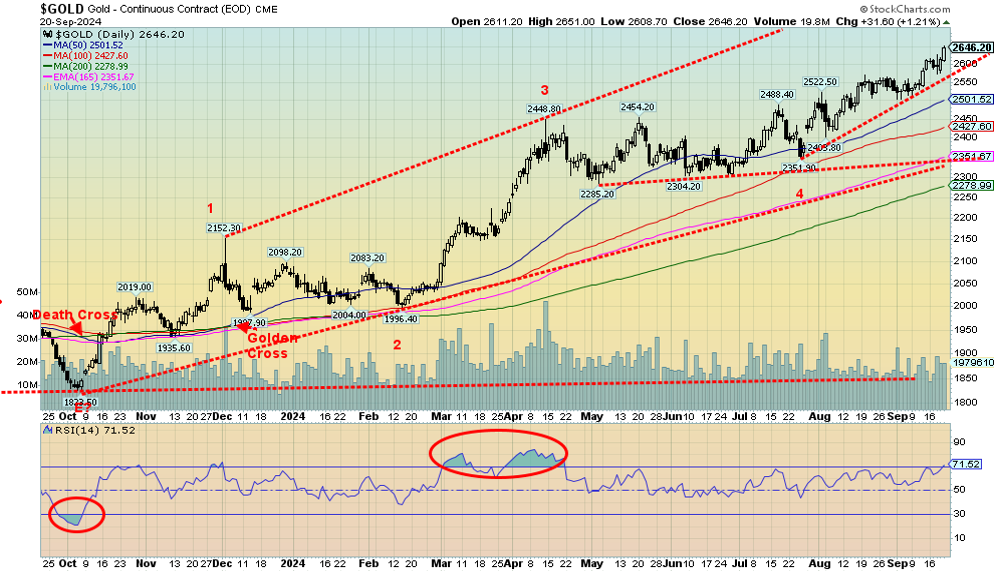
Gold has responded positively to the Fed rate cut. The cut helped lower the US$ Index, which is positive for gold. The result was gold soared to another new all-time high, closing at $2,646. $2,700 is on the radar. Nothing like an aggressive rate cut by the Fed to get things going. But the gain on the week was only about 1.4%. Silver also rose about 1.4%. However, platinum continues its woes, losing 2.5%, and is down 4.0% on the year compared to gold, up 27.7%, and silver, up 30.8%. Copper gained 2.5% and appears to once again be breaking out. We saw up moves on a number of copper-based stocks this past week.
Other reasons gold is pushing higher are the escalation of the wars between Russia/Ukraine and Israel/Hamas/Hezbollah, Houthis and, indirectly, Iran and Syria. Economist Martin Armstrong (www.armstrongeconomics.com) reported on his private blog that a munitions dump north of Moscow was hit using British-made, long-range missiles that may have contained nuclear components because of the huge hole they left. This is not verified, but does highlight the potential for a major escalation in that war. In the Middle East there is very little sign that the sides are even talking. Peace is further away than ever, given the attacks against Hezbollah this past week. Gold is a geopolitical safe haven.
Domestically, it is the same, as violence is rising as we get closer to the election, an election sure to be challenged if Trump loses and possibly as well if Harris loses. Neither side has even the remotest of will to talk to each other. Talk of clashes between the sides is also dominating the discussion. The assassination attempts against Trump also highlight the gravity of the situation. Gold is a safe haven from domestic politics as well.
Finally, as we have noted before, central bank buying of gold continues as they try to exit U.S. treasuries. The U.S.’s thoughts of moving $300 billion of seized Russian assets to Ukraine has made numerous countries nervous, prompting the purchase of gold. Russia is also doing business in gold rather than in U.S. dollars since they have been removed from SWIFT. That allows Russia to continue trade and avoid sanctions.
The gain this year for gold is the largest since 2010, yet we see few signs, if any, that gold has topped. The RSI has risen into overbought territory, but we’ve seen in the past that this condition can remain longer than the shorts can stay solvent in a strong market. Forecasts are for gold to hit $2,700 by January 2025, possibly sooner. The massive cup and handle pattern that formed between 2011 and earlier this year projects up to at $3,100–$3,200. If that level was taken out, the next stop could be $3,800.
Downside under $2,450 could suggest further losses, but under $2,300 would suggest that the rally is over. The reasons for holding gold continue to pile up. Yet gold today remains very under-owned, especially in North America. The biggest fear is governments putting controls on gold, as gold moving higher shows a lack of confidence in governments. We continue to see higher prices ahead accompanied by periodic sharp pullbacks.
 Source: www.stockcharts.com
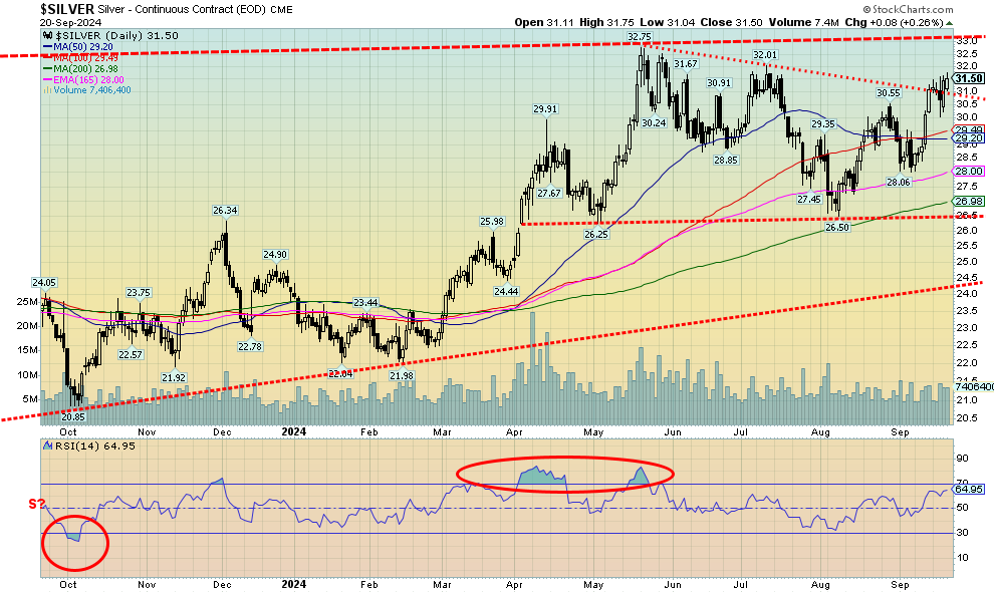
When bullion rises, who leads? It should be silver. But silver also leads to the downside. The much-despised gold/silver ratio is still extremely high, at a too-high level that is currently 84. It peaked at 127 during the height of the pandemic. In 2011, at the top of the market for gold and silver, the ratio was about 31. The all-time low was 15.6, but that was way back in 1980. Today, silver would need to be at $169 to reach that level. We have a long way to go. Even the most recent lows of 64 in 2021 and 73 in July 2024 are a way away. Silver did not lead this past week, but at least it tied gold’s gains of about 1.4%. We appear to be breaking that downtrend line from the May top. The close at $31.50 does suggest we should take out the July top with potential targets up to at least $37 and possibly up to $40. Support is now at $30, but a breakdown under $26.50 would be highly negative with the first warning sign at $28.
 Source: www.stockcharts.com
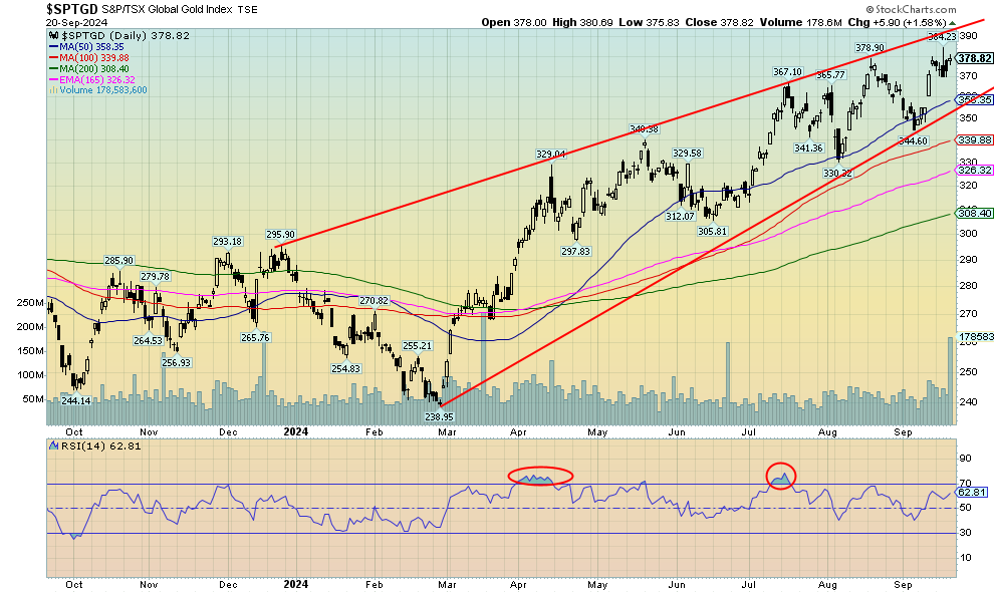
Gold stocks continue to climb, although the pace this past week was no doubt painfully slow for many gold bugs. Still, we once again made 52-week highs so there were some positives. On the week, the TSX Gold Index (TGD) rose just under 0.3% while the Gold Bugs Index (HUI) was up a feeble 0.05% or generously rounded to 0.1%. We remain well between the rising channel that looks a bit like an ascending wedge (bearish) triangle. The top of the channel is up around 390/400. The breakout from a huge symmetrical triangle in July 2024 with the start of the triangle dating back to 2015 is projected to send the TGD to new record highs at 600–650. The high of the past few years is at 416, set in July 2020, but we are getting close to that one. The all-time high was 455, set back in 2011. We are already through the point that suggests to us that we should see new all-time highs over 455. The TGD currently is down almost 17% from its all-time highs. That’s much better than the HUI, which remains down 49% from its all-time high. Different components account for the difference. The RSI is only at 63, so it has considerable room to move higher before becoming overbought. We expect to see the July 2020 high taken out on this move. Below 350 is a support zone, but under that the correction could be deeper.
 Source: www.stockcharts.com
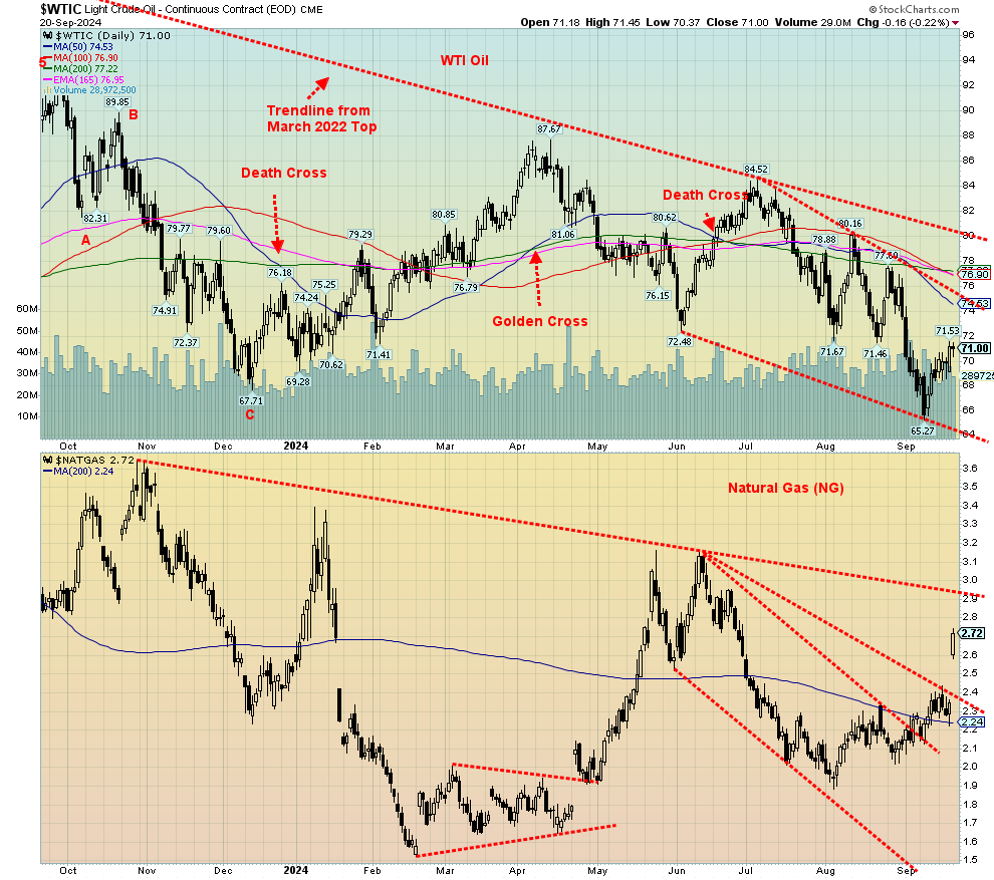
For the second week in a row, oil prices rose. The question is, has the sentiment changed and if so, what changed it? Certainly, the Fed rate cut helps as it suggests there could better economic behaviour, thus raising demand. Nonetheless, the response so far, while positive, has not been a screaming up move. WTI oil stocks have hit a five-year low and that could also be a catalyst as the U.S. will have to refill its oil reserves. In the Midwest in particular, stocks have fallen to 2014 levels. Offsetting the need to replenish reserves is projected weakened demand from China, which is experiencing its version of a recession, just not with the negative GDP growth.
On the week, WTI oil rose 3.4%, Brent crude was up 3.1%, while natural gas (NG) jumped 17.8% and NG at the Dutch Hub was down 3.1%. Both WTI oil and NG have a lot of work to do to reach levels that would suggest a significant breakout. While we suspect that WTI may have bottomed, we’d be more positive if we were over $74 and preferably $77. WTI fell quite a way and had become oversold. A better breakout doesn’t occur until over $80. We have a way to go. NG broke out Friday, leaping higher as another Caribbean hurricane looms. Hurricane Francine shut down some 53% of gulf production. NG leaped over $2.50, but the bigger breakout doesn’t occur until over $2.90.
War is a primary reason oil prices could rise. With the escalation and possible expansion of the war in the Middle East, the risk is that Iran and the U.S. become involved. As we have noted many times, the Straits of Hormuz are the most dangerous oil delivery passage in the world. The Red Sea and, by extension, the Suez Canal continue to experience attacks by the Houthis, including the recent sinking of a ship which sparked a big rise in insurance rates. Drought continues to impact the Panama Canal. Oil prices could soar if Iran becomes directly involved in the Middle East wars.
Copyright David Chapman 2024
GLOSSARY
Trends
Daily – Short-term trend (For swing traders)
Weekly – Intermediate-term trend (For long-term trend followers)
Monthly – Long-term secular trend (For long-term trend followers)
Up – The trend is up.
Down – The trend is down
Neutral – Indicators are mostly neutral. A trend change might be in the offing.
Weak – The trend is still up or down but it is weakening. It is also a sign that the trend might change.
Topping – Indicators are suggesting that while the trend remains up there are considerable signs that suggest that the market is topping.
Bottoming – Indicators are suggesting that while the trend is down there are considerable signs that suggest that the market is bottoming.
Disclaimer
David Chapman is not a registered advisory service and is not an exempt market dealer (EMD) nor a licensed financial advisor. He does not and cannot give individualised market advice. David Chapman has worked in the financial industry for over 40 years including large financial corporations, banks, and investment dealers. The information in this newsletter is intended only for informational and educational purposes. It should not be construed as an offer, a solicitation of an offer or sale of any security. Every effort is made to provide accurate and complete information. However, we cannot guarantee that there will be no errors. We make no claims, promises or guarantees about the accuracy, completeness, or adequacy of the contents of this commentary and expressly disclaim liability for errors and omissions in the contents of this commentary. David Chapman will always use his best efforts to ensure the accuracy and timeliness of all information. The reader assumes all risk when trading in securities and David Chapman advises consulting a licensed professional financial advisor or portfolio manager such as Enriched Investing Incorporated before proceeding with any trade or idea presented in this newsletter. David Chapman may own shares in companies mentioned in this newsletter. Before making an investment, prospective investors should review each security’s offering documents which summarize the objectives, fees, expenses and associated risks. David Chapman shares his ideas and opinions for informational and educational purposes only and expects the reader to perform due diligence before considering a position in any security. That includes consulting with your own licensed professional financial advisor such as Enriched Investing Incorporated. Performance is not guaranteed, values change frequently, and past performance may not be repeated.
About the author


Website: https://www.enrichedinvesting.com
Disclaimer: David Chapman is not a registered advisory service and is not an exempt market dealer (EMD) nor a licensed financial advisor. We do not and cannot give individualised market advice. David Chapman has worked in the financial industry for over 40 years including large financial corporations, banks, and investment dealers. The information in this newsletter is intended only for informational and educational purposes. It should not be considered a solicitation of an offer or sale of any security. The reader assumes all risk when trading in securities and David Chapman advises consulting a licensed professional financial advisor before proceeding with any trade or idea presented in this newsletter. David Chapman may own shares in companies mentioned in this newsletter. We share our ideas and opinions for informational and educational purposes only and expect the reader to perform due diligence before considering a position in any security. That includes consulting with your own licensed professional financial advisor.