
What a difference a week makes. We go from looking like we're about to collapse to coming back and looking like we'll soon make new highs. One did. Gold once again made new all-time highs and now appears headed to $2,600. Lundin Gold Inc., for example, reported increased net income, significant cash flow, and record revenues and EBITDA, pays a dividend and is held in the Enriched Capital Conservative Growth Strategy.* Better still silver came to life and led the way along with the gold stocks. Can they keep it up?
CPI was marginally weaker again and the babble on the street became a 50 bp rate cut in September from the Fed. Don't count on it. Some other economic numbers came out that showed there was still life in the economy. A 25 bp cut seems to be baked in. We also look at a couple of areas that are concerning. Nonetheless, rate cuts are often associated with the stock market rising. And this past week it went from extreme fear to complacency in a heartbeat.
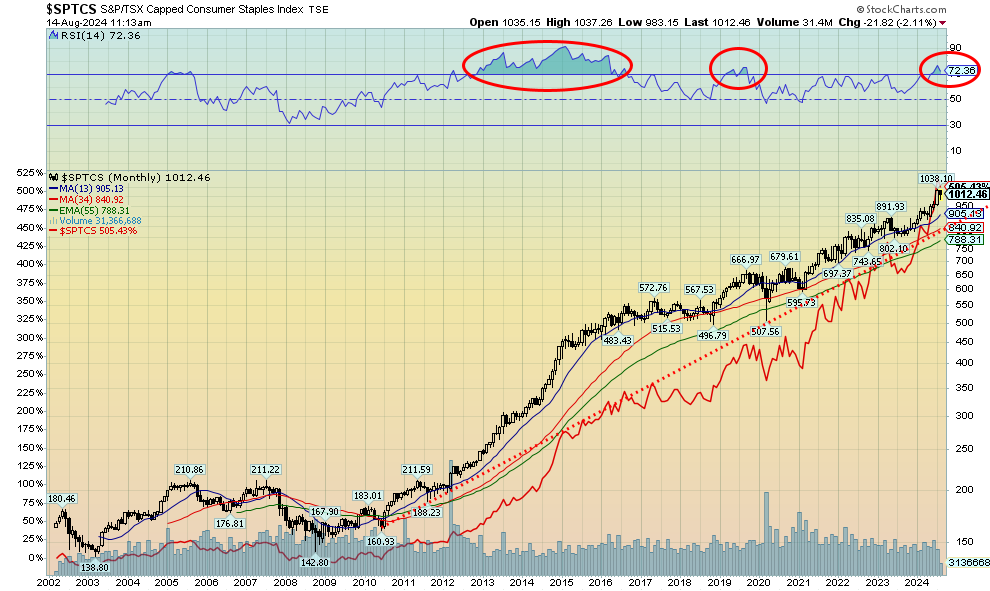
An overlooked sector has been one of the best performers this century. Its rise has been nothing short of spectacular. But then again food isn't sexy but it is necessary. AI is sexy but is it necessary? Yes, the consumer staples sector has been on a steady trajectory upward, particularly since the 2008 financial crisis. Consumer staples are the subject of the chart of the week (page 7). The sector is still showing no signs of topping.
Seems everyone rose this past week, stocks, gold, and even energy stocks despite oil prices faltering against the background of geopolitics.
There is not a lot on this coming week. The big focus will be on Jackson Hole, Wyoming for the 3 day annual economic symposium attended by the heads of central banks from around the world. Fed Chair Jerome Powell will be a featured speaker.
Have a great week!
DC
* Reference to the Enriched Capital Conservative Growth Strategy and its investments, celebrating a 6-year history of strong growth, is added by Margaret Samuel, President, CEO, and Portfolio Manager of Enriched Investing Incorporated, who can be reached at 416-203-3028 or msamuel@enrichedinvesting.com
“Anyone who believes that exponential growth can go on forever in a finite world is either a madman or an economist.”
—Kenneth E. Boulding, British-American economist, educator, peace activist, philosopher, author of Conflict and Defense: A General Theory (1962), plus others; 1910–1993
“When people begin anticipating inflation, it doesn't do you any good anymore, because any benefit of inflation comes from the fact that you do better than you thought you were going to do.”
- Paul A. Volcker, American economist, 12th Chairman Federal Reserve 1979–1987, President Federal Reserve Bank New York 1975–1979, Chair President’s Economic Recovery Advisory Board 2009–2011; 1927–2019
“Banking establishments are more dangerous than standing armies; and that the principals of spending money to be paid by posterity, under the name of funding, is but swindling futurity on a large scale.”
—Thomas Jefferson, American statesman, planter, lawyer, architect, philosopher, founding father of the U.S., 3rd president of the U.S. 1801–1809, formerly Secretary of State, Vice President; 1743–1826
Everybody is trying to forecast what the Fed will do at its September meeting—cut 25 bp or cut 50 bp. One thing is for sure; the Fed will not be pushed into making any rate cut decision. Over the years, from our own observations, it’s clear that the Fed truly is independent and does not accept any political interference. The same can be said for Canada’s Bank of Canada (BofC), but also for the Bank of England (BOE), Bank of Japan (BOJ), European Central Bank (ECB), etc. The chair of the central banks may be appointed by the government, but that only occurs after there has been consensus on candidates chosen independently, usually by the other directors of the central bank. Political interference is neither welcome nor desired, and if that was perceived to be the case, markets would most likely react negatively.
Inflation, both the CPI and core CPI, rose 0.2% in the U.S. for July, which was expected. On a year-over-year (y-o-y) basis the CPI slowed to 2.9% in July, down from 3.0%. The core CPI (ex. food and energy) fell to 3.2%, down from 3.3%. For the record, the Personal Consumption Rate (PCE), which the Fed prefers, is even lower at 2.6%. Our chart shows both CPI and core CPI y-o-y along with the U.S. 10-year treasury note and the Fed rate. With the 10-year around 3.9% and the Fed rate at 5.25%–5.50%, both are comfortably above the inflation rate. It’s positive yields, a far cry from what occurred from 2002 to 2022 for the most part when the Fed rate and the 10-year were below the rate of inflation.
Inflation has come down, but it still remains above the Fed’s 2% target rate. However, we believe that the inflation rate is not the Fed’s main focus. High interest rates have done their job and brought down the inflation rate. What then becomes key for the Fed is the labour market and how it responds.
Inflation Rate, Core Inflation Rate, Fed Rate, 10-Year Note 2014–2024
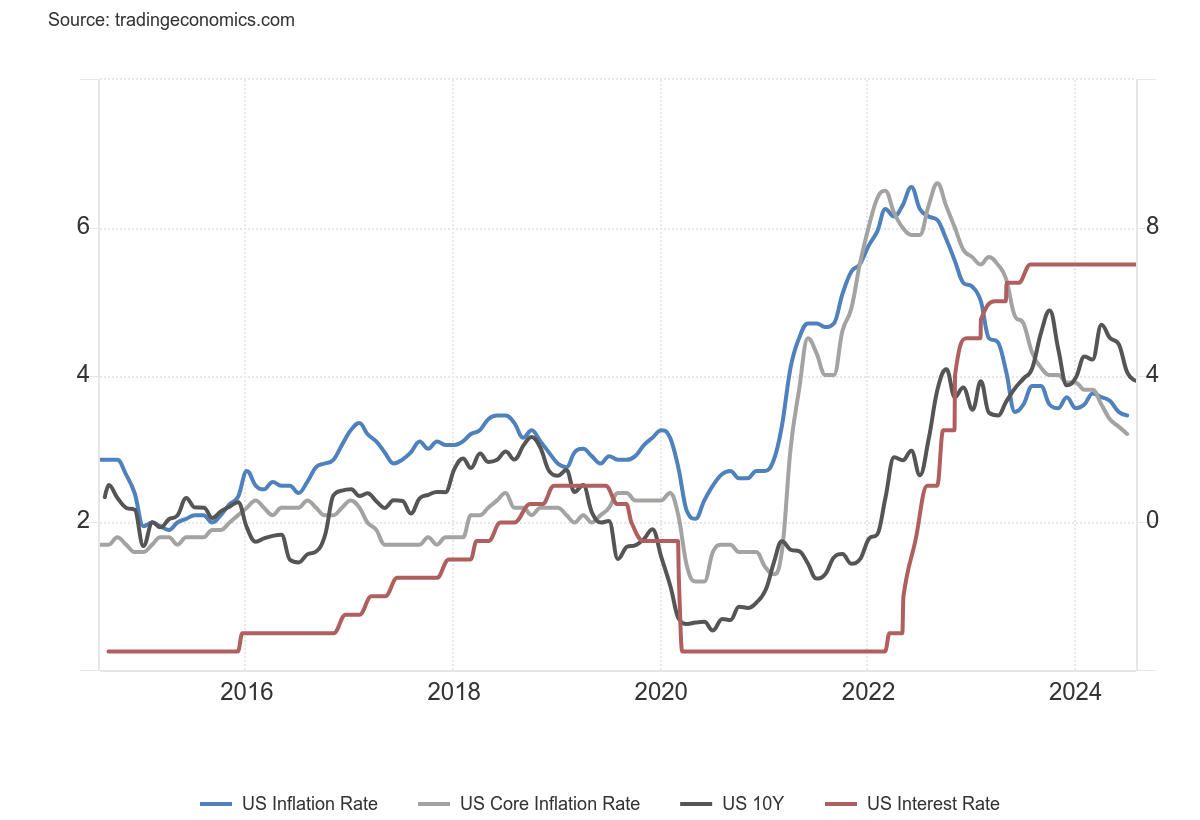
Source: www.tradingeconomics.com, www.bls.gov, www.federalreserve.gov,
Here, the labour market is mixed. The market was surprised this week when the weekly claims came in lower than expected at 227,000, below the expected 235,000. It was the second consecutive weekly drop after peaking at 250,000 three weeks ago. The unemployment rate has risen to 4.3% up from lows in late 2023 and early 2024 of 3.7%. Historically, that is still pretty low. The number of unemployed has gone up while the number employed is flatlining down. The growth of public sector jobs has exceeded growth in the private sector, but then nurses and teachers are part of the public sector. Young people in the 15–24 age bracket and new immigrants are having the most trouble finding a job. Bankruptcies, both business and individual, have been rising considerably, but so far there has been no defining bankruptcy à la Lehman Brothers in 2008 that helped trigger the global financial crisis. In other words, yes, they are up but it is manageable, so far.
Retail sales were also surprised. All that was expected was a rise of 0.2% month over month (m-o-m). Instead, they jumped 1.0%. Y-o-y, they were up 2.7%, well above the expected 1.8%. The labour market is still buoyant with weekly claims down, while retail sales are up. Excluding autos and gas, retail sales were up only 0.4%. Not quite as rosy. But the retail sales are not a recipe for a 50 bp cut. So, 25 bp is still on the table and that is widely expected. It would be a surprise now if they didn’t cut. By the time the interest rate decision comes around in September, we’ll have seen the August job numbers, due out on September 6. Right now, they are forecasting a gain of only 100,000 jobs, suggesting that the economy is slowing.
U.S. and Canada Personal Savings Rate 2014–2024
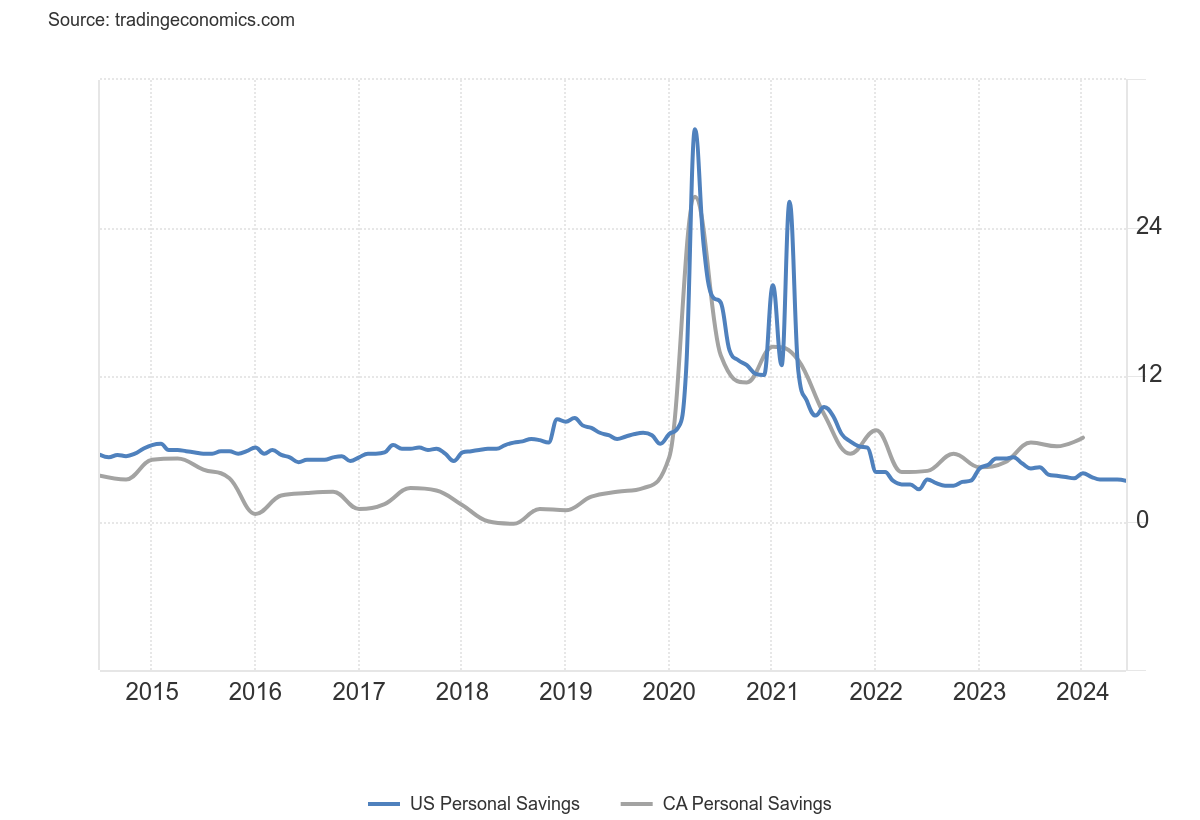
Source: www.tradingeconomics.com, www.bea.gov, www.statcan.gc.ca
With bankruptcies rising and the potential for the job market to be slowing, household savings and debt become a concern. Here, we see both U.S. and Canadian household savings fall. At a savings rate of 3.4% in the U.S. it remains well above levels seen in the early 2000s when it hit a low of 1.4% in 2005. Interestingly enough, that was for the housing crisis, which got underway in 2006 and eventually resulted in the financial crisis of 2008. Canadians appear to be saving better, although that last report was Q1 2024. However, overall, the savings rate is better in Canada.
The other area of concern is household debt. U.S. consumer debt recently hit $25.7 trillion. That’s some 90% of GDP. But officially, according to Trading Economics (www.tradingeconomics.com), the U.S. household debt to GDP is currently only 72.9%, which is actually well down from highs seen in 2007 when it hit 98.7%. Canada’s household debt, however, is one of the highest in the world, currently at 102.5%. But even that is down from its high of 112.6% seen in 2020. Despite its huge overall debt, Japan’s consumers are not the most indebted, with a ratio of 66.2%, down from a peak of 71% seen way back in 1999. Not shown is the eurozone where the ratio is 53.7%, also down from its peak in 2009 at 64.4%. Canada’s is the third highest in the world, behind only Switzerland (128%) and Australia (110%). The worry is always about government debt. More concern should be shown for household debt and even corporate debt which also remains high.
Household Debt to GDP for the U.S., Canada and Japan 2014–2024
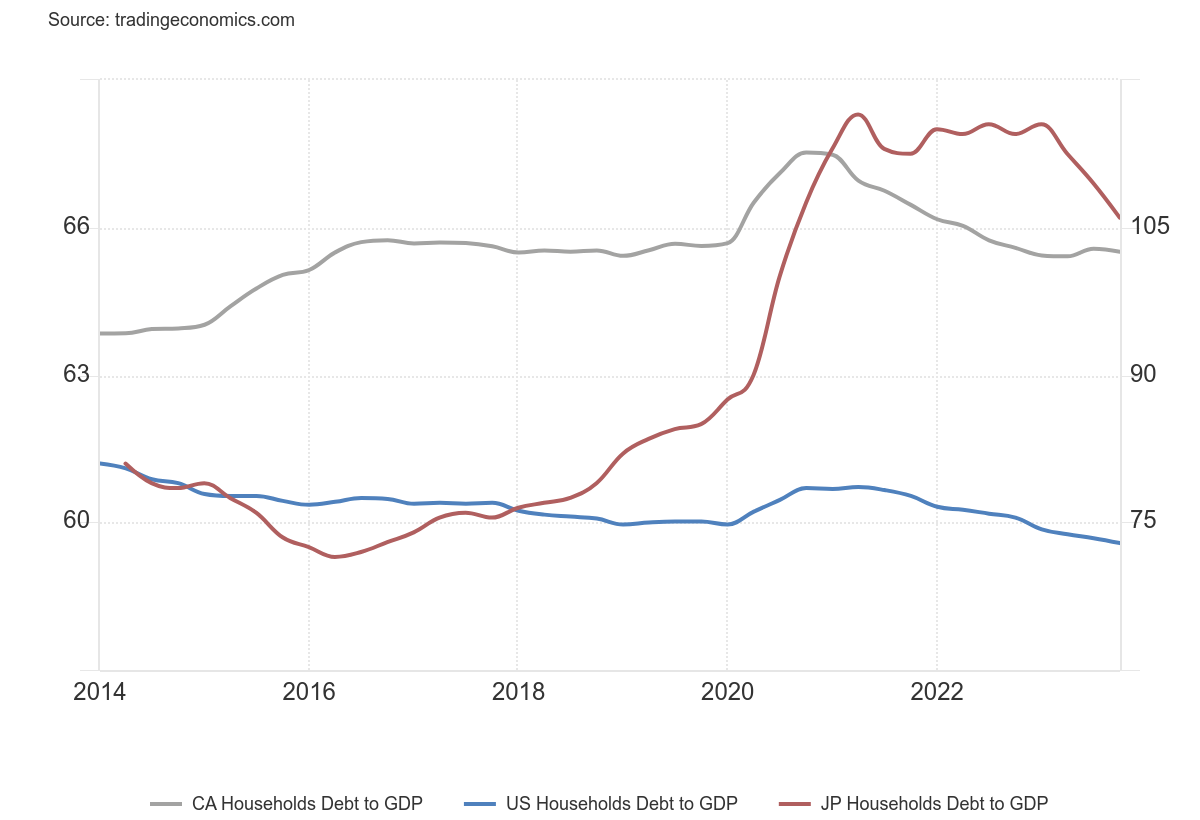
Source: www.tradingeconomics.com, www.bis.org, www.statcan.gc.ca,
In making its interest rate decision, the Fed has numerous factors to consider. Falling inflation may be the least of their worries, especially if the labour market weakens further. However, there has to be some concern over the low savings rate and household debt to GDP.
What the Fed needs to avoid is any knee-jerk reaction to cutting rates, even if the labor market slows. It was cutting interest rates to zero and unleashing billions (trillions?) in liquidity after the pandemic crisis in 2020 that helped spark a strong stock market rally and gold rally and sent housing prices soaring. The asset inflation also unleashed price inflation as supply disruptions grew and extreme weather events soared. Besides the widely expected rate cut in September, they are also expecting the Fed to cut three times in 2024, September as well as November and December.
But will rate cuts spark another stock market bubble? Or send bond yields sharply lower? Lower interest rates are often a precursor to a stock market rally. Since 2000 (and even before that), the lowering of the Fed rate triggered a stock market rally. Bond yields also fell, but usually started rising again as the stock market went higher. 2020 was the nadir for bond yields, which started rising once again with the unleashing of billions in liquidity. The re-emergence of inflation sent bond yields even higher. Not shown is gold which also rose sharply following each Fed cut and fall in bond yields. Could it happen again? Given that there is no real crisis at this time, unlike the dot.com crash in 2001–2002, the financial crisis in 2008, and the 2020 pandemic, it remains a possibility that it could unleash yet another sharp rise in asset prices. But will it?
Effective Fed Funds, S&P 500, and U.S. 10-year Note 2000–2024
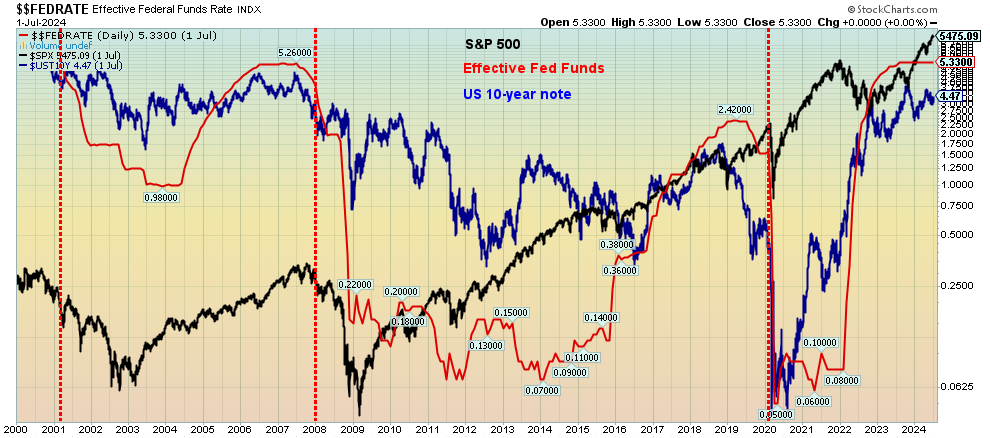
Source: www.stockcharts.com
Chart of the Week
Source: www.stockcharts.com
Onward and upward. That’s the TSX Consumer Staples (TCS) Index. It’s just not considered the sexy sector to be involved in. The focus is always on technology, financials, and materials (gold, metals, agriculture). But the TCS has been a stellar performer now for 16 years since the 2008 financial crisis. The monthly chart above still shows no sign of a top. A look at the S&P Consumer Staples Sector Index shows the same: a steady rise that shows no topping signs.
So, what is driving this? Quite simply, it is extreme weather events. Secondary reasons include supply chain disruptions and geopolitical conflicts. But extreme weather events lead the way. Wildfires, heat waves, flooding, droughts. These events are becoming more frequent and more intense. Add in supply chain disruptions and geopolitical conflicts, particularly the Russia/Ukraine war, and supplies are cut further. Both Russia (number 3 producer, number 5 exporter, number 4 consumer of wheat) and Ukraine (number 10 producer, number 7 exporter of wheat) are important cogs not just for wheat but for a bevy of agriculture products. With both countries disrupted, either by the war or sanctions, it has cut into global supplies.
China and India are the world’s largest producers of wheat. Both rank high for consumption as, according to statistics, they are number one and three with the European Union ranking number 2. Neither are large exporters as they consume most of what they produce. The largest exporter of wheat is Australia, followed by the U.S. and France. Canada is number 4 in exports, and number 6 in production. Given all that, it becomes easy to understand how extreme weather events are causing havoc globally, which in turn is pushing up the cost of food at the table and also contributing to famines.
Famines today are seen in Afghanistan, Sudan, Syria, Yemen, and Gaza. War is at the center of all of these famines. Severe droughts plague both Northern Africa and Southern Africa. But droughts also plague parts of Asia, North and South America, Australia, and Europe. The combination of heat waves and droughts contributes to the spread of wildfires. And in the end, it all comes back to the cost of food at the table.
No wonder then that the consumer staples sector has been one of the best-performing sectors anywhere. And the chart still sees no signs of topping action, suggesting that it can go higher despite periodic pullbacks. With a monthly RSI over 70, one could see a corrective at any time. But it would most likely be a buying opportunity. Top Canadian companies in the TCS are Alimentation Couche Tard, Loblaw Companies, George Weston, Metro, and Saputo. The sector is a safe haven during recessionary periods.
The index is up over 600% since lows in 2002 and 2008 and has doubled since the pandemic low in 2020. There is no sign of a top, suggesting we could move higher still.
Rest of page is blank
Markets & Trends
|
|
|
|
% Gains (Losses) |
|
||||
|
|
Close Dec 31/23 |
Close Aug 16, 2024 |
Week |
YTD |
Daily (Short Term) |
Weekly (Intermediate) |
Monthly (Long Term) |
|
|
Stock Market Indices |
|
|
|
|
|
|
|
|
|
S&P 500 |
4,769.83 |
5,554.25 |
3.9% |
16.5% |
up |
up |
up |
|
|
Dow Jones Industrials |
37,689.54 |
40,659.76 |
2.9% |
7.9% |
up |
up |
up |
|
|
Dow Jones Transport |
15,898.85 |
15,672.77 |
2.2% |
(1.4)% |
up (weak) |
up |
up |
|
|
NASDAQ |
15,011.35 |
17,361.72 |
3.7% |
15.7% |
neutral |
up |
up |
|
|
S&P/TSX Composite |
20,958.54 |
23,054.61 |
3.3% |
10.0% |
up |
up |
up |
|
|
S&P/TSX Venture (CDNX) |
552.90 |
566.41 |
5.4% |
2.4% |
down (weak) |
down |
down |
|
|
S&P 600 (small) |
1,318.26 |
1,370.44 |
2.6% |
4.0% |
up (weak) |
up |
up |
|
|
MSCI World |
2,260.96 |
2,369.98 |
3.7% |
4.8% |
up (weak) |
neutral |
up |
|
|
Bitcoin |
41,987.29 |
59,646.86 |
(1.7)% |
42.1% |
down |
neutral |
up |
|
|
|
|
|
|
|
|
|
|
|
|
Gold Mining Stock Indices |
|
|
|
|
|
|
|
|
|
Gold Bugs Index (HUI) |
243.31 |
312.09 |
8.7% |
28.3% |
up |
up |
up |
|
|
TSX Gold Index (TGD) |
284.56 |
365.63 |
7.2% |
28.5% |
up |
up |
up |
|
|
|
|
|
|
|
|
|
|
|
|
% |
|
|
|
|
|
|
|
|
|
U.S. 10-Year Treasury Bond yield |
3.87% |
3.89% |
(1.3)% |
0.5% |
|
|
|
|
|
Cdn. 10-Year Bond CGB yield |
3.11% |
3.09% |
(1.6)% |
(0.6)% |
|
|
|
|
|
Recession Watch Spreads |
|
|
|
|
|
|
|
|
|
U.S. 2-year 10-year Treasury spread |
(0.38)% |
(0.17)% |
(41.7)% |
55.3% |
|
|
|
|
|
Cdn 2-year 10-year CGB spread |
(0.78)% |
(0.25)% |
(8.7)% |
68.0% |
|
|
|
|
|
|
|
|
|
|
|
|
|
|
|
Currencies |
|
|
|
|
|
|
|
|
|
US$ Index |
101.03 |
102.44 |
(0.7)% |
1.4% |
down |
down |
neutral |
|
|
Canadian $ |
75.60 |
73.12 |
0.3% |
(3.3)% |
neutral |
down |
down |
|
|
Euro |
110.36 |
110.24 |
1.0% |
(0.1)% |
up |
up |
neutral |
|
|
Swiss Franc |
118.84 |
115.58 |
(0.2)% |
(2.9)% |
up |
up |
up |
|
|
British Pound |
127.31 |
129.44 |
1.5% |
1.7% |
up |
up |
neutral |
|
|
Japanese Yen |
70.91 |
67.75 |
(0.6)% |
(4.5)% |
up |
up (weak) |
down |
|
|
|
|
|
|
|
|
|
|
|
|
|
|
|
|
|
|
|
|
|
|
Precious Metals |
|
|
|
|
|
|
|
|
|
Gold |
2,071.80 |
2,537.80 (new highs)* |
2.6% |
22.5% |
up |
up |
up |
|
|
Silver |
24.09 |
28.85 |
4.6% |
19.8% |
down (weak) |
up (weak) |
up |
|
|
Platinum |
1,023.20 |
962.40 |
3.5% |
(5.9)% |
down (weak) |
neutral |
down (weak) |
|
|
|
|
|
|
|
|
|
|
|
|
Base Metals |
|
|
|
|
|
|
|
|
|
Palladium |
1,140.20 |
943.60 |
5.3% |
(17.2)% |
neutral |
down |
down |
|
|
Copper |
3.89 |
4.14 |
3.8% |
6.4% |
down (weak) |
down (weak) |
neutral |
|
|
|
|
|
|
|
|
|
|
|
|
Energy |
|
|
|
|
|
|
|
|
|
WTI Oil |
71.70 |
75.54 |
(1.7)% |
5.3% |
down |
neutral |
down (weak) |
|
|
Nat Gas |
2.56 |
2.12 |
(0.9)% |
(17.2)% |
down (weak) |
neutral |
down |
|
Source: www.stockcharts.com
Note: For an explanation of the trends, see the glossary at the end of this article.
New highs/lows refer to new 52-week highs/lows and, in some cases, all-time highs.
- * New All-Time Highs
Source: www.stockcharts.com
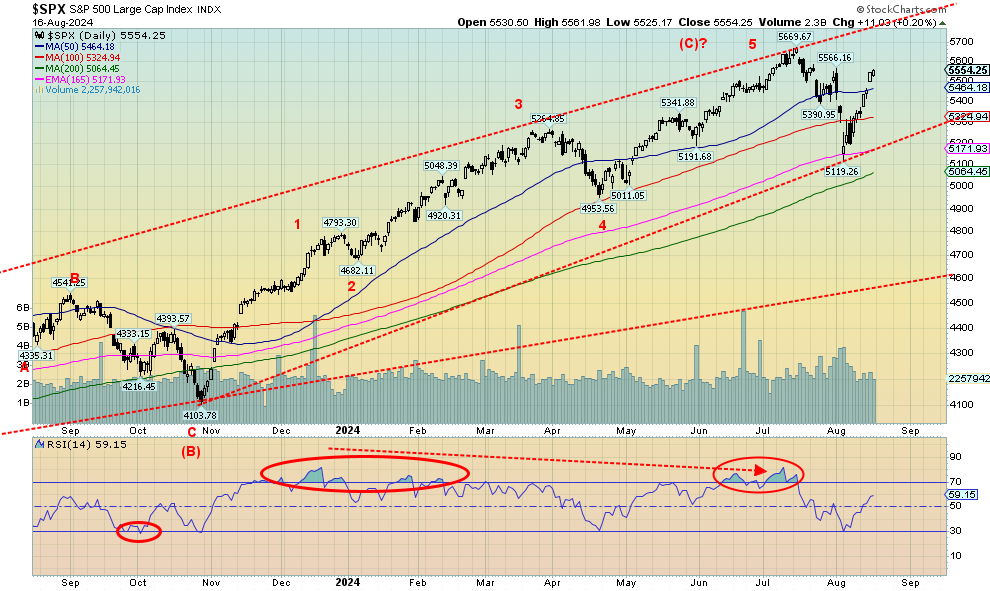
With the strong rebound after the unravelling of the yen carry trade and the volatile markets of only a couple weeks ago, we see pundits calling once again for new all-time highs. Even the Tokyo Nikkei Dow (TKN) has rebounded. Night and day. It was night and suddenly day again. Rising this fast on reduced volume in a market that is already overvalued by numerous measurements is not a recipe for long-term success. But could we make new highs? The answer is yes.
It was a great week for stocks. The S&P 500 (SPX) was up 3.9%, the Dow Jones Industrials (DJI) rose 2.9%, the Dow Jones Transportations (DJT) jumped 2.2%, and the high-tech dominated NASDAQ rose 3.7%. Even the S&P 500 Equal Weight Index was up, gaining 2.5%. The NY FANG Index gained 6.0%. The S&P 400 (Mid) was up 2.6% while the S&P 600 (Small) gained 2.6%.
In Canada, the TSX Composite was up 3.3% and the TSX Venture Exchange (CDNX) showed life, gaining 5.4%. In the EU, the London FTSE was up 1.8%, the EuroNext gained 2.7%, the Paris CAC 40 was up 2.5%, while the German DAX gained 3.4%. In Asia, China’s Shanghai Index (SSEC) gained 0.6%, the Tokyo Nikkei Dow (TKN) rebounded strongly, up 8.7%, while Hong Kong’s Hang Seng (HSI) was up 3.0%. Even the MSCI World Index was up 3.7%. If anyone faltered it was Bitcoin, losing 1.7% and closing under $60,000. Golds and Energy also enjoyed a banner week. Happy days are here again, it seems.
We are just bothered by the reduced volume and the overvaluation of the market. No, the pullback was insufficient to bring the market back to fair value. Most indicators we follow still look negative, and divergences abound. We are moving into the worst period of the year from August through October, with the low coming in October or even November, occasionally December. The S&P 500 PE ratio is 29 vs. a long-term median of 15. The S&P Shiller PE ratio is 35.8 vs. a long-term median of 16. So, by many measurements, the stock market is overvalued and does sometimes come back to normal. In early 2009, at the height of the financial crisis, the Shiller PE ratio fell to 14. It didn’t even get back to the median during the pandemic crash, bottoming out at 27. At the height of the Great Depression and the major 1980–1982 recession it fell to almost 6. So, while many were jumping from windows, the smart money was buying. Maximum fear usually equals maximum buying opportunity.
We wouldn’t want to see a break back under 5,450. But the reality now is, we need to break under 5,100 to tell us this market is in trouble. Otherwise, we can’t rule out new all-time highs. Already the market is suggesting new highs ahead taking out 5,540 (close was 5,554). But, as we’ve seen many times before, will everyone make new all-time highs or merely select indices? The divergences warn us of danger ahead.
Rest of page is blank
Source: www.stockcharts.com
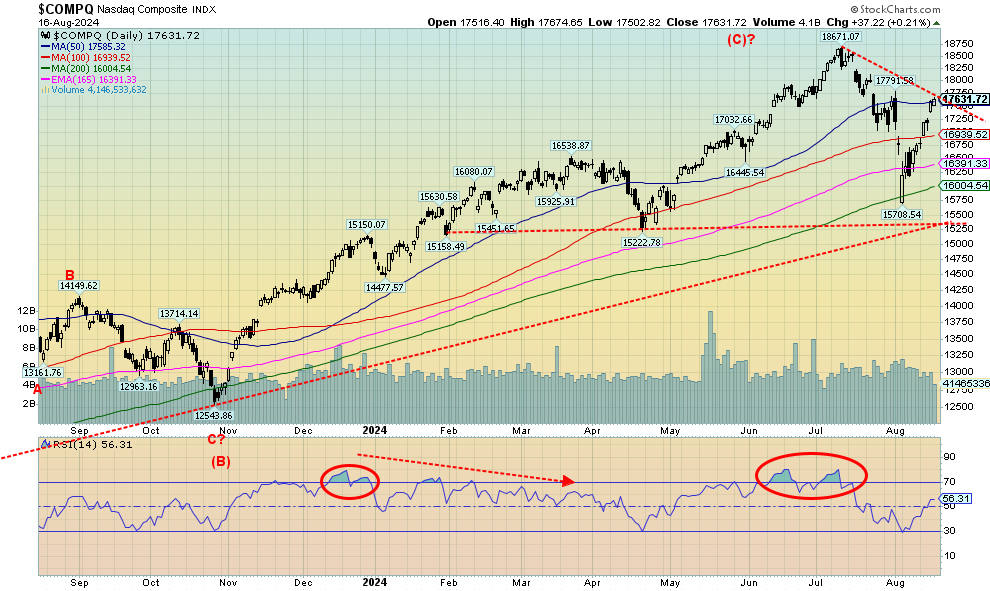
The NASDAQ appears poised for a breakout that could take it to new all-time highs. A move above 17,585 is positive. Above 17,700 our breakout could be on its way. Above 17,970 new highs are probable. The NASDAQ gained 3.7% this past week, helped by the Magnificent Seven. The NY FANG Index rose 6.0%. Leading the way was Tesla, up 8.1%, followed by Netflix, up 6.4%, and Amazon, up 6.1%. The biggest gainer of the week was Nvidia, up 18.9%. AMD was up 10.6% and Broadcom gained 11.8%. A great week for the Mag7 and that saved the day. So, is this move for real? Like others, volume has tailed off so while we are rising, we’d be using it to lighten up, take profits, etc. The RSI is only 56.3 so it does have considerable room to move higher. A breakdown now under 17,000 would be a negative sign. The recent low was 15,708 and if that breaks, we are headed sharply lower.
Source: www.stockcharts.com
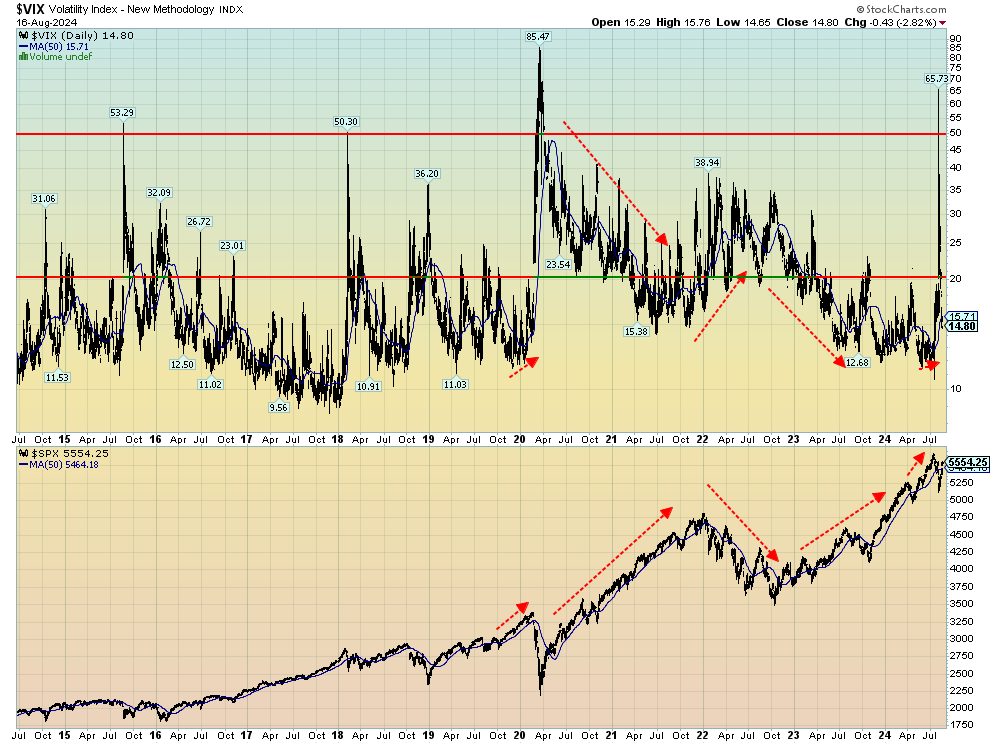
From 65 to 14.8 just like that. That’s the VIX Volatility Index that spiked to 65.7 during the unraveling of the yen carry trade to just 14.8 today. It went from very volatile to who cares. We are under 20, a level usually associated with complacency. From fear to complacency, just like that. Something is amiss.
Source: www.stockcharts.com
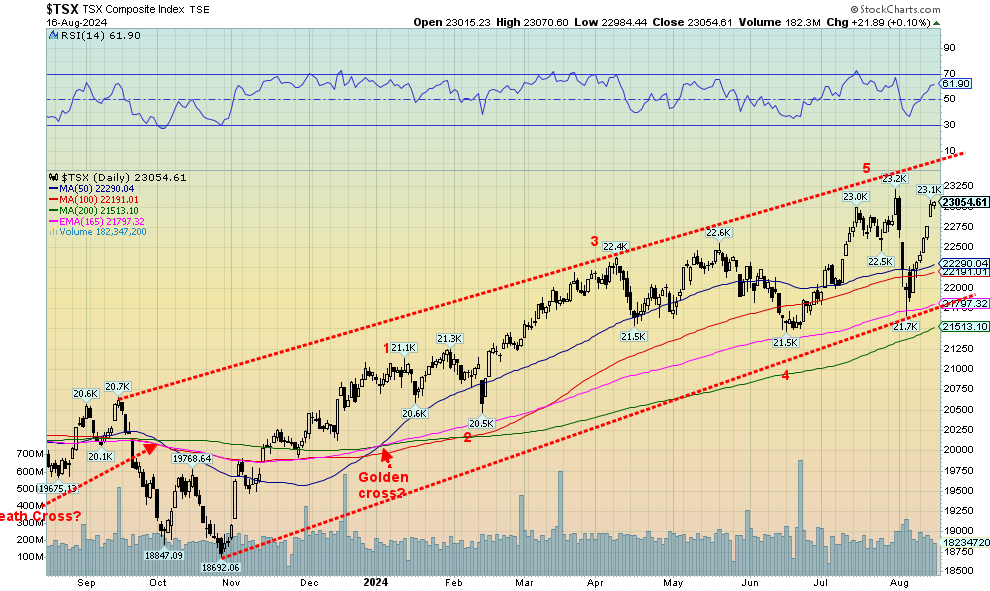
The TSX enjoyed a solid up week along with the rest of market, gaining 3.3%. The TSX Venture Exchange showed some life, up 5.4%, and has once again turned positive on the year by 2.4%. Only one of the 14 sub-indices lost this past week and that was Telecommunications (TTS), down 1.3%. The big leader was Golds (TGD), up 7.2%, followed by Materials (TMT), up 6.9%. Energy (TEN) gained 5.0% while Real Estate (TRE) was up 4.8%. Following the breakdown a couple of weeks ago, the TSX has recovered nicely and is now close to making new all-time highs once again. The top of that channel is up around 23,500. The biggest potential glitch we notice is that this rebound rally is happening on reduced volume. That’s not a great sign, regardless of whether it makes new all-time highs or not. At this point, we’d prefer not to see the TSX break down once again under 22,500. That major channel support line is near 21,800 while the 200-day MA is down around 21,500. We believe the real top was seen a couple of weeks ago and this is the rebound rally after the first shakedown even if this run takes us to new all-time highs. With declining volume, we remain suspicious of this rebound. We’d have to get to around 25,500 to convince us that we were indeed on a new leg up.
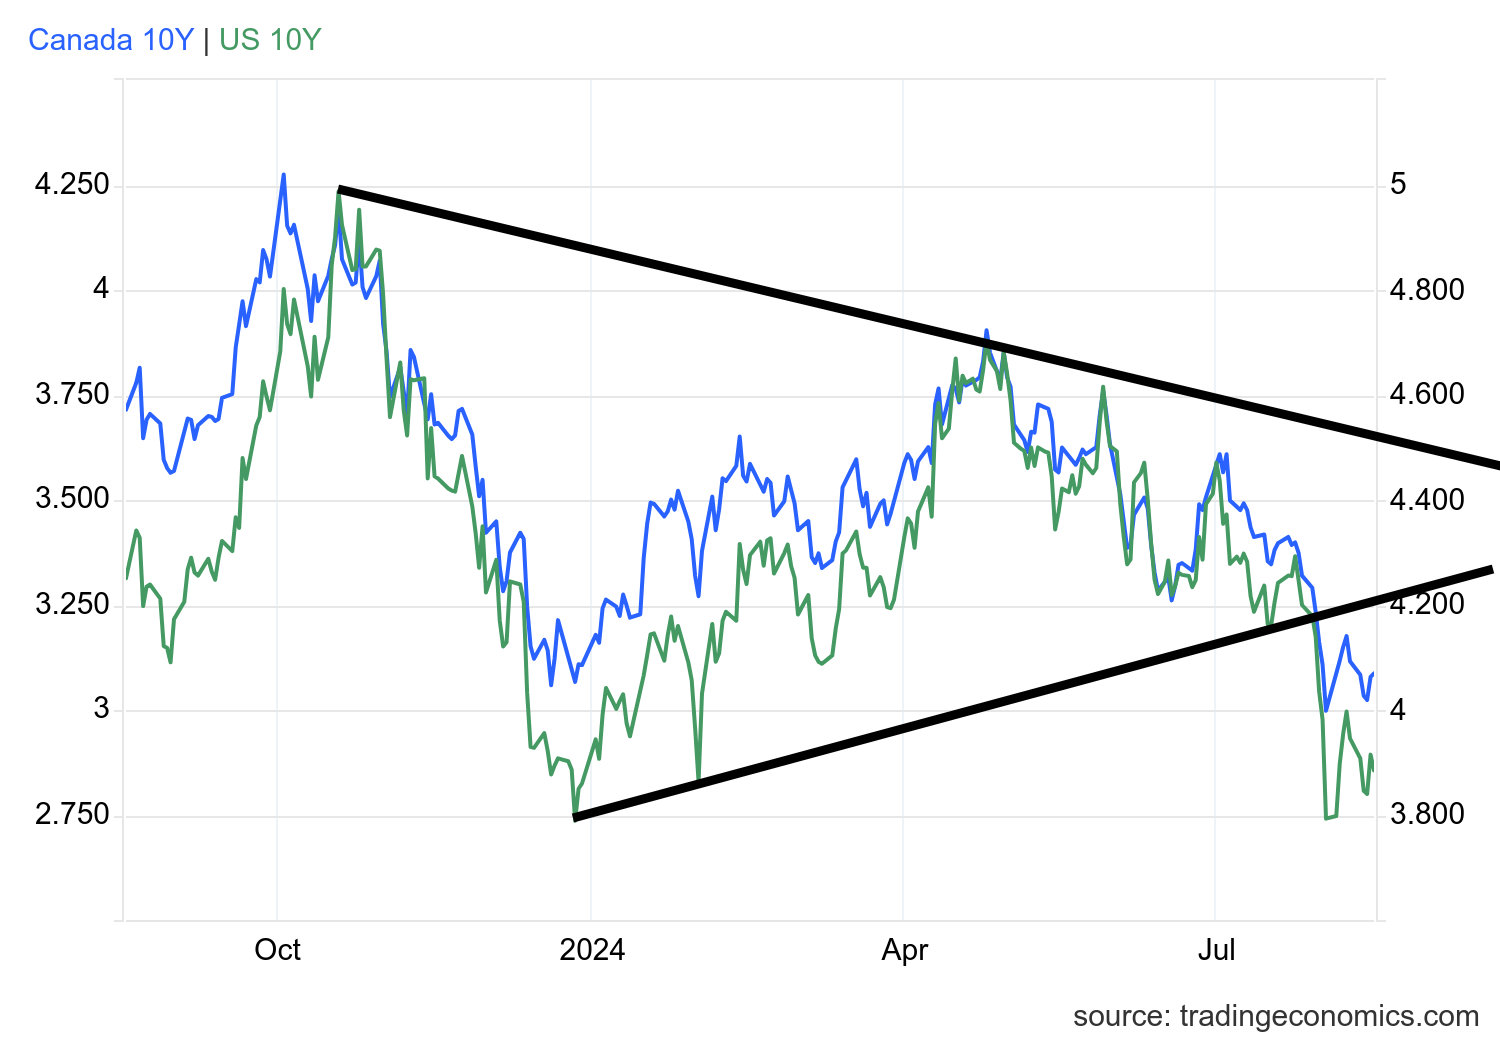
U.S. 10-year Treasury Note, Canada 10-year Bond CGB
Source: www.tradingeconomics.com, www.home.treasury.gov, www.bankofcanada.ca
Talks of a Fed rate cut, coupled with at least mixed signs of a slowing economy, helped push bond yields lower this past week. The U.S. 10-year treasury note fell to 3.89% from 3.94% while the Canadian Government of Canada bond (CGB) fell to 3.09% from 3.14%. So far, the market is excited that we could be falling into either a very mild recession or the proverbial soft landing. Few, it seems, are expecting a hard landing. The 2–10 spreads widened this past week with the U.S. 2–10 out to negative 17 bp, up from negative 12 bp. In Canada, the 2–10 widened to negative 25 bp from negative 23 bp. Recession? What recession?
We’ve already noted the CPI and retail sales. Other numbers out this past week showed that weekly claims actually fell to 227,000, down from 234,000 and well below expectations of 239,000. But then the Philly Fed came in at negative 7, well below the expected printing of +11 and last month’s +13.9. The NY Empire State Index was negative 4.7, slightly better than the expected negative 6. Both are manufacturing indices. Housing starts fell 6.8% last month below the expected decline of 2%. The Michigan Sentiment Index was a bit better at 67.8, above the expected 66, and the last reading of 66.4. So, mixed numbers with some better and others worse, all so far pointing to the proverbial soft landing. A breakdown now under 3.80% could point to further declines for the U.S. 10-year. Falling bond yields are also good for the stock market and gold.
Source: www.stockcharts.com
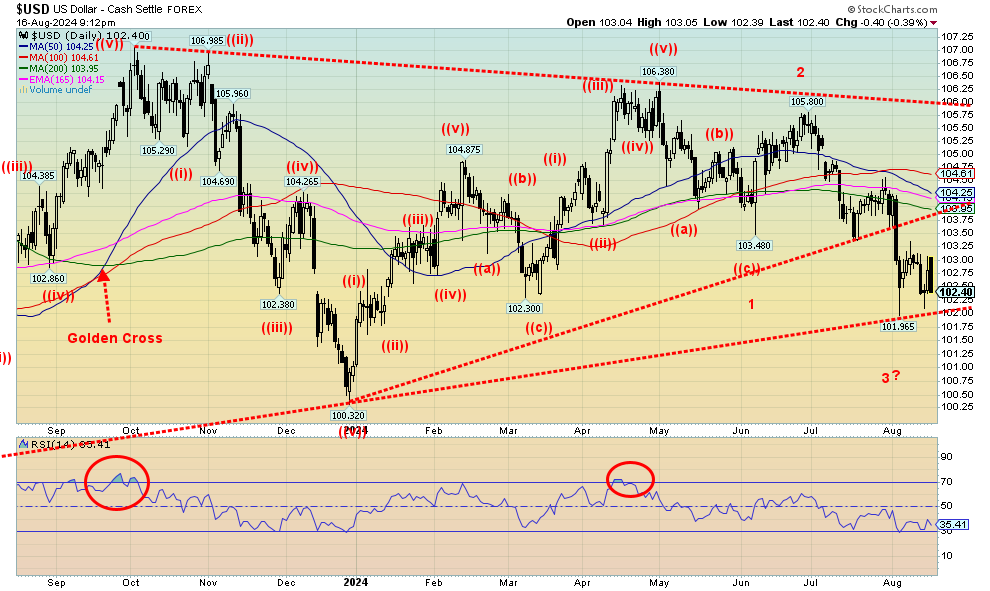
The US$ may be the world’s reserve currency, but right now it is looking like a wobbly reserve currency. This past week the US$ Index fell 0.7%. Doesn’t seem like much, but now it is down almost 11% from the September 2022 high and down 38% from its all-time high set in 1985. Rather than a collapse, it is more like a steady erosion. On the week, the euro was up 1%, the Swiss franc fell about 0.2%, the pound sterling gained 1.5%, while the Japanese yen slipped 0.6%. The Cdn$ gained 0.3%. Those are the prime currencies the U.S. dollar is measured against and all are a part of the US$ Index. The Swedish krona is the only other component but represents only 4.2% of the index. The euro is the largest at 57.6% while the Swiss franc is the lowest at 3.6%. The US$ Index is not to be confused with the U.S. Trade Weighted Index which would include the Chinese yuan, the Indian rupee, and even the Russian ruble.
The breakdown zone is near 102 and we are getting close. That doesn’t preclude another bounce. Below 101.75, new lows below the December 2023 low of 100.23 are highly probable. We’d have to regain at least 104 to suggest a low is in. Above 105 we’d break out.
Source: www.stockcharts.com
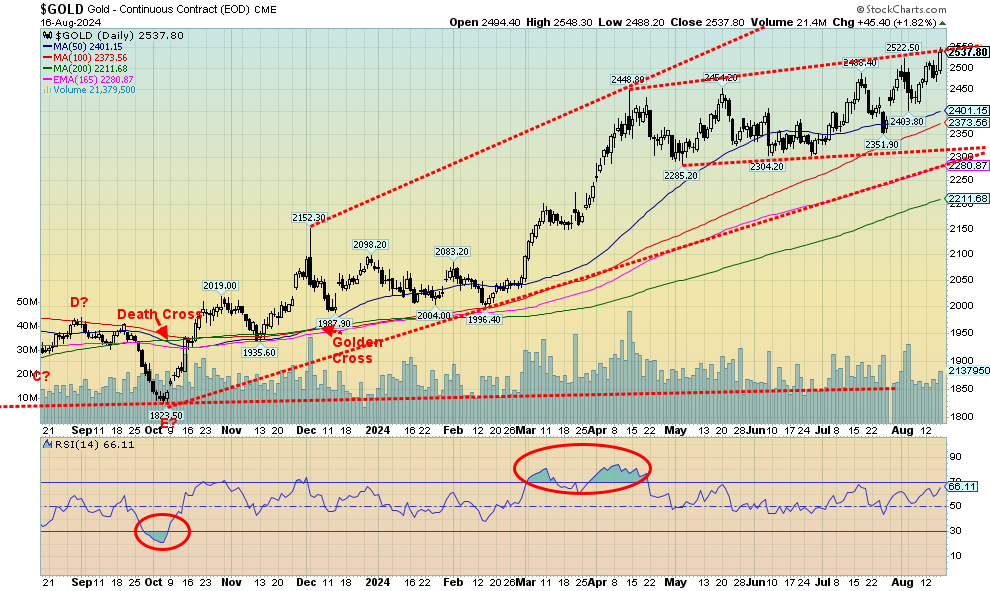
Driven by geopolitical concerns, constant central bank buying, talks of rate cuts, and falling bond yields, gold once again soared to new all-time highs, closing at $2,537.80 for the front futures. It was good news/bad news as gold made new all-time highs in U.S. dollars, but still fell short in Canadian dollars, euros, pound sterling, Swiss francs, and Japanese yen. But all are close and could see that this coming week. If it’s making new highs in U.S. dollars, the others usually follow. Gold acts as a hedge against currency devaluation. Central banks purchasing gold may indicate a lack of confidence in the U.S. dollar as the world’s reserve currency. No, that will not end tomorrow but it is under pressure. One central bank not purchasing gold is the BofC. The BofC sold all its gold in 2016, somehow believing holding U.S. securities was better. Not surprisingly, gold has been making new all-time highs in Cdn$ as well. The Cdn$ has been weak but remains well above its all-time low of 61.86 seen in 2002. But the high of 110 in 2008 seems a long way off. Currently, it is 73.10.
Central bank holdings of gold have gone up, such that nearly an ounce of every 10 ounces produced is bought by central banks. Russia and China lead the way, but India and Turkey are also increasing their holdings. The world’s official gold holdings are 36,089 metric tonnes in May 2024. That’s sizable, given that the total amount of gold mined is estimated at 212,582 metric tonnes. The central bank’s holdings are almost 17% of that. Foreign holdings of U.S. treasuries are up $11 billion over the past year to June 2024, but China’s holdings have fallen $56 billion as they slowly sell off their holdings. Others have picked up the slack.
On the week, gold rose 2.6%, silver led up 4.6%, and platinum showed some life, up 3.5%, but is still down 5.9% on the year. Of the near precious metals, palladium gained 5.3% while copper was up 3.8%. The gold stocks enjoyed a strong week with the Gold Bugs Index (HUI) up 8.7% and the TSX Gold Index (TGD) up 7.2%. Stocks leading is quite positive. We’d be concerned if they suddenly started to lag.
Besides geopolitical concerns (Russia/Ukraine, Israel, and the Middle East, U.S./China) and central bank buying, gold is responding to potential Fed cuts and reacting to a still growing U.S. economy. Note that gold rises with the stock market, but when the stock market falls gold does not fall as much. A wild card is the U.S. election that could erupt into chaos if results are not accepted after the November 5 election.
Many are saying that gold is in a stealth bull market. The airwaves are still dominated by the Magnificent Seven and other stocks, but some are beginning to recognize gold. If that shifts, gold could make even further upward moves. Suddenly, gold at $3,000 doesn’t seem that far away.
It looks like we have a rising triangle, but we need to firmly break above $2,550 to confirm it. Minimum targets could be $2,700. And while the gold stocks have enjoyed a strong year so far, recognition from the broader market could truly ignite it higher. It is, after all, a small market with an estimated market cap of only $300 billion, according to some. Tops, it may be $500 billion. Apple is $3.4 trillion, Visa is $522 billion, while Coca Cola is about $300 billion. It is a pretty small market. No wonder it is described as trying to push the contents behind the Hoover Dam through a garden hose. All the gold in the world is worth roughly $16.8 trillion. That’s about the same value as Apple, Microsoft, Nvidia, Google, Amazon, Saudi Aramco, and Meta combined. Just a shift of less than 1% from the broader market to the gold market could send it soaring.
Source: www.stockcharts.com
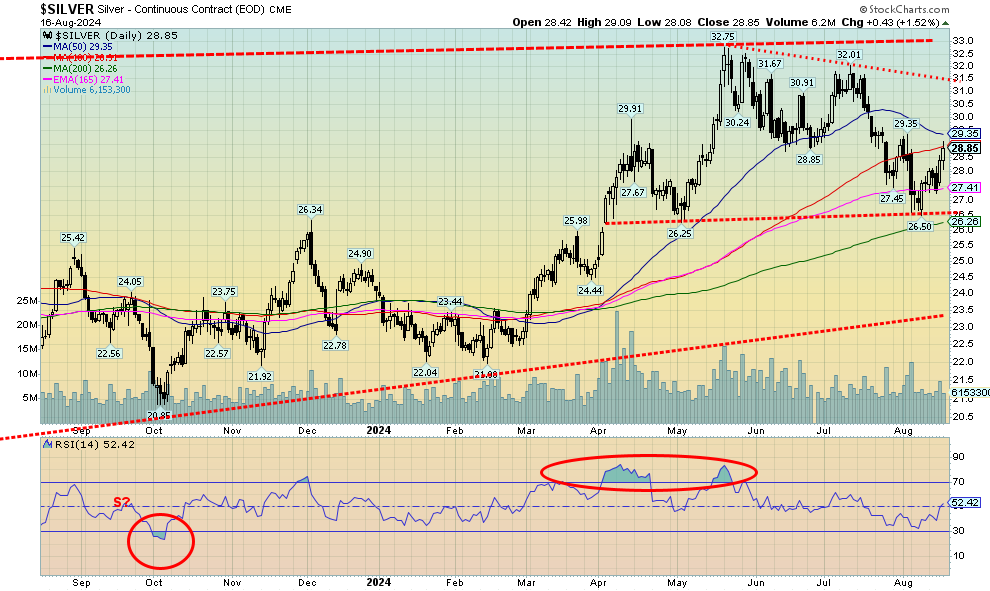
Finally, silver is showing some leadership. Silver tends to lead in both up and down markets. The trouble is, silver hasn’t been leading the recent rise. It’s still lagging. In the year, silver is up 19.8% but gold is up 22.5%. This past week silver came to life as it gained 4.6% to gold’s record-breaking rise up 2.6%. We’ll take our wins when we get them. We need silver leading every week, even on pullbacks, by not falling as much as gold. The gold/silver ratio is still a lofty 88%, but at least that’s down from a high of 92.2% seen on August 14. However, it’s a long way from breaking down over a multi-year top. We need the ratio to break under 72/74% to see that. Silver lags behind gold almost everywhere. Gold sets new all-time highs. Silver is nowhere near its all-time high seen in highs in 1980 and 2011 near $50. Today we’d have to get to $190 to equal the 1980 high on an inflation-adjusted basis and $70 for the 2011 high. Some believe it will happen. Right now, we see few signs. Silver has to break above $30.70 to suggest new highs above $32, preferably above $31.50. Even today at $28.85 it seems far away. But at least not impossible. A breakback under $27.50 would be negative and a breakdown under $26 fatal.
Source: www.stockcharts.com
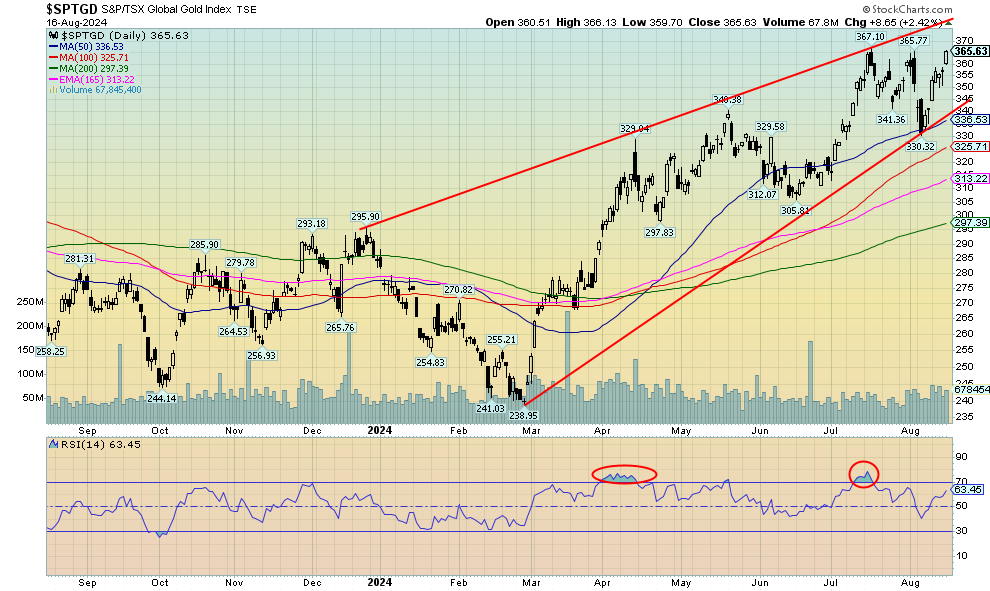
With gold prices making record highs and silver enjoying a strong up week, the gold stocks had a very good week, falling just short of new 52-week highs. That should occur early this coming week, unless… Technically, we look like we could be making a triple top, but then triple tops are a rare event. The TSX Gold Index (TGD) was the top performer for the TSX this past week, gaining 7.2%. The Gold Bugs Index (HUI) did even better, up 8.7%. On the year, the two have been stellar with the TGD up 28.5% and the HUI up 28.3%. Yet, oddly, the sector remains cheap and under-owned. The recent decline for the TGD saw it hit down to the 50-day MA near 336 before rebounding strongly. The top of that channel is up near 375/380 so it could be an initial target. The RSI is still at a manageable 63.5, so it is not as yet overbought. Naturally, if we were to fall below 345 again, we’d be concerned. Below 335 a bigger drop could get underway. We have emphasized that, while gold stocks have been in a good bull market, pullbacks of 10% or more are not uncommon. New highs above 367 would be positive. A reminder we are still well below the all-time high of 455 seen in 2011. The HUI is even worse. At 312 it is more than a double away from its all-time high of 639, also seen in 2011. Such is the nature of gold stocks.
Source: www.stockcharts.com
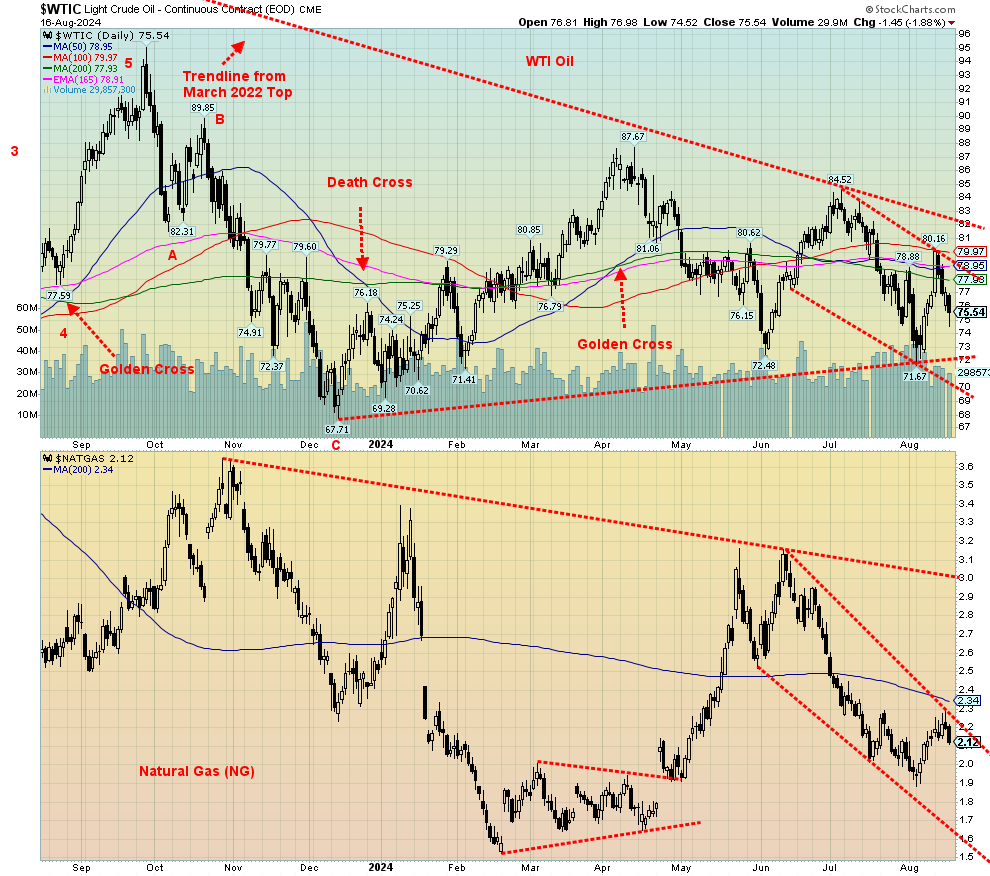
It was a bit of a round-trip week for oil prices. First, they shot up sharply on fears of Iranian retaliation and the incursion of Ukraine into Russia. That was Monday. Then oil prices spent the next four days falling as fears of an Iranian retaliation eased, thanks to ongoing discussions involving Qatar. While the Ukrainian incursion into the Russian Kursk region was ongoing, it was not expected to cause any major disruptions that weren’t already present. Add in weakening demand from China, the world’s largest consumer, and you had the recipe for the decline. By week’s end, WTI oil had slipped 1.7% while Brent crude managed to end the week flat.
Natural gas (NG) also fell. NG at the Henry Hub was off 0.9% while the EU NG at the Dutch Hub fell 1.6%. The easing of global tensions, cooler weather, and high storage levels despite any recent withdrawals all helped to push NG prices lower. The stocks, however, seemed to ignore it all as the ARCA Oil & Gas Index (XOI) rose 1.1% while the TSX Energy Index (TEN) did even better, up 5.0%. WTI rising to $80 helped, but Tourmaline Oil (TOU/TO) also helped as it was up over 8% on the week, after the purchase of Crew Energy. Crew jumped almost 83%. The market viewed it quite positively. It was an all-stock deal and Tourmaline paid a 72% premium to Crew’s previous closing price.
We had noted that $80 was resistance, so WTI’s failure at $80 shouldn’t have been a surprise. Obviously, if we are to go higher, we must take out $80 and more importantly take out $82. WTI appears to have formed a nice downward channel. Support is down to $72. The good news is we’ll soon be moving into the best period for both oil and gas, although for the most part that may not get underway until December. Geopolitical tensions should continue to play an important role in oil prices as it is a situation that could explode at any time. Or just wither and die until another day.
Copyright David Chapman 2024
|
GLOSSARY Trends Daily – Short-term trend (For swing traders) Weekly – Intermediate-term trend (For long-term trend followers) Monthly – Long-term secular trend (For long-term trend followers) Up – The trend is up. Down – The trend is down Neutral – Indicators are mostly neutral. A trend change might be in the offing. Weak – The trend is still up or down but it is weakening. It is also a sign that the trend might change. Topping – Indicators are suggesting that while the trend remains up there are considerable signs that suggest that the market is topping. Bottoming – Indicators are suggesting that while the trend is down there are considerable signs that suggest that the market is bottoming. Disclaimer David Chapman is not a registered advisory service and is not an exempt market dealer (EMD) nor a licensed financial advisor. He does not and cannot give individualised market advice. David Chapman has worked in the financial industry for over 40 years including large financial corporations, banks, and investment dealers. The information in this newsletter is intended only for informational and educational purposes. It should not be construed as an offer, a solicitation of an offer or sale of any security. Every effort is made to provide accurate and complete information. However, we cannot guarantee that there will be no errors. We make no claims, promises or guarantees about the accuracy, completeness, or adequacy of the contents of this commentary and expressly disclaim liability for errors and omissions in the contents of this commentary. David Chapman will always use his best efforts to ensure the accuracy and timeliness of all information. The reader assumes all risk when trading in securities and David Chapman advises consulting a licensed professional financial advisor or portfolio manager such as Enriched Investing Incorporated before proceeding with any trade or idea presented in this newsletter. David Chapman may own shares in companies mentioned in this newsletter. Before making an investment, prospective investors should review each security’s offering documents which summarize the objectives, fees, expenses and associated risks. David Chapman shares his ideas and opinions for informational and educational purposes only and expects the reader to perform due diligence before considering a position in any security. That includes consulting with your own licensed professional financial advisor such as Enriched Investing Incorporated. Performance is not guaranteed, values change frequently, and past performance may not be repeated. |
About the author


Website: https://www.enrichedinvesting.com
Disclaimer: David Chapman is not a registered advisory service and is not an exempt market dealer (EMD) nor a licensed financial advisor. We do not and cannot give individualised market advice. David Chapman has worked in the financial industry for over 40 years including large financial corporations, banks, and investment dealers. The information in this newsletter is intended only for informational and educational purposes. It should not be considered a solicitation of an offer or sale of any security. The reader assumes all risk when trading in securities and David Chapman advises consulting a licensed professional financial advisor before proceeding with any trade or idea presented in this newsletter. David Chapman may own shares in companies mentioned in this newsletter. We share our ideas and opinions for informational and educational purposes only and expect the reader to perform due diligence before considering a position in any security. That includes consulting with your own licensed professional financial advisor.