
It was the week of the inflation numbers, another record for gold prices, a shaky stock market, and then the events on the weekend as the Mid-East war rose another notch. On one hand, the events at the past week's end with the Iranian attack on Israel threatens to expand the war; the actual attack was somewhat underwhelming. Some have suggested this is not the big one but merely a test of Israeli defenses. How will gold and oil respond? Shoot higher? Or retrench figuring it wasn't much and if that is all there is then no reason to go higher.
Inflation numbers were stronger than expected. Result the market is less sure about interest rate cuts. If we think the current inflation is bad one should see hyperinflation. We look at hyperinflation and today's inflation is nothing compared to that.
We found and reprinted an interesting chart from Goldman Sachs that highlights the coming commodity boom. It is featured as the chart of the week.
Gold set record prices once again and silver broke out. But at the past week's end, there was a sharp reversal. Is it over? Or just another head fake as we saw earlier? The stock market wobbled and while some small sell signals were seen we don't as yet have a major sell signal. Going forward gold and oil will continue to dominate. For example, Secure Energy Services Inc., a leading waste management and energy infrastructure company, reported an exceptional 2023 year with strong financial performance underscoring core business growth potential and solid discretionary free cash flow, pays a dividend, and is held in the Enriched Capital Conservative Growth Strategy.*
A pretty drizzly past week. Nonetheless, have a great week.
DC
* Reference to the Enriched Capital Conservative Growth Strategy and its investments, celebrating a 6-year history of strong growth, is added by Margaret Samuel, President, CEO and Portfolio Manager of Enriched Investing Incorporated, who can be reached at 416-203-3028 or msamuel@enrichedinvesting.com
“But look at the number of dollars in existence ($3.635 trillion in the M-1 money). Divide that by the 260 million ounces of gold the U.S. Government is supposed to own, and you get a gold price of $13,982/ounce.”
—Doug Casey, American writer, speculator, founder, and chairman of Casey Research, describes himself as an anarcho-capitalist, admirer of Ayn Rand, author of Crisis Investing (1979), publishes a financial newsletter, has a wine and residential sporting estate in Cayfayate, Salta Province, Argentina; b. 1946
Note: today M1 is $17,944 billion, implying that the 260 million ounces of gold the U.S. Government has would mean gold at $69,015
“It is a sobering fact that the prominence of central banks in this century has coincided with a general tendency towards more inflation, not less. [I]f the overriding objective is price stability, we did better with the nineteenth-century gold standard and passive central banks, with currency boards, or even with ‘free banking.’ The truly unique power of a central bank, after all, is the power to create money, and ultimately the power to create is the power to destroy.”
—Paul Volcker, American economist, 12th Chairman of the Federal Reserve 1979–1987, Chair of Presidents Economic Recovery Advisory Board 2009–2011, President Federal Reserve Bank 1975–1979; 1927–2019
“Gold, unlike all other commodities, is a currency…and the major thrust in the demand for gold is not for jewelry. It’s not for anything other than an escape from what is perceived to be a fiat money system, paper money, that seems to be deteriorating.”
—Alan Greenspan, American economist, 13th Chairman of the Federal Reserve 1987–2006, 10th Chairman Council of Economic Advisors 1974–1977, private advisor firm Greenspan Associates LLC; b. 1926
In listening to the current debate about inflation, all we could think of was “inflation, what inflation?” The U.S. inflation rate came in this past week at 3.5% (Canada’s last reported was 2.8%). In listening to politicians vs. economists vs. everyone else, we either have out of control inflation and it’s all the government’s fault (or more likely it’s all the president’s or the prime minister’s fault), or inflation is easing towards our longer-term targets but is still too high, or, how will we meet this month’s rent that keeps going up? We wonder how they would have responded to German hyperinflation in the early 1920s or, more recently, hyperinflation in Zimbabwe where prices doubled every day, in Yugoslavia in the 1990s where it exceeded 50%, or in Hungary after World War II where prices doubled every 15 hours. The pictures of wheelbarrows full of money were not unusual.
German Reichsmark Notes Piled High to the Ceiling, 1923
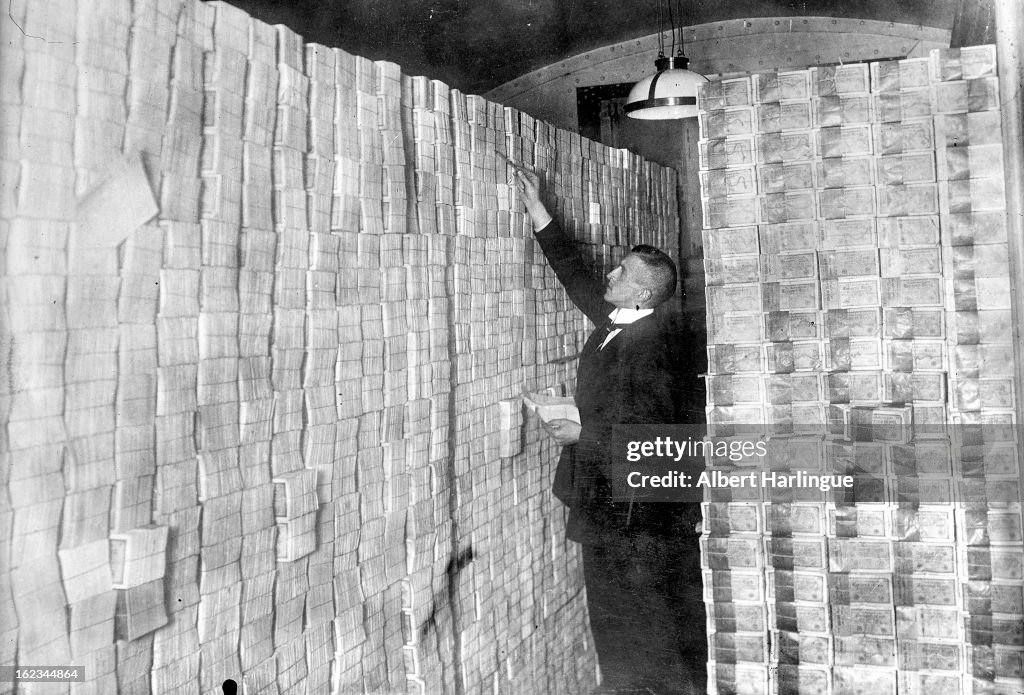
Source: Getty Images, Albert Harlingue, www.gettyimages.ca
It’s all about perspective. And it seems everyone’s perspective is different. We like to keep things simpler and, instead, measure everything in terms of purchasing power in gold. Gold has been around for
centuries, both as money and currency. As money, gold at one time was used for purchases, legal tender. There are only a few jurisdictions today that authorize gold as money, legal tender (12 U.S. states authorize gold and silver as cash). Gold is currency as the market system allows gold prices to fluctuate relative to the price of the U.S. dollar, euros, or Canadian dollars.
Our first chart shows German hyperinflation in 1918–1923, based on how many German marks it took to purchase one gold mark (in 1913, 1 gold mark = 0.35842g). By 1923 it took $1 trillion German marks to purchase one gold mark. In 1918 it was a 1:1 relationship. That’s mind-boggling inflation.
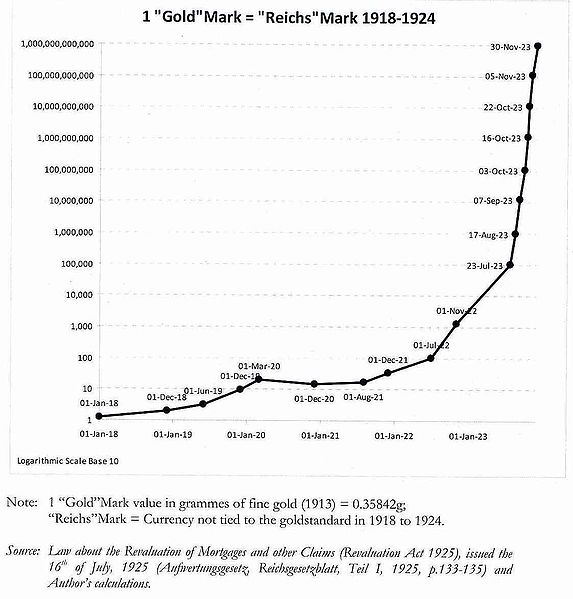
Source: www.wikipedia.org
But is our inflation any better over a period of time? It took roughly five years for the German hyperinflation to really hit. For the U.S. it has taken longer. The real devaluation got underway in 1934 when the U.S. revalued gold up from $20.67 to $35 in order to devalue the U.S. dollar. The U.S. government also carried out gold confiscation. Today, gold trades around $2,350. U.S. $1,000 bought 28.6 ounces of gold in 1971 before the end of the gold standard. Today $1,000 buys only 0.49 ounces. That’s a significant devaluation. Gold doesn’t go up; fiat currencies go down.
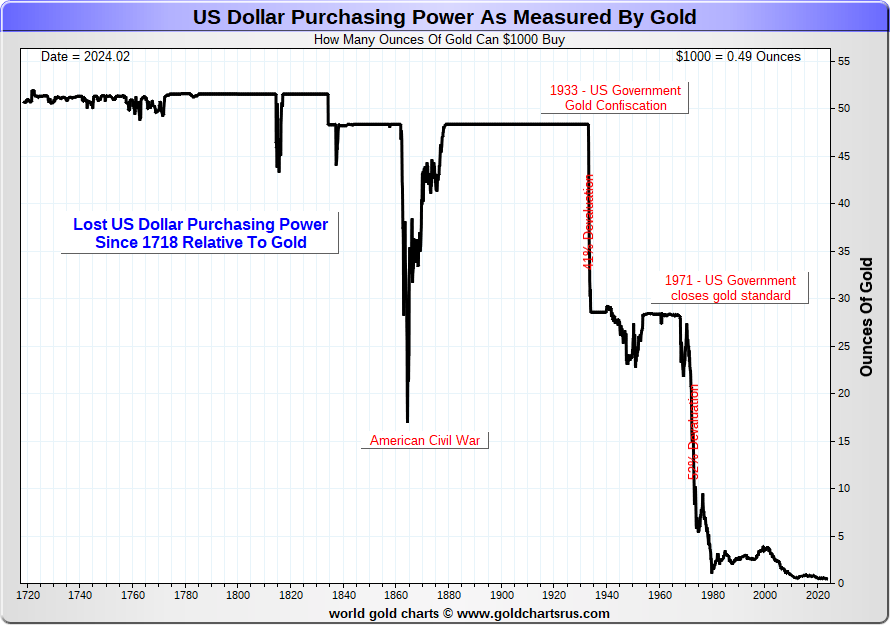
Source: www.goldchartsrus.com
Gold hit a high around $850 in 1980. That level remains the high mark when adjusted for inflation. Today, that would be about $3,220. Today’s gold price adjusted for inflation remains below the 1980 high mark. Similarly, so does silver. Silver hit $50 in 1980 and today would have to hit $189.50 to equal that mark. Devaluation means one needs more and more money to make purchases. What cost you a $1 yesterday costs you $2, $3 maybe more today. In that respect it is no different then the German hyperinflation of yesteryear. It has just taken a lot longer. But the end result is the same.
Compared to the previously mentioned hyperinflation, today’s inflation seems to be pretty tame. The world’s highest inflation experienced today is Argentina, last reported at 276%. Turkey was next at 68.5%. By comparison, the U.S.’s 3.5% and Canada’s 2.8% are paltry. Yet the rise in inflation, coupled with a rise in interest rates in an attempt to bring down the inflation rate, have put a lot of business sectors in trouble, particularly real estate, both commercial and household. Central bank rates in the U.S. and Canada are 5.5% and 5%, both of which are now above the rate of inflation. For comparison, Argentina is at 80% and Turkey at 50%.
Two Billion Reichsmark Banknote issued November 5, 1923
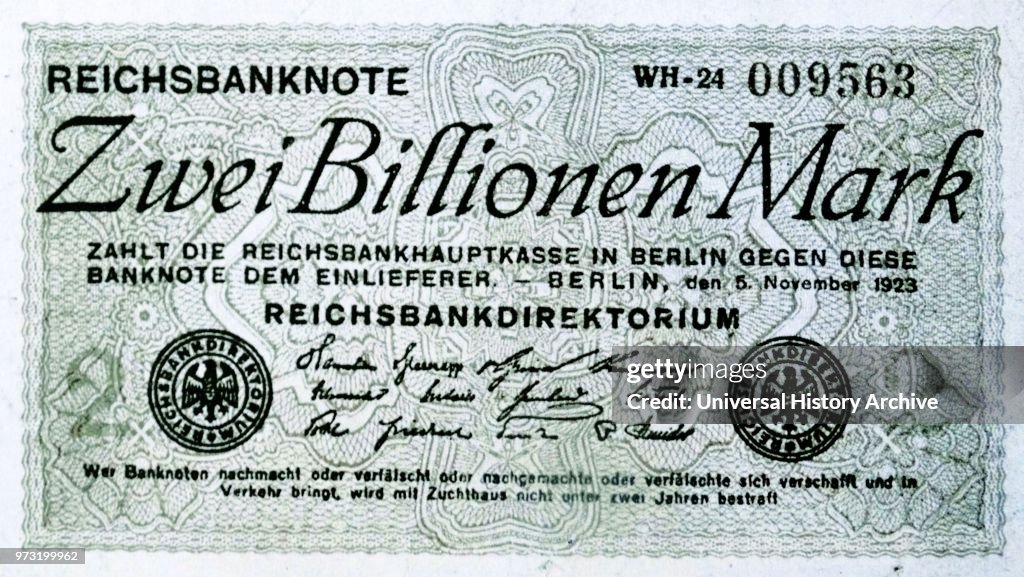
Source: Getty Images, Universal History Archive, www.gettyimages.ca
U.S. Inflation Rate vs. Fed Funds vs. 10-year treasury note 2003–2024
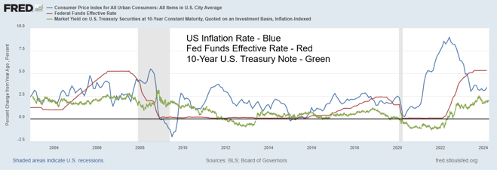
Source: www.stlouisfed.org
Wheelbarrow Full of Money – Zimbabwe

Source: www.reddit.com
For the first time in a while, the Fed Funds rate is actually above the inflation rate. The three-month Treasury bill is 5.37%, well above the rate of inflation at 3.5%. The U.S. 10-year treasury note at 4.59% is also above the current rate of inflation. But is it? Shadow Stats www.shadowstats.com alternative inflation rate is around 10.2%. Shadow Stats removes changes to the calculation of inflation over time stating it as it was calculated back in the 1980s before adjustments were made to effectively depress the headline rate of inflation. By that measurement, interest rates today are still too low.
Nonetheless, today’s interest rates have become stressful for many as for too long interest rates were suppressed and were held below the headline rate of inflation. People expected those low rates to last forever. The result has been that bankruptcies are rising for both business and household as many were ill-prepared for a rise in interest rates.
One big concern is the rise of interest payments on the debt. With interest rates held artificially low for such an extended period due to first the 2008 financial crisis and then the 2020/2021 pandemic while at the same time pumping trillions of dollars into the financial system with quantitative easing (QE), it helped to create financial bubbles, particularly in the stock market and real estate, along with rising inflation, especially given supply disruptions. But adding to inflation woes has been climate change, which has resulted in numerous droughts in agricultural zones and has also sparked a sharp increase in wildfires and floods, depending on where they occurred.
With the massive increase in debt due to the financial crisis and pandemic, interest payments on the U.S. federal debt—that was around $354 billion in 2009, then $565 billion in 2019—are now $1,025 billion. They are expected to exceed $2 trillion annually in just a few years. If that happened, interest payments could exceed what is paid out for Medicare/Medicaid. Already they exceed what is paid out for defense.
The 100 Trillion Banknote Zimbabwe Issued in 2008
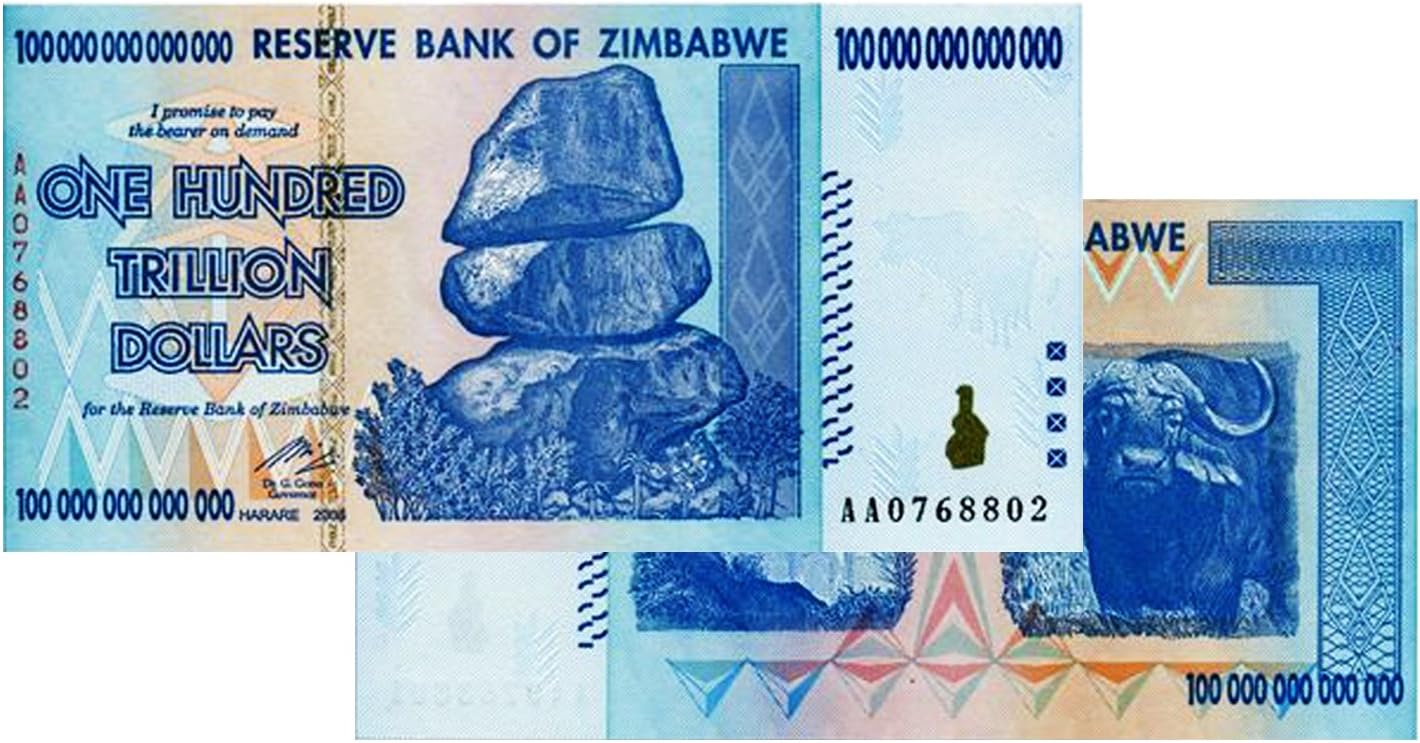
Source: www.amazon.ca – Sold on Amazon as a collectible for $249.99
Interest Payments on the Debt vs. Annual Surplus or (Deficit) ($billions)
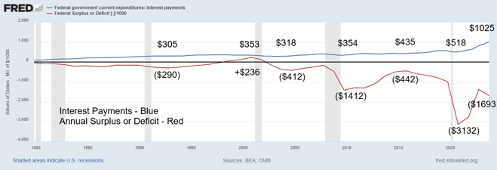
Source: www.stlouisfed.org
With interest payments on the debt growing, the annual deficit has contributed considerably. In 2000 the U.S. National Debt was $5,674.2 billion. Today it is $34,645.1 billion and growing. Annual budget deficits were actually a surplus in 2000 at $236 billion. In 2023 it was a deficit of $1,693 billion. At least that was improvement over the record $3,132 billion deficit seen in 2020, thanks to a combination of the pandemic and massive tax cuts.
Inflation has come down. But has it come down far enough that the Fed and even the Bank of Canada (BofC) would contemplate cutting interest rates? Given the recent inflation numbers, more are thinking that rates could stay higher for longer. Three interest rate cuts have become two interest rates then one interest rate then …………. Interest rates higher for longer. What’s overlooked is that long-dated interest rates are rising, catching many offside as they were convinced that the Fed would cut at least three times in 2024. Will there even be one cut? Rising long-term rates have an impact on mortgage rates.
Despite an economy that continues to show strength, the Fed could continue to have a hard time cutting interest rates. Nonetheless, they also look nervously at the rising delinquencies and bankruptcies for business, the commercial real estate market, and homeowners caught offside with renewing mortgages at much higher rates. But strength in the economy can be illusory. The labour market continues to show strength, even though underneath it’s actually weakening. The Fed, as many have noted, is caught between a rock and hard place. Interest rates are high and are adding substantially to annual interest payments. Meanwhile, deficits have never really come down much. The surplus seen in 2000 is just a faint memory.
Gold, unlike debt and stocks, has no liability. We are seeing a surge in demand for gold with the rise of central bank buying over the past two years. ETFs that had seen withdrawals over the past few years are starting to see funds flow back into them. Hedge funds that had been absent from the gold market are returning. Maybe the best indicator is that Costco has been selling roughly $200 million a month in gold bars. That’s retail buying. As we’ve noted, it won’t take much of shift of funds out of the broader stock market into the gold market to push prices sharply higher. As some have noted, it’s only 1972 before gold exploded to the upside in the 1970s. In a world of falling fiat currencies, gold, the alternative currency, is rising.
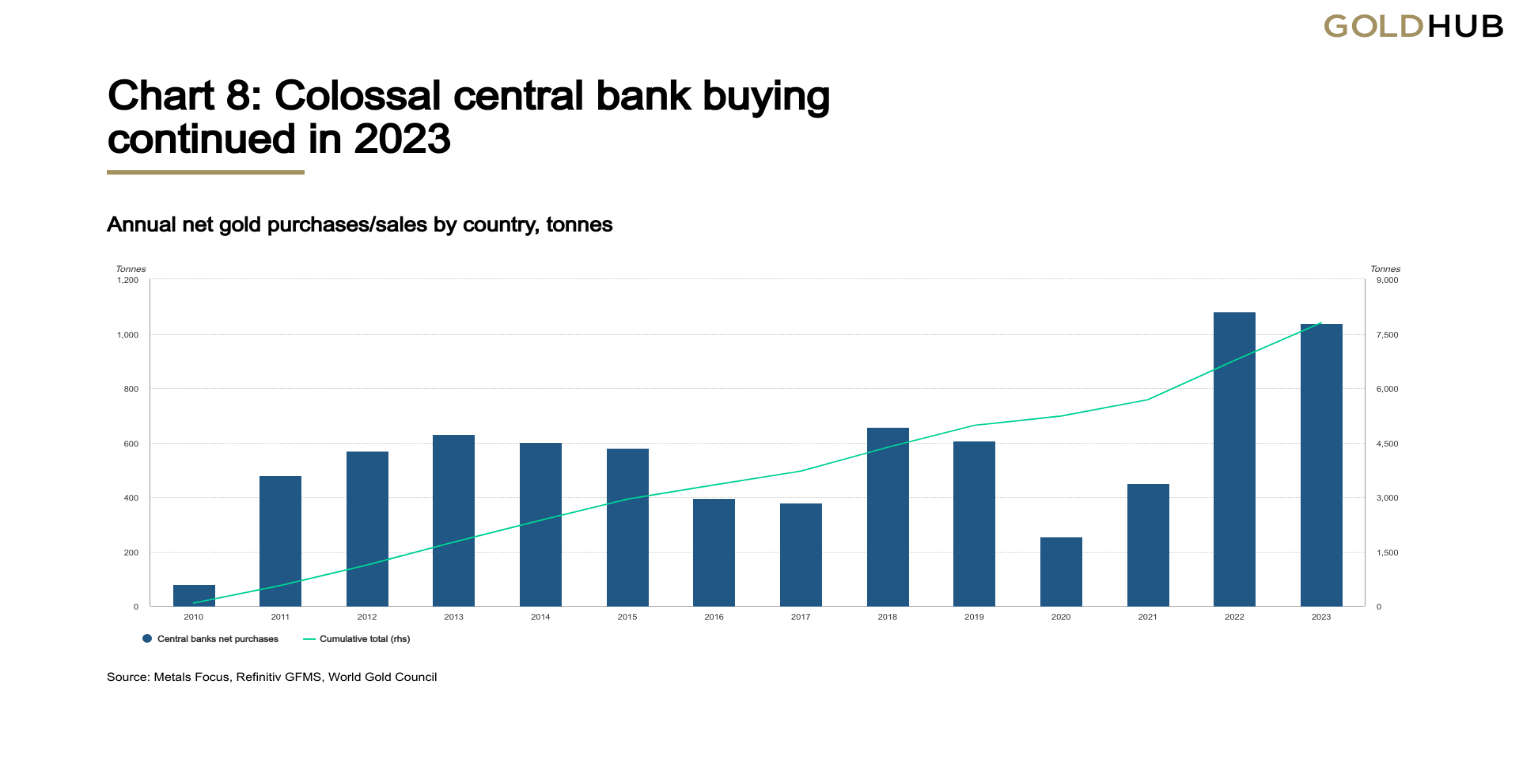
Source: www.gold.org, www.metalsfocus.com, www.refinitiv.com
Gold/Bond (10-year) Ratio 2014–2024
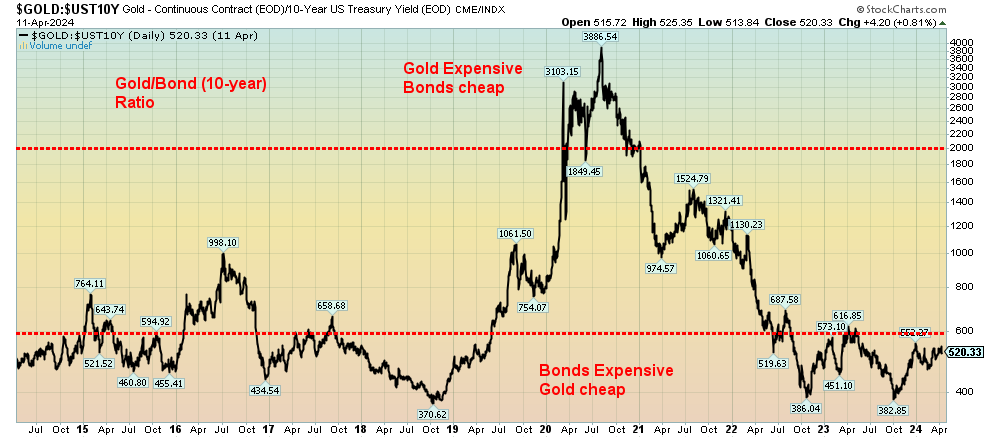
Source: www.stockcharts.com
The gold/bond ratio chart above shows us that, relative to bonds, gold remains cheap. That’s despite gold being at record prices. Either bond yields need to fall or gold prices have much further to rise to get us back to where we were in 2020, when bond yields were pushed down below 1% while gold prices rose sharply coming out of the pandemic.
As crazy as it sounds, gold would need to rise to over $17,000 or the 10-year bond yield would have to fall to 0.62% to obtain that ratio of 3,886 seen at the highs of 2020. Even the current ratio of 520 is high when one compares the ratio seen throughout the 1970s through the 1990s, where it never exceeded 100. It crossed 100 only in 2005 as gold was taking off to its record run into 2011. By that measurement, gold may not be so cheap. A rise for the ratio to between 1000 and 1500 would, however, not be unusual given past performance. Given today’s market, the 10-year falling below 1.00% is most likely not going to happen. The days of cheap interest rates are over. The Fed (and even the BofC) are trying to normalize interest rates.
Wars and the threat of their expansion, persistent inflation, the Fed holding interest rates higher for longer, dysfunctional geopolitical and domestic politics, coupled with growing dislocations because of climate change, are all drivers of the current environment. Suddenly, just like that, gold at $2,500 is within sight.
Chart of the Week
Source: www.goldmansachs.com, www.spglobal.com, www.bloomberg.com,
Courtesy James Wong, Asia fixed income portfolio manager, Hong Kong
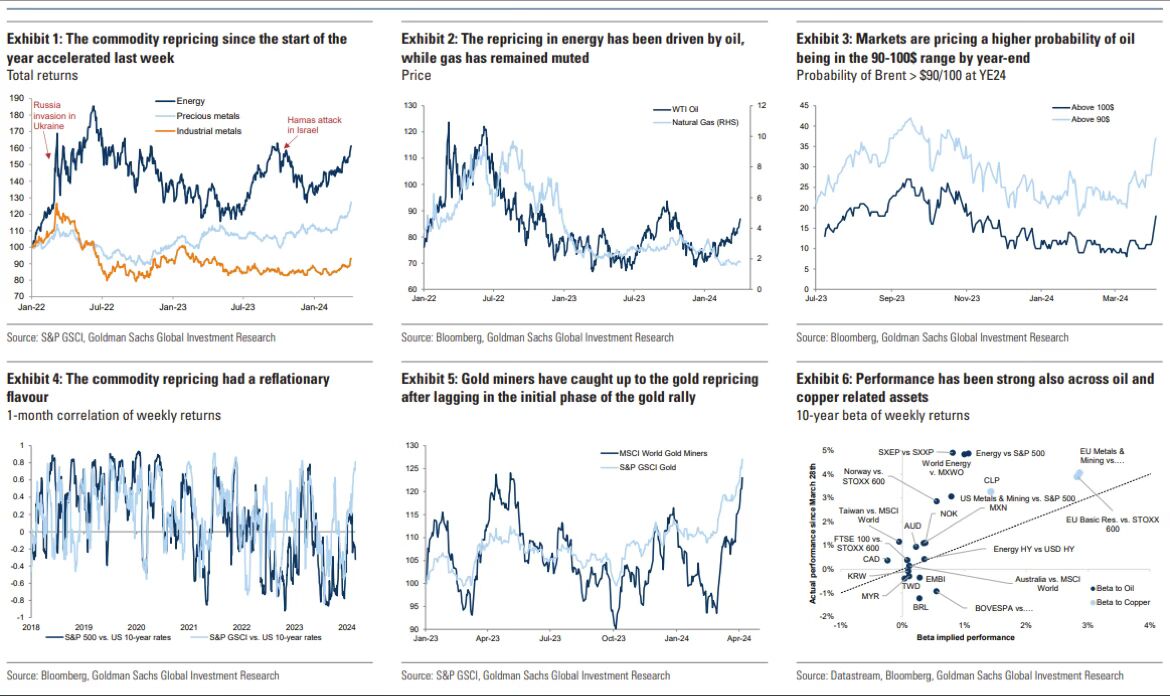
This is an interesting chart we saw posted by James Wong, an Asian fixed-income portfolio manager out of Hong Kong. The chart is from Goldman Sachs Global Investment Research (www.goldmansachs.com). The chart is in six panels. All give further credence to the possibility for a big leg up in what is referred to as the commodity super cycle. No, that does not mean all commodities rise at once, but it is a distinct possibility. The key ones are gold, oil, and copper—all are breaking out. Gold has set record highs. Amongst agriculture prices coffee has broken out and cocoa is soaring to record levels.
The first panel points out that commodity repricing has been going on since the start of 2024 and is now starting to accelerate to the upside. The second panel notes that energy prices are being driven by oil, even as natural gas (NG) has remained rather muted and down on the year. But NG may also be waking up. As we have noted, WTI oil prices are now pointing to over $100 and Brent crude above that (panel three).
Panel four suggests that the rising commodity prices should push inflation higher or be reflationary, as Goldman suggests. Panel five suggests that gold miners are now starting to wake up and their gains could soon surpass the rise in the price gold. They have been huge laggards.
Panel six suggests that not only have the gold miners woken up but energy stocks are now starting to see record highs and selected copper stocks such as Freeport McMoran (FCX) are also seeing record highs.
All this supports our thoughts that 2024 could see a big commodity boom, led by gold, oil, and copper.
Markets & Trends
|
|
|
|
% Gains (Losses) Trends |
|
||||
|
|
Close Dec 31/23 |
Close Apr 12, 2024 |
Week |
YTD |
Daily (Short Term) |
Weekly (Intermediate) |
Monthly (Long Term) |
|
|
Stock Market Indices |
|
|
|
|
|
|
|
|
|
S&P 500 |
4,769.83 |
5,123.41 |
(1.6)% |
7.4% |
neutral |
up |
up |
|
|
Dow Jones Industrials |
37,689.54 |
37,983.24 |
(2.4)% |
0.8% |
down |
up |
up |
|
|
Dow Jones Transport |
15,898.85 |
15,498.11 |
(2.7)% |
(2.5)% |
down |
neutral |
up |
|
|
NASDAQ |
15,011.35 |
16,175.09 |
(0.5)% |
7.8% |
up (weak) |
up |
up |
|
|
S&P/TSX Composite |
20,958.54 |
21,899.99 |
(1.6)% |
4.5% |
up (weak) |
up |
up |
|
|
S&P/TSX Venture (CDNX) |
552.90 |
587.71 |
0.6% |
6.3% |
up |
up |
down |
|
|
S&P 600 (small) |
1,318.26 |
1,270.05 |
(3.0)% |
(3.7)% |
down |
neutral |
up |
|
|
MSCI World |
2,260.96 |
2,315.91 |
(2.0)% |
2.4% |
down (weak) |
up |
up |
|
|
Bitcoin |
41,987.29 |
67,196.20 |
(0.5)% |
60.0% |
neutral |
up |
up |
|
|
|
|
|
|
|
|
|
|
|
|
Gold Mining Stock Indices |
|
|
|
|
|
|
|
|
|
Gold Bugs Index (HUI) |
243.31 |
262.96 |
(0.8)% |
8.1% |
up |
up |
up (weak) |
|
|
TSX Gold Index (TGD) |
284.56 |
312.83 |
0.7% |
9.9% |
up |
up |
up |
|
|
|
|
|
|
|
|
|
|
|
|
% |
|
|
|
|
|
|
|
|
|
U.S. 10-Year Treasury Bond yield |
3.87% |
4.52% |
2.5% |
16.8% |
|
|
|
|
|
Cdn. 10-Year Bond CGB yield |
3.11% |
3.70% |
1.9% |
19.0% |
|
|
|
|
|
Recession Watch Spreads |
|
|
|
|
|
|
|
|
|
U.S. 2-year 10-year Treasury spread |
(0.38)% |
(0.38)% |
(8.6)% |
flat |
|
|
|
|
|
Cdn 2-year 10-year CGB spread |
(0.78)% |
(0.56)% |
11.1% |
28.2% |
|
|
|
|
|
|
|
|
|
|
|
|
|
|
|
Currencies |
|
|
|
|
|
|
|
|
|
US$ Index |
101.03 |
106.00 |
1.6% |
4.9% |
up |
up |
up |
|
|
Canadian $ |
75.60 |
72.67 |
(1.4)% |
(3.9)% |
down |
down |
down |
|
|
Euro |
110.36 |
106.44 |
(1.8)% |
(3.6)% |
down |
down |
down (weak) |
|
|
Swiss Franc |
118.84 |
109.42 |
(1.3)% |
(7.9)% |
down |
down |
neutral |
|
|
British Pound |
127.31 |
124.60 |
(1.4)% |
(2.1)% |
down |
down (weak) |
down (weak) |
|
|
Japanese Yen |
70.91 |
65.27 |
(1.0)% |
(8.0)% |
down |
down |
down |
|
|
|
|
|
|
|
|
|
|
|
|
|
|
|
|
|
|
|
|
|
|
Precious Metals |
|
|
|
|
|
|
|
|
|
Gold |
2,071.80 |
2,374.10 (new highs)* |
1.2% |
14.6% |
up |
up |
up |
|
|
Silver |
24.09 |
28.33 (new highs) |
3.0% |
17.6% |
up |
up |
up |
|
|
Platinum |
1,023.20 |
1,001.70 |
6.5% |
(2.1)% |
up |
up |
down (weak) |
|
|
|
|
|
|
|
|
|
|
|
|
Base Metals |
|
|
|
|
|
|
|
|
|
Palladium |
1,140.20 |
1,059.50 |
5.2% |
(7.1)% |
up |
down (weak) |
down |
|
|
Copper |
3.89 |
4.26 (new highs) |
0.5% |
9.5% |
up |
up |
up |
|
|
|
|
|
|
|
|
|
|
|
|
Energy |
|
|
|
|
|
|
|
|
|
WTI Oil |
71.70 |
85.66 |
(1.4)% |
19.4% |
up |
up |
up (weak) |
|
|
Nat Gas |
2.56 |
1.77 |
(0.6)% |
(30.9)% |
down (weak) |
down |
down |
|
Source: www.stockcharts.com
Note: For an explanation of the trends, see the glossary at the end of this article.
New highs/lows refer to new 52-week highs/lows and, in some cases, all-time highs.
- * New All-Time Highs
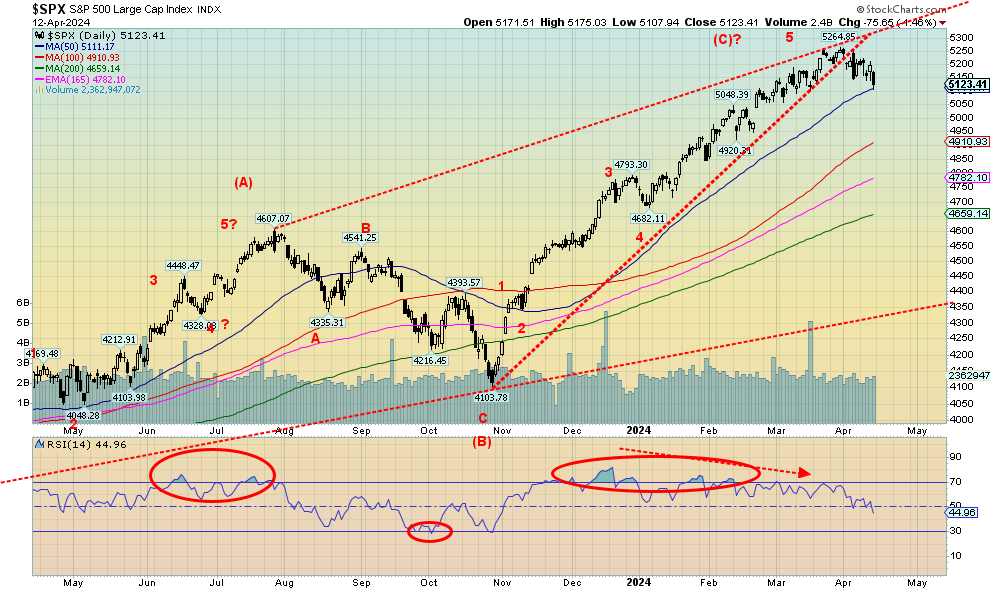
Source: www.stockcharts.com
Has the stock market topped? That is the question. The RSI has broken down out of overbought conditions, while the price oscillator (PPO) and the MACD indicator have turned negative. We note the long negative divergence in the RSI as the S&P 500 made new highs while the RSI made lower highs. Now the S&P 500 is sitting on the cusp of a breakdown under the 50-day MA. Under 5,100 gives us a small sell signal and under 4,900 we have a confirmation of the sell.
It was pretty negative week all around as fear of the expansion of the Middle East wars rattled the markets. Now that we’ve learned that Iran seized an Israeli container ship, and Iran has launched retaliatory strikes, those fears could escalate. On the week, the S&P 500 fell 1.6%, the Dow Jones Industrials (DJI) was down 2.4% and is now up only 0.8% in 2024, the Dow Jones Transportations (DJT) continues its decline, down 2.7%, and is now negative on the year. The NASDAQ was the best performer, losing only 0.5%, thanks to the FAANGs continuing to be somewhat positive as the NY FANG Index rose 0.9% to new all-time highs. The S&P 500 Equal Weight Index fell 2.7% and Berkshire Hathaway dropped 3.2%. Bitcoin fell 0.5% and its failure to make new highs suggests a top may be in there as well. The S&P 400 (Mid) fell 3.0% while the S&P 600 (Small) turned negative on the year, losing also 3.0% this past week.
In Canada, the TSX Composite fell 1.6% but the TSX Venture Exchange (CDNX) gained 0.6%, thanks to rising junior golds and metals. In the EU, the London FTSE rose 1.1% to new 52-week highs, the EuroNext lost 0.2%, the Paris CAC 40 dropped 0.6%, and the German DAX fell 1.6%. In Asia, China’s Shanghai Index (SSEC) fell 1.6%, the Tokyo Nikkei Dow (TKN) rose a small 0.8%, while Hong Kong’s Hang Seng (HSI) fell 1.7%. Not much joy anywhere.
So far, all this appears to be is a correction within the context of a bull market. One can’t really turn this into a bear until we break under the 200-day MA near 4,600 and or drop over 10%, which would put us under 4,700. The 4,600/4,700 zone is therefore very important for the bull market. If that falls, we are entering bear territory. If what appears as an ascending wedge triangle, we could argue that we’ll fall back to the October 2023 low near 4,100. That would put us down over 20%, the definition of a bear market. We are also approaching “sell in May, and go away.” Could that saying be meaningful this year? New highs above 5,265 would keep the bull alive.
The dangers are there: threat of expansion of the war, dysfunctional geopolitical politics, dysfunctional domestic politics as we move towards the November election, massive debt, and trillion dollar-plus deficits. Those are the main ones. And we’re awaiting a black swan event. Could the attack on the Iranian consulate in Damascus be our black swan?
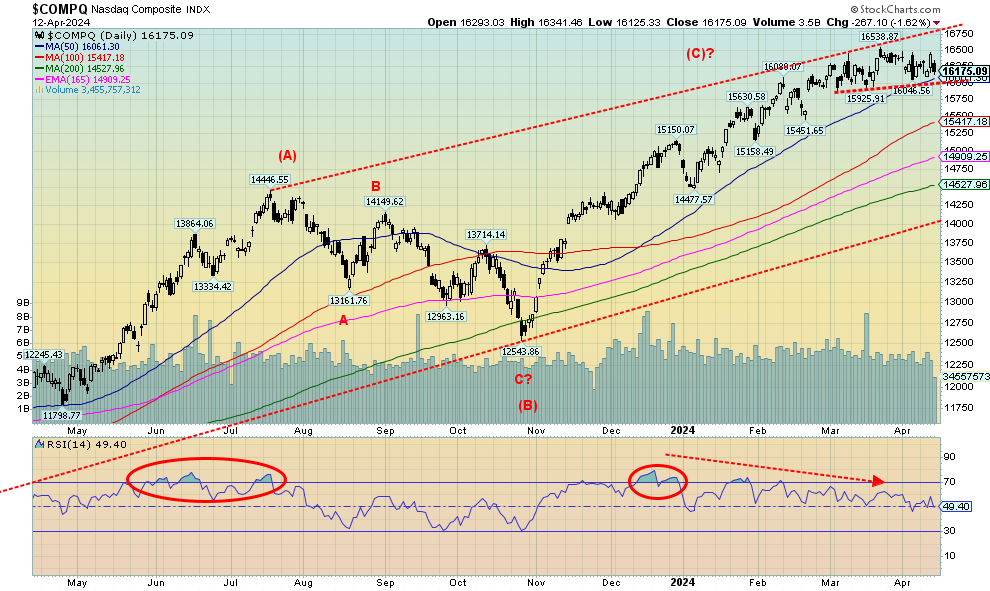
Source: www.stockcharts.com
Unlike the other indices, the NASDAQ was not as bearish this past week. Still, the NASDAQ fell, losing 0.5%, despite the FAANGs gaining on the week. The NY FANG Index made new all-time highs, up 0.9%, one of the few indices gaining on the week. Leading the FAANGs was Apple, recuperating and up 4.1%. Google was up 3.5% and Tesla also recovered up 3.8%. They seemed to be enough to offset Meta, which was down 2.9% despite making new all-time highs, and Advanced Micro (AMD), down 4.2%. Besides Meta making new all-time highs, also making new all-time highs was Amazon, up 0.7%, Netflix, down 2.1% and the previously mentioned Google. As long as the FAANGs stay strong it helps the NASDAQ. But the NASDAQ is looking like it’s sitting on a platform ready to break down. A move under 16,000 might do it. There is a small topping pattern that has the appearance of a small head and shoulders. It projects down to around 15,400 and the 50-day MA. That would be a pretty normal correction. Under 15,450, a top may be in and under 15,150 a top is in. Under 14,475, it’s all over. The FAANGs must keep going higher but they appear to be rolling over. Big performers like Meta were down this week, Nvidia reversed, but clung to a 0.2% gain, Microsoft lost 0.9%, and others made new highs, then reversed and closed lower. Not a positive sign. Expect lower prices.
Source: www.stockcharts.com
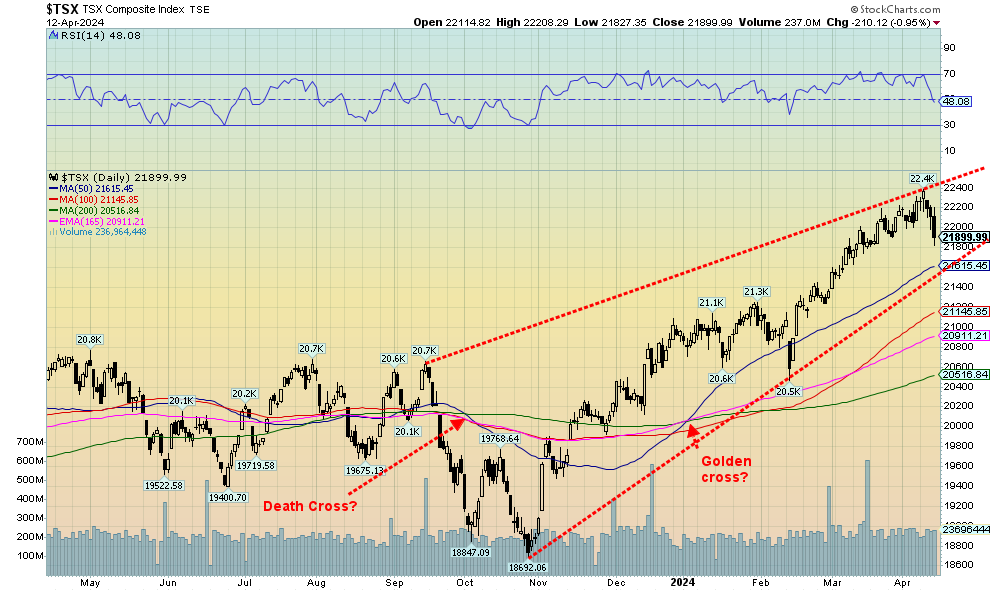
Has the TSX topped? The action this past week was not positive as the TSX Composite fell 1.6%, the steepest drop in weeks. The TSX Venture Exchange (CDNX) bucked that trend and rose 0.6%, thanks to signs that the junior gold mining market is waking up as it finally responds to the record gold prices. Still, even the CDNX suffered on Friday along with everyone else but held its gains for the week. For the sub-indices it was not a very good week, with exceptions. Eleven of 14 sub-indices were down on the week, led by Health Care (THC), down a whopping 11.2%. Other significant losers were Income Trusts (TCM), down 3.7%, Consumer Discretionary (TCD), down 2.9%, Financials (TFS), off 2.4%, Information Technology (TTK), down 3.0%, and Utilities (TUT), off 2.9%. The big winners were no surprise as Metals & Mining (TGM) was up 2.2%, Golds (TGD) up 0.7%, and Materials (TMT) up 0.6%. Energy (TEN) lost 1.0% after making new all-time highs.
We’d have to break down under 21,600 to tell us that a top is in. A bigger breakdown could occur under 21,500. Under 20,500 it’s all over. Only new highs above 22,400 could keep this market going up. Once again, Golds, Metals and Materials are the place to be right now. Despite the pullback, Energy remains compelling.
U.S. 10-year Treasury Note, Canada 10-year bond CGB
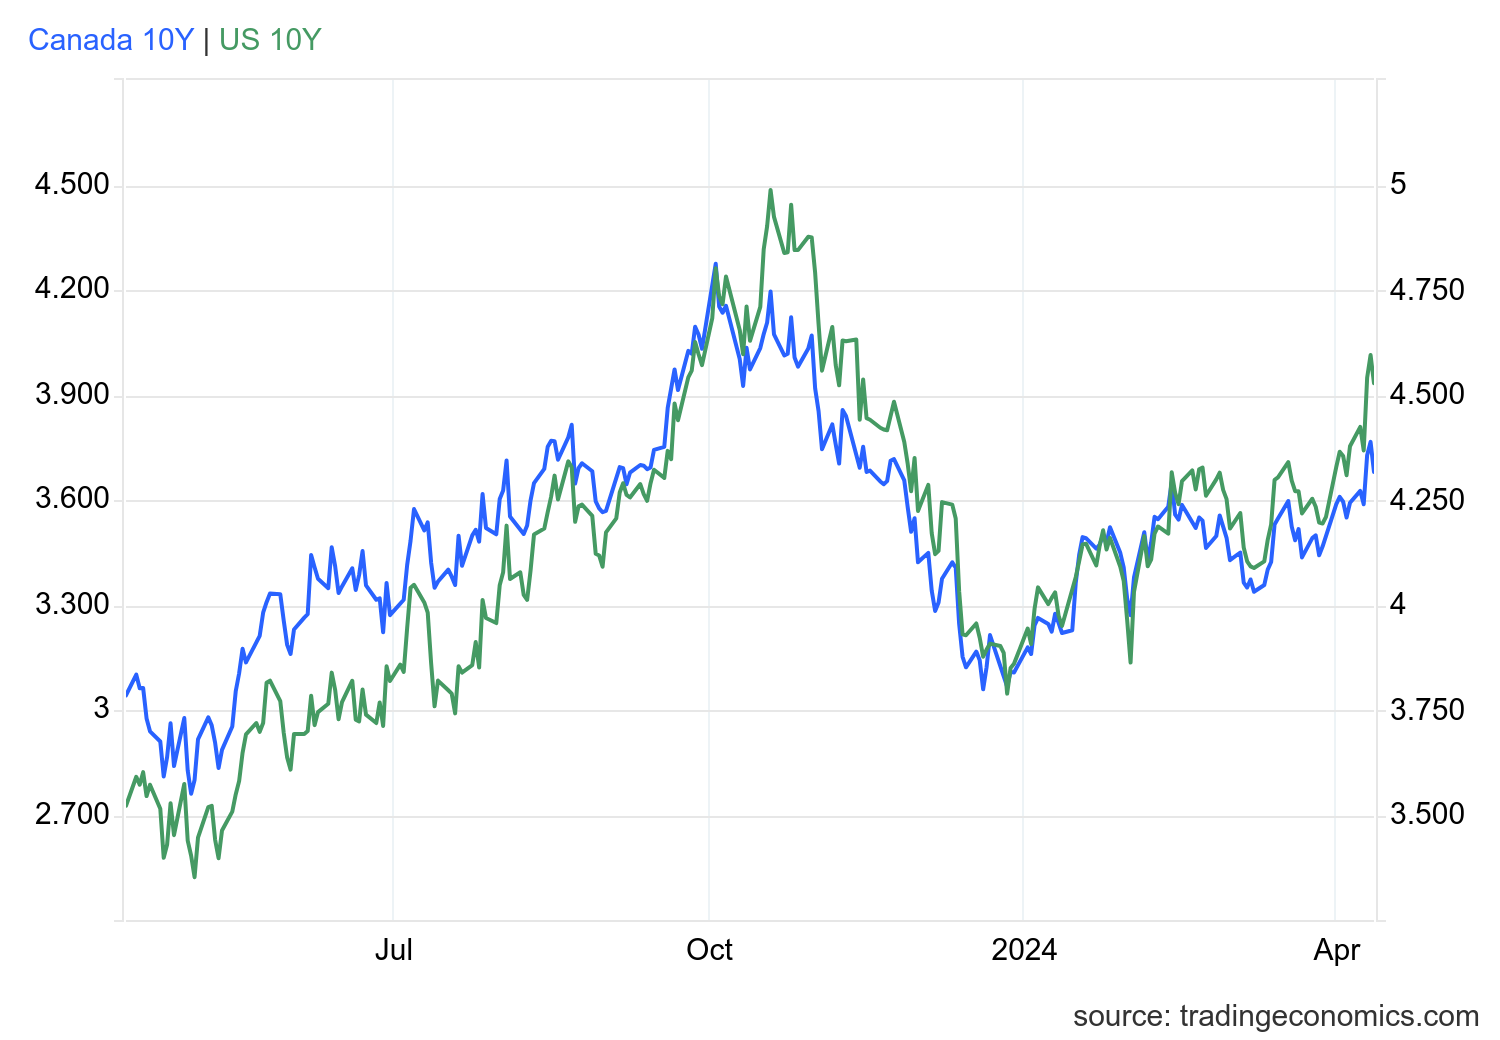
Source: www.tradingeconomics.com, www.home.treasury.gov, www.bankofcanada.ca
The U.S. 10-year treasury note rose this past week to a high of 4.57% before falling back to 4.52% following the threat of war of Iran. The fall was due to safe-haven buying of U.S. treasuries. Canada did the same thing as the Government of Canada 10-year bond (CGB) hit a high of 3.85% before falling back to 3.68% on the same safe-haven buying. Rates rose because of the stronger than expected CPI that came in year over year (y-o-y) at 3.5% vs. 3.2% in February and an expectation of 3.4%. Core CPI also came in stronger than expected at 3.8% vs. expectations of 3.7%. PPI also was higher than expected as it came it at 2.1% as expected but above February’s 1.6%. Thoughts immediately turned to whether the Fed would cut rates in June. Suddenly the expectations of a rate cut by June were fading. Inflation is higher than what the Fed had been expecting. Even the weekly claims didn’t help as they came in at 211,000, below last week’s 222,000 and the expected 219,000. Higher inflation and stronger labour numbers all conspired to dampen expectations of a rate cut. The stock market sold off and bond yields rose. However, the threat of the war expanding brought yields down a bit on Friday.
This week we get retail sales, housing starts, and industrial production. In addition, we get some manufacturing data in the NY Empire Index and the Philly Fed. Canada reports its inflation numbers.
Recession spreads were largely unchanged at negative 0.38% in the U.S. vs. negative 0.35%, while in Canada they fell to negative 0.56% from negative 0.63%.
Michigan Sentiment Index, NFIB Business Optimism Index 2014–2024
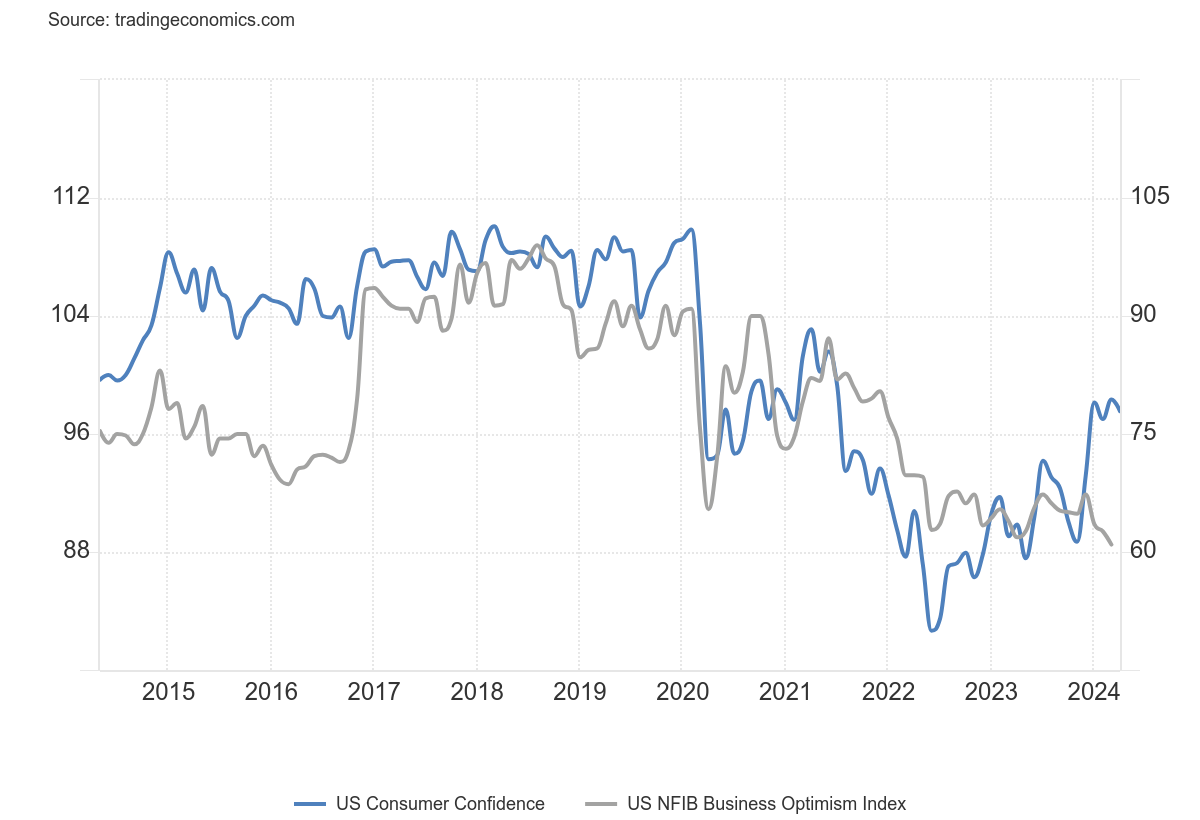
Source: www.tradingeconomics.com, www.umich.edu, www.nfib.com
The University of Michigan consumer sentiment preliminary fell to 77.9 in April 2024 from 79.4 in March which was the highest level since July 2021. Expectations were 79, with both current conditions (79.3 vs 82.5) and expectations (77 vs 77.4) also falling. Seems some concern has slipped in determining the outcome of the November election. As a result, that’s overriding economic concerns. Given the deep divisions in the country, the concern is how it might impact the economy. There is also some concern that inflation is going to remain with us for longer than expected.
The NFIB Small Business Optimism Index fell for a third consecutive month to 88.5 in March 2024, the lowest since December 2012 and well below forecasts of 90.2. Business owners are concerned about inflation and the economy going forward and on how that might impact sales.
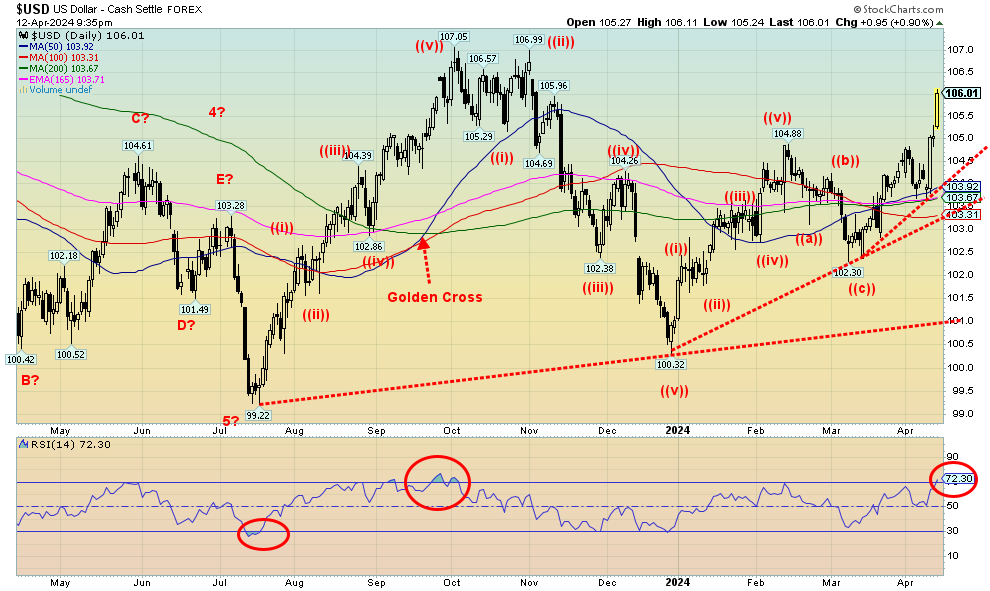
Source: www.stockcharts.com
The US$ Index is a safe haven. With the threat of an expansion of the Middle East war and even the Russia/Ukraine war, the US$ index and gold benefitted as being a flight to safety. For treasury bonds, while yields have been rising, there was some buying coming in this past week. What they don’t want is U.S. stocks. The US$ Index soared this past week to 106, up 1.6% on the week. Currencies fell, led by the euro down 1.8%. The pound sterling fell 1.4% as did the Cdn$, the Swiss franc was down 1.3%, and the Japanese yen was down 1.0%. Other lesser currencies were hit harder. The US$ Index is now in overbought territory but, as we’ve seen with others, it could still move higher. Overbought conditions are a warning, not necessarily signifying that the top is here. With the rise to 106, the odds of seeing new highs above the 107.05 high of September 2023 are now in sight. Surprisingly, despite the rise in the US$ Index, gold also rose in defiance of the U.S. dollar rise.
Source: www.stockcharts.com
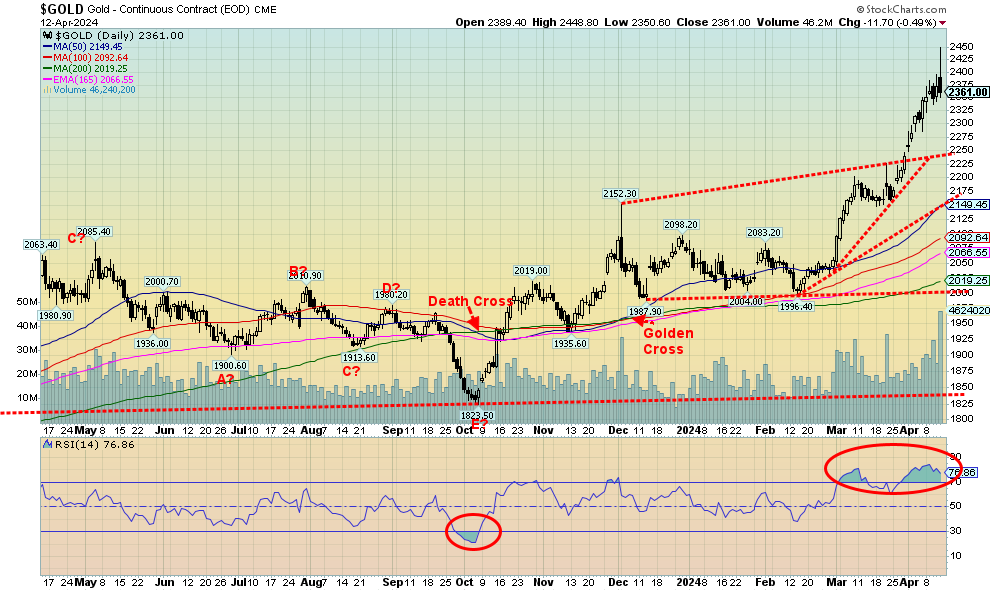
War, or the threat of expansion of the Middle East war helped spark gold to once again reach record prices, falling just short of $2,450 before reversing on Friday and closing lower. Now that there are signs that the Mid-East war is expanding what will be the impact on gold opening Sunday night/Monday Morning. It was a reversal, but not a key reversal as gold prices did not take out the low of the previous day. That suggests a consolidation may lie ahead. While the threat of an imminent attack by Iran on Israel helped spark the initial jump, easing of that fear helped gold reverse. It reminds of us what happened back in December with a comparable spike and reversal. Following that, gold went through a period of consolidation. We may be on the cusp of another consolidation. That would help bring down the severely overbought conditions as measured by the RSI. The commercial COT is a poor 26.6%, well below levels over 30% normally associated with an upward move.
Also not helping gold was a sharp rise in the US$ Index. U.S. Treasury bonds, that had been rising in yield, pulled back a bit on Friday as treasury bonds also became a safe haven. One thing for certain is that stocks were not a safe haven as they sold off sharply. Nonetheless, gold was up for the seventh time in the past eight weeks.
On the week, gold rose 1.2% to the new all-time of $2,448.80, silver continued its tear, rising 3.0% to fresh 52-week highs, while platinum woke up, gaining 6.5%. Of the near precious metals, palladium rose 5.2% while copper was up a modest 0.5% and also made 52-week highs. As to the gold stocks, the Gold Bugs Index (HUI) fell 0.8% following that reversal on Friday while the TSX Gold Index (TGD) was up 0.7%.
Gold’s safe-haven status was fully recognized, given the rush into gold this past week. Note how the volume leaped. The strong volume on an upward thrust suggests this rally should continue once gold goes through a consolidation period. The threat of expansion of the wars in the Middle East and Russia/Ukraine cannot be easily dismissed. With pressures on currencies, gold becomes a safe haven. Gold even rose, despite the strong performance for the US$ Index.
Many commodity prices have been rising of late. Gold is up 14.6% in 2024, silver up 17.6%, and copper up 9.5%. Platinum remains down 2.1% and palladium has been the weakest, down 7.1%. But other commodities have been rising as well. Other metals are up as well, with aluminum up 4.3%, nickel up 7.4%, while uranium is actually off 2.5% in 2024 but up 368% from the March 2020 lows. The U.S. (and U.K.) have added more sanctions on Russia that now include copper, aluminum, and nickel. Russia will most likely have no problem selling its products elsewhere, but further sanctions could disrupt supply chains, leading to increases as it is prices on the London Metals Exchange (LME) that determines world prices. Russia is a major producer of copper, aluminum, and nickel, holding 4%, 5%, and 6% of the global market, respectively. Russia is also a major gold producer, ranking third in the world behind China and Australia. Canada and the U.S. are ranked fourth and fifth with production levels well below Russia’s.
Gold has been quite overbought, so a period of consolidation would be welcomed to work it off. However, the fear of war in the Middle East is not about to go away. As we noted, we’ve been seeing strong central bank buying of gold, hedge funds are coming back into the market, and Costco’s gold bars have been met with enthusiasm. Eventually that should translate into the gold stocks.
Gold is now through $2,300 and hit over $2,400 suggesting to us that $2,500 is within sight. Technically, gold could fall back towards to $2,175 and remain in an uptrend. However, we would not want to see it break that level. The trend is up and, following a period of consolidation, we should resume that uptrend. With rising volume, we know this a solid uptrend. War, divisive geopolitics, divisive domestic politics, and monstrous global debt are the main drivers.
Source: www.stockcharts.com
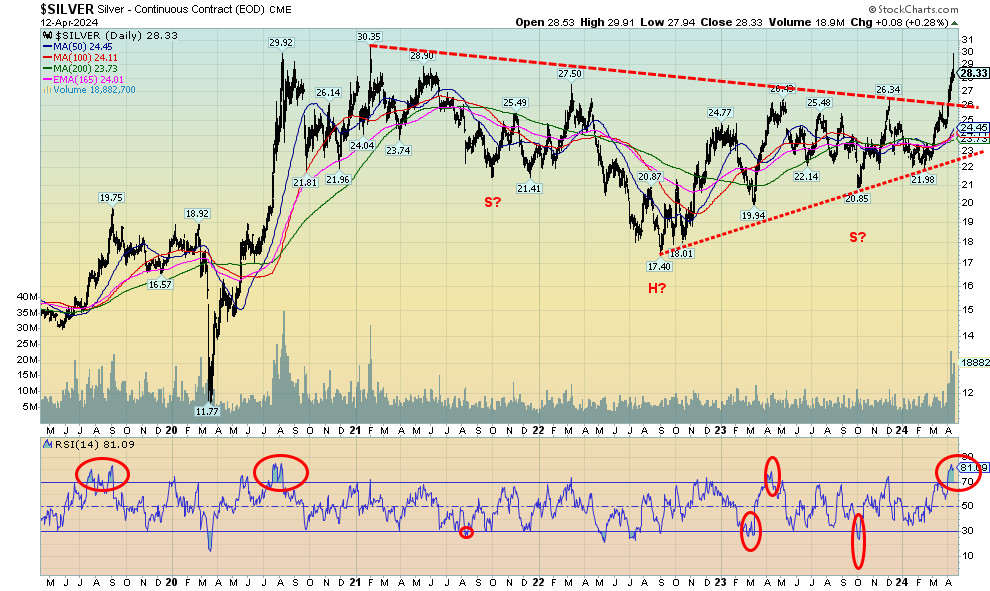
With a close over $28 this past week, silver has now successfully broken out: first over $26, then over $27.50, the early 2022 high. Remaining is a breakout over the February 2021 high of $30.35. The high this past week was $29.91, suggesting we should eventually break out over $30.35. In the interim, it appears we could go through a period of consolidation. The RSI had reached well over 70, overbought territory. Volume was high on the breakout over 27, giving credence and support to the breakout. So, the reversal on Friday should be just that—a reversal, with no lasting negative effects.
On the week, silver gained 3.0% to fresh 52-week highs. Silver outpaced gold once again, lowering the gold/silver ratio to 83.80, well down from the peak of 94.41 seen in February 2024. The all-time high was 131.41 seen in March 2020 at the height of the pandemic. In 2011, at the peak at that time when silver hit near $50, the ratio had fallen to 31.53. To achieve that today silver would have to be $75.
The possible head and shoulders reversal pattern for silver suggests a move to $39/$40. Over $40 targets could as high as $47. The all-time high was $49.82 set in 2011. However, the 1980 high of $49 would require silver to rise to $145 to $165 in order to meet that.
The commercial COT is a poor 27.7% and is not supportive of higher prices. However, we have seen periods where the commercial COT remained low, even as silver prices climbed higher.
Source: www.stockcharts.com
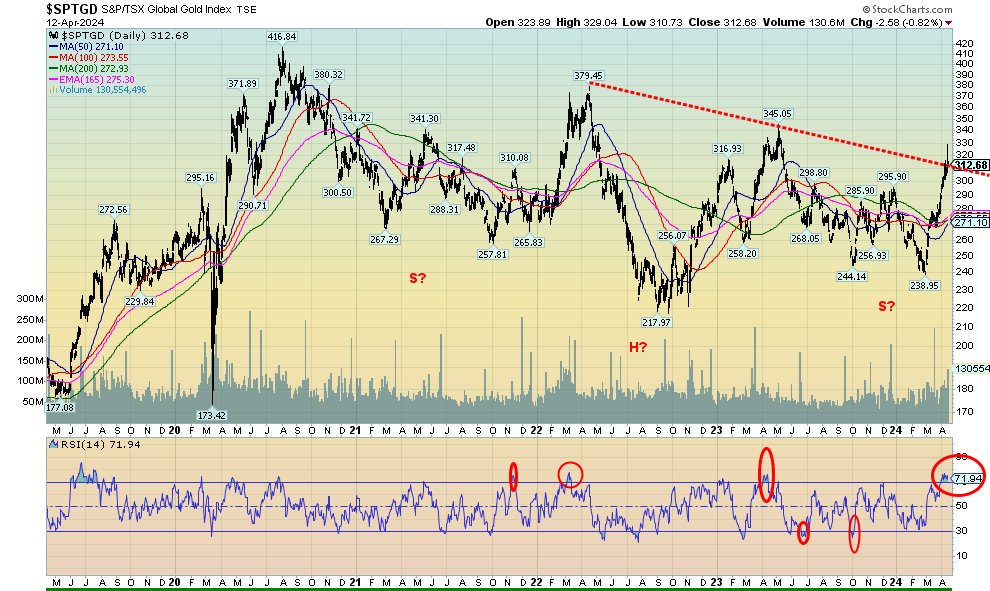
The TSX Gold Index (TGD) broke out this past week. Or did it? Based off the early 2022 high, the TGD broke out, hitting a high of 329 before selling off on profit-taking and a general reversal in the market. The TGD then fell right back to the breakout line near 310. Based off the August 2020 high, the TGD still needs to break out over 340.
On the week, the TGD managed to rise 0.7%, despite Friday’s sharp reversal. The HUI actually fell 0.8% on the week. The HUI did break out when it cleared 240, but it still needs to clear above 300 to suggest higher prices. Despite the reversals on Friday for both the TGD and HUI, all it looks like is a reversal day and not the end of a rally. A period of consolidation is not out of the question, given the RSI climbed into overbought territory above 70.
The Gold Miners Bullish Percent Index (BPGDM) reached 78.57 this past week, putting the index above 75 in overbought territory. Still, the index has room to move higher. In 2020 it hit 100, the highest level seen since the index was started in 2007. There is no guarantee the TGD can go higher, as failures once over 75 for the BPGDM were seen in 2022. Since 2020, both the TGD and the HUI have underperformed for both gold and silver. The Gold/HUI ratio and the Gold/TGD ratio show that the gold stocks remain very cheap vis-à-vis gold.
The TGD has a potentially compelling head and shoulders pattern on the charts. It’s quite imperfect, given that the right shoulder is supposed to remain above the left shoulder. Nonetheless, the shape is there. Friday’s breakout appeared to suggest that the H&S pattern was being broken. Then it failed. If the pattern is correct, then the TGD has potential targets up to 470. At that level, the TGD would be recording new all-time highs. The TGD remains down 31% from its all-time set in 2011. The HUI is worse, down 59% from its all-time high. Those highs seem but a distant memory. The gold stocks, despite gold making all-time highs, have remained quite depressed, unnoticed, and unloved. Instead, the flavour of the day has been cryptos and AI stocks. But if the gold stocks catch people’s attention, it’s a small market and prices could move up quickly. As to the H&S pattern, if the 2020 high is used instead, then once over 340 (the neckline) potential targets are up to 540.
The breakout this past week was encouraging. However, the sharp reversal on Friday suggests we could consolidate first. Only a break back under 270 could end the current rally.
Source: www.stockcharts.com
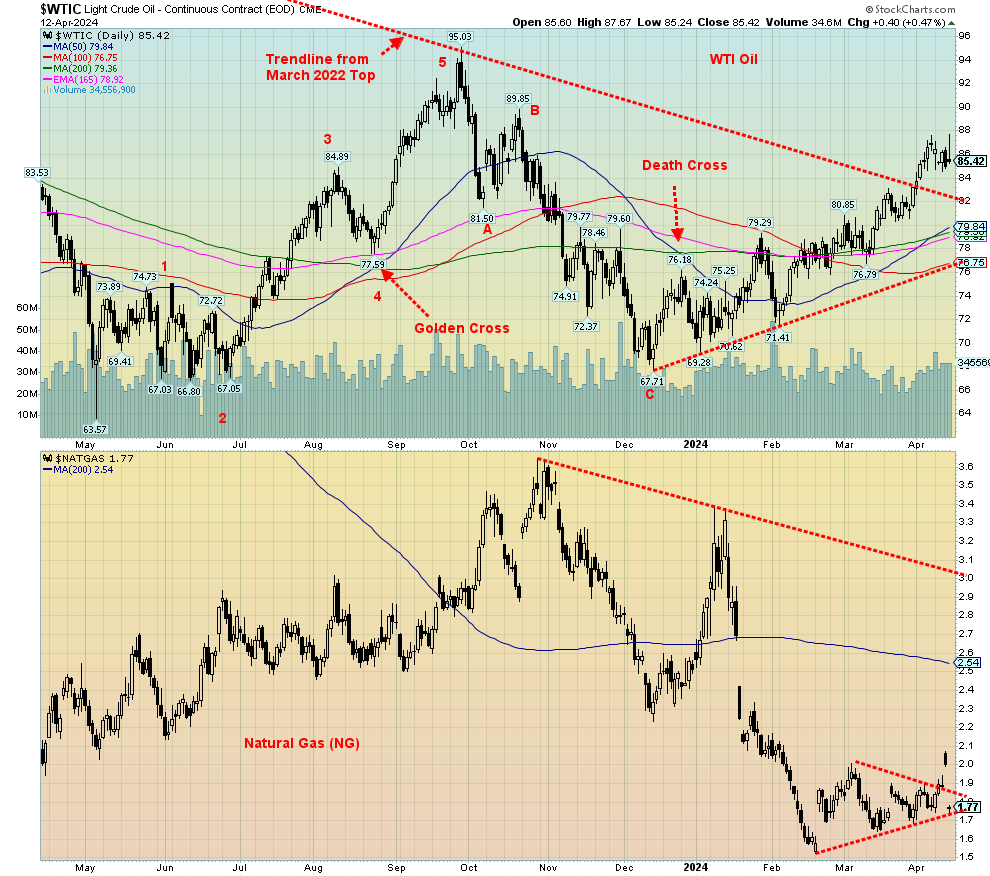
With inventories rising and a CPI that came in somewhat higher than expected, thus dampening thoughts of interest rate cuts, oil prices stabilized this past week. On the week, WTI oil fell 1.4% while Brent crude was off 0.5%. Nonetheless, fear of an Iranian attack on Israel helps maintain the war risk. Iran apparently seized an Israeli container ship and have launched missiles raising the ante once again. Any Iranian attack could also drag the U.S. into the war as the U.S. has indicated they would protect Israel. Any expansion of the war could bring others in as well, including Russia or China or both on the side of the Iranians. China is a major buyer of Iranian oil (despite sanctions) and will want to protect those supply lines.
Natural gas (NG) was mixed as NG at the Henry Hub fell 0.5% but NG at the EU Dutch Hub jumped 15.9%. War was impacting the EU Dutch Hub due to fears of attacks on Ukrainian storage, and Japanese restocking inventories because of the potential for supply disruptions if war broke out. The EU storage tanks are pretty full at 60.87% capacity. The energy stocks reversed with the market at the end of the week as the ARCA Oil & Gas Index (XOI) fell 2.1% while the TSX Energy Index (TEN) was off 1.0%. The reversal came after both indices set new all-time highs.
WTI oil is consolidating after breaking out over $84. Projections remain up to the $110/$115 zone. A drop under $82 would be negative. Under $77, it’s fatal and a test of the lows may follow. The NG chart appears to have a mistake in it with that mysterious jump over $2, followed immediately by a drop to $1.77. According to Trading Economics (www.tradingeconomics.com), NG did hit a high of $1.89 on April 11 but definitely did not go over $2. With those reversals this past week, the energy stocks are indicating that they should enter a period of consolidation. Given overbought conditions, this would be positive. The TEN currently has good support down to 265/270.
While oil prices have stalled for the moment, the outlook remains bearish, meaning oil prices should continue to rise following any period of consolidation. NG continues to look like it is trying to form a bottom, but it needs to break over $2, then especially over $2.50. $1.70 is support and a break under that level could lead to further declines.
Copyright David Chapman 2024
GLOSSARY
Trends
Daily – Short-term trend (For swing traders)
Weekly – Intermediate-term trend (For long-term trend followers)
Monthly – Long-term secular trend (For long-term trend followers)
Up – The trend is up.
Down – The trend is down
Neutral – Indicators are mostly neutral. A trend change might be in the offing.
Weak – The trend is still up or down but it is weakening. It is also a sign that the trend might change.
Topping – Indicators are suggesting that while the trend remains up there are considerable signs that suggest that the market is topping.
Bottoming – Indicators are suggesting that while the trend is down there are considerable signs that suggest that the market is bottoming.
Disclaimer
David Chapman is not a registered advisory service and is not an exempt market dealer (EMD) nor a licensed financial advisor. He does not and cannot give individualised market advice. David Chapman has worked in the financial industry for over 40 years including large financial corporations, banks, and investment dealers. The information in this newsletter is intended only for informational and educational purposes. It should not be construed as an offer, a solicitation of an offer or sale of any security. Every effort is made to provide accurate and complete information. However, we cannot guarantee that there will be no errors. We make no claims, promises or guarantees about the accuracy, completeness, or adequacy of the contents of this commentary and expressly disclaim liability for errors and omissions in the contents of this commentary. David Chapman will always use his best efforts to ensure the accuracy and timeliness of all information. The reader assumes all risk when trading in securities and David Chapman advises consulting a licensed professional financial advisor or portfolio manager such as Enriched Investing Incorporated before proceeding with any trade or idea presented in this newsletter. David Chapman may own shares in companies mentioned in this newsletter. Before making an investment, prospective investors should review each security’s offering documents which summarize the objectives, fees, expenses and associated risks. David Chapman shares his ideas and opinions for informational and educational purposes only and expects the reader to perform due diligence before considering a position in any security. That includes consulting with your own licensed professional financial advisor such as Enriched Investing Incorporated. Performance is not guaranteed, values change frequently, and past performance may not be repeated.
About the author


Website: https://www.enrichedinvesting.com
Disclaimer: David Chapman is not a registered advisory service and is not an exempt market dealer (EMD) nor a licensed financial advisor. We do not and cannot give individualised market advice. David Chapman has worked in the financial industry for over 40 years including large financial corporations, banks, and investment dealers. The information in this newsletter is intended only for informational and educational purposes. It should not be considered a solicitation of an offer or sale of any security. The reader assumes all risk when trading in securities and David Chapman advises consulting a licensed professional financial advisor before proceeding with any trade or idea presented in this newsletter. David Chapman may own shares in companies mentioned in this newsletter. We share our ideas and opinions for informational and educational purposes only and expect the reader to perform due diligence before considering a position in any security. That includes consulting with your own licensed professional financial advisor.