
“Uncivil war, uncivil war
How long must we fight this uncivil war
The same old wounds we opened before
Nobody wins an uncivil war”
—Uncivil War, songwriters John Hahn, Will Kimbrough – performed by Shemekia Copeland, from the album Uncivil War (2020)
“There are two kinds of forecasters: those who don’t know, and those who don’t know they don’t know.”
—John Kenneth Galbraith, Canadian-American economist, diplomat, public official, intellectual, author of The Affluent Society (1958) plus others, 7th ambassador to India 1961–1963; 1908–2006
“The most reliable way to forecast the future is to try and understand the present.”
—John Naisbitt, American author, public speaker, book – Megatrends: Ten New Directions Transforming Our Lives (1982); 1929–2021
It will soon be 2022. We are approaching our second anniversary of the pandemic that has disrupted the world. It won’t just suddenly go away nor will it kill everyone. Many will get it. Many will not even know they have it. Uncertainty, volatility, and disruption appear to be the new normal. If the pandemic was the only issue, maybe it wouldn’t be so bad. But we are also dealing with other issues: climate change, sparking freak storms that destroy, displace, and kill; rising global geo-political tensions as the U.S. and China decouple and accusations that Russia will invade Ukraine rise; increasing domestic political tensions and rising nationalism; rising inflation because of rising costs related to the pandemic and natural disasters, sparking supply chain disruptions; increasing cyberattacks; and rising humanitarian crises.
All of this is placing 2022 in the cross-hairs of what won’t be a particularly good year. Nor will it be a particularly bad year either, given what has taken place over the past couple of years. But can it get any worse? Yes. The good news is that 2021 should end on a positive note with both the stock market and the housing market up nicely on the year. The bad news is the Omicron variant is spreading and could disrupt things further, inflation is rising, and geopolitical and domestic politics are deteriorating. Any of these could turn the good market into a bad market.
We show below once again our 10-year stock market cycle. History can be a guide for what may lie ahead. Historically, the best years of decades are years ending in 5. The worst are years ending in 3. Years ending in 2 rank number 5 with, so far, 11 up years and 7 down years since 1831. Notable down years were 1932 and 2002. Notable up years were 1862, 1922, and 1982. Overall, that doesn’t tell us a lot about what to expect in 2022. The past decade has been a very positive one with only two down years: 2015 and 2018. Both were mild.
10-Year Stock Market Cycle
Annual % Change in the Dow Jones Industrials Average*
Year of Decade
|
Decades |
1st |
2nd |
3rd |
4th |
5th |
6th |
7th |
8th |
9th |
10th |
|
1831–40 |
|
|
-0.9 |
13.0 |
3.1 |
-11.7 |
-11.5 |
1.6 |
-12.3 |
5.5 |
|
1841–50 |
-13.3 |
-18.1 |
45.0 |
15.5 |
8.1 |
-14.5 |
1.2 |
-3.6 |
- |
18.7 |
|
1851–60 |
-3.2 |
19.6 |
-12.7 |
-30.2 |
1.5 |
4.4 |
-31.0 |
14.3 |
-10.7 |
14.0 |
|
1861–70 |
-1.8 |
55.4 |
38.0 |
6.4 |
-8.5 |
3.6 |
1.6 |
10.8 |
1.7 |
5.6 |
|
1871–80 |
7.3 |
6.8 |
-12.7 |
2.8 |
-4.1 |
-17.9 |
-9.4 |
6.1 |
43.0 |
18.7 |
|
1881–90 |
3.0 |
-2.9 |
-6.5 |
-18.8 |
20.1 |
12.4 |
-8.4 |
4.8 |
5.5 |
-14.1 |
|
1891–00 |
17.6 |
-6.6 |
-24.6 |
-0.6 |
2.3 |
-1.7 |
21.3 |
22.5 |
9.2 |
7.0 |
|
1901–10 |
-8.7 |
-0.4 |
-23.6 |
41.7 |
38.2 |
-1.9 |
-37.7 |
46.6 |
15.0 |
-17.9 |
|
1911–20 |
0.4 |
7.6 |
-10.3 |
-5.4 |
81.7 |
-4.2 |
-21.7 |
10.5 |
30.5 |
-32.9 |
|
1921–30 |
12.7 |
21.7 |
-3.3 |
26.2 |
30.0 |
0.3 |
28.8 |
48.2 |
-17.2 |
-33.8 |
|
1931–40 |
-52.7 |
-23.1 |
66.7 |
4.1 |
38.5 |
24.8 |
-32.8 |
28.1 |
-2.9 |
-12.7 |
|
1941–50 |
-15.4 |
7.6 |
13.8 |
12.1 |
26.6 |
-8.1 |
2.2 |
-2.1 |
12.9 |
17.6 |
|
1951–60 |
14.4 |
8.4 |
-3.8 |
44.0 |
20.8 |
2.3 |
-12.8 |
34.0 |
16.4 |
-9.3 |
|
1961–70 |
18.7 |
-10.8 |
17.0 |
14.6 |
10.9 |
-18.9 |
15.2 |
4.3 |
-15.2 |
4.8 |
|
1971–80 |
6.1 |
14.6 |
-16.6 |
-27.6 |
38.3 |
17.9 |
-17.3 |
-3.1 |
4.2 |
14.9 |
|
1981–90 |
-9.2 |
19.6 |
20.3 |
-3.7 |
27.7 |
22.6 |
2.3 |
11.8 |
27.0 |
-4.3 |
|
1991–00 |
20.3 |
4.2 |
13.7 |
2.1 |
33.5 |
26.0 |
22.6 |
16.1 |
25.2 |
-6.2 |
|
2001–10 |
-7.1 |
-16.8 |
25.3 |
3.1 |
-0.6 |
16.3 |
6.4 |
-33.8 |
18.8 |
11.0 |
|
2011–20 |
5.5 |
7.3 |
26.5 |
7.5 |
-2.2 |
13.4 |
25.1 |
-5.6 |
22.3 |
7.2 |
|
2021–30 |
15.6* |
|
|
|
|
|
|
|
|
|
|
|
11 up 8 dn |
11 up 7 dn |
9 up 10 dn |
13 up 6 dn |
15 up 4 dn |
11 up 8 dn |
10 up 9 dn |
14 up 5 dn |
13 up 5 dn 1 flat |
11 up 8 dn |
Source: www.stocktradersalmanac.com
* To date
The average return for years ending in 2 is 5.2%. Of bigger interest might be the presidential election/stock market cycle. 2022 is a midterm election year. Midterm election years tend to be positive with 28 up years and only 19 down years since 1833. The most successful midterm election years were 1862 under Lincoln (+55.4%) and 1954 under Eisenhower (+44.0%). Two of the worst midterm years were 1932 under Hoover (-33.8%) and 1974 under Nixon (-27.6). Hoover was dealing with the Great Depression while Nixon was dealing with Watergate and the fallout from the Arab oil crisis. Nixon resigned in August 1974 as a result of Watergate. This year President Biden is dealing with COVID (Omicron variant) and rising geopolitical and domestic political tensions. Add in rising inflation and things are not shaping up well for 2022.
In response to the rising inflation, the Federal Reserve has already signaled they are speeding up their taper. The program is to be run down by March 2022 instead of June 2022 as originally planned. As well, they signaled they could be poised to hike rates three times in 2022 to combat inflation. It is noteworthy that the Bank of Canada (BofC) has signaled the same. The Bank of England (BOE) did hike rates, sparking the yield curve to invert and raising odds of a recession in the U.K. In response to the Fed’s announcements, bond yields fell as the U.S. 10-year treasury note dropped to 1.41%. The 2-year–10-year spread is also narrowing. Stocks and gold rallied in response to the Fed announcement. Santa Claus is coming to town? However, the very next day gold soared while the stock market sank. The Grinch is coming to town? The Fed has gone from being Santa Claus to the Grinch.
If Santa Claus should fail to call,
Bears may come to Broad and Wall
Source: www.stocktradersalmanac.com
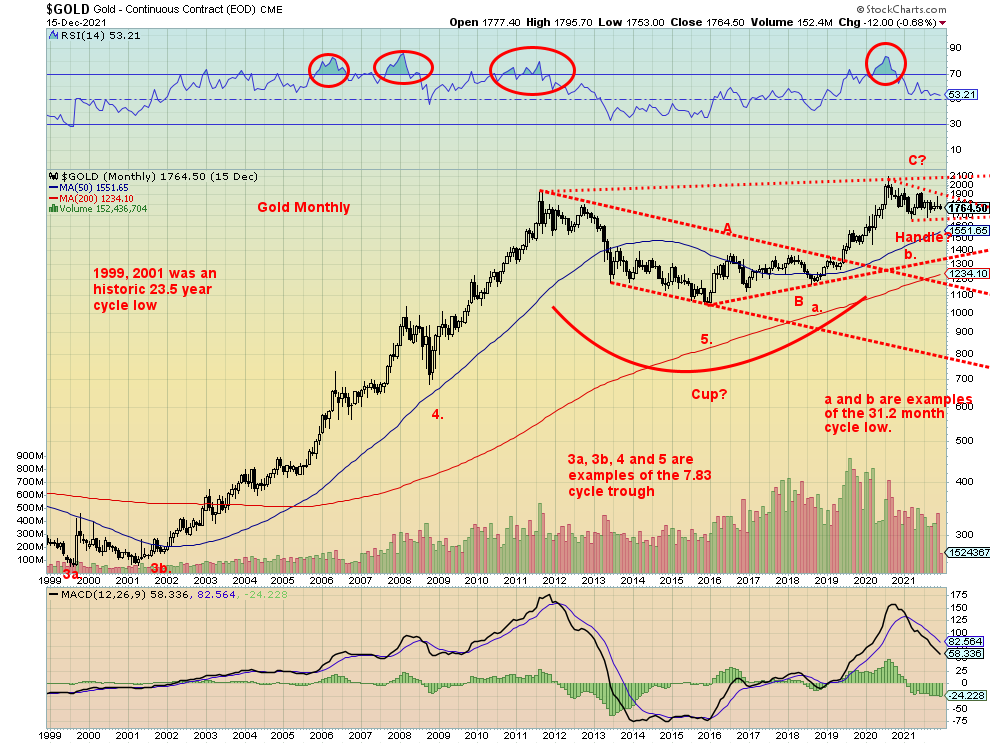
First, let’s look at gold. Our monthly chart of gold since 2000 still shows a possible cup and handle pattern that has been forming since the peak in 2011. We have noted some of the major cycles on the chart. The longest is the 23.5-year cycle which is ideally due during 2020–2027. The last one was seen with the double bottom in 1999 and 2001. Its subdivision is the 7.83-year cycle last seen in 2015. Its next is due October 2023 +/- 8 months Feb 2023–June 2024. Both cycles overlap. The 7.83-year cycle subdivision is the 31.2-month sub-cycle. So far, that was seen in March 2021 which came 31 months after the August 2018 low. The 31.3-month cycle is next due in October 2023. As one can see, the three cycles overlap, raising the potential for 2023 to be our final low.
The question is the peak of the current 31.3-month cycle. Will its peak take out the August 2020 high at $2,089? Failure to do so would set up the collapse into the 23.5-year/7.83-year cycle lows. If the cup and handle is correct, we have the potential to rise to $2,300/$2,700. If instead we fail and break down, then the decline could take us to $1,200/$1,400 for the important long-term cycle lows. The breakout point for the cup and handle is above $1,900, but to confirm we’d need to see new highs above $2,089. This next rally for gold needs some staying power or it will fail. Volume on the rise would be important.
Source: www.stockcharts.com
All of this suggests that 2022 for gold could be quite important. Our table below shows the 10-year gold cycle. We note that years ending in two are generally positive, with 4 up and only one down since gold became free trading in the 1970s. This included a 49% gain in 1972 and a 25% gain in 2002. As to gold’s performance in presidential midterm years, we note that since the late 1960s gold’s record is 7 up years and 5 down years. The up years have all been quite strong, including a 61% gain in 1974, while the down years have generally been weak. The worst was 1970 when gold fell about 9%.
There are a number of positive signs suggesting gold could enjoy a good up year in 2022 against the background of potential stagflation and political unrest. The caveat rests on gold rising in 2022 and taking out the August 2020 high. Failure to do that would tell us we are going down to make the larger cycle lows.
10-Year Gold Cycle
Annual % Change in Gold
Year of Decade
|
Decades |
1st |
2nd |
3rd |
4th |
5th |
6th |
7th |
8th |
9th |
10th |
|
1961–70 |
|
|
|
|
|
|
-0.5 |
10.7 |
6.2 |
-8.9 |
|
1971–80 |
16.5 |
48.9 |
75.6 |
60.6 |
-23.3 |
-3.8 |
23.4 |
36.5 |
134.8 |
10.9 |
|
1981–90 |
-32.5 |
12.7 |
-14.4 |
-20.0 |
6.9 |
23.1 |
20.1 |
-15.7 |
-1.8 |
-1.6 |
|
1991–00 |
-10.6 |
-5.9 |
17.6 |
-1.9 |
1.0 |
-4.9 |
-21.5 |
-0.2 |
0.1 |
-6.0 |
|
2001–10 |
2.6 |
24.8 |
flat |
25.6 |
18.2 |
22.8 |
31.4 |
5.8 |
23.9 |
29.8 |
|
2011–20 |
10.2 |
7.0 |
-28.2 |
-1.5 |
-10.4 |
8.6 |
13.7 |
-2.1 |
18.9 |
24.4 |
|
2021–30 |
-4.8* |
|
|
|
|
|
|
|
|
|
|
|
3 up 3 dn |
4 up 1 dn |
2 up 2 dn |
2 up 3 dn |
3 up 2 dn |
3 up 2 dn |
4 up 2 dn |
3 up 3 dn |
5 up 1 dn |
3 up 3 dn |
* To date Source: www.stockcharts.com
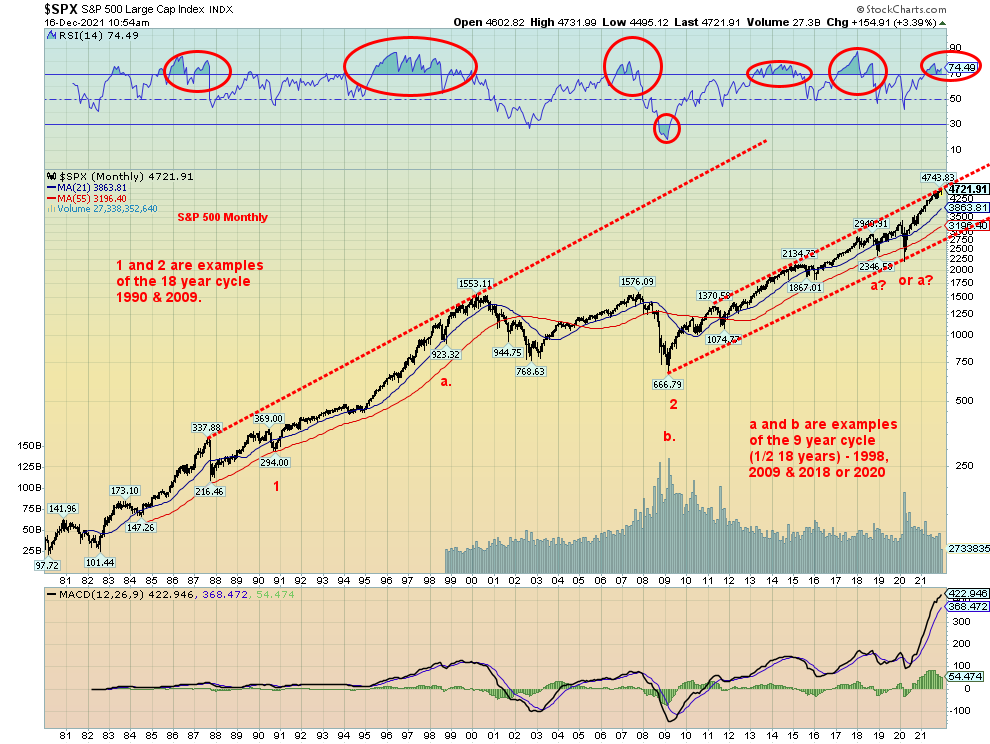
Next up is the stock market. We are using the S&P 500 as our illustration for the stock market. Ray Merriman of www.mmacycles.com has noted that the stock market tends to follow an 18-year cycle. 18 years is common denominator for the 90-, 72-, and 36-year cycles. The 90-year cycle, of which there are very few observations, last bottomed in 1932, The next one is due 2022 but it could range from 2020–2037. The 72-year cycle has occurred four times with a range of 73–77 years. The last one occurred in 2009 which was 77 years from the previous one 1932. The 36-year cycle also last bottomed in 2009 with the previous one seen in 1974. 2009 was 35 years from 1974. So, all of this tells us we could be poised to move into the 90-year cycle low. On the other hand, we are still in the early stages of the 72-year cycle. One positive, one negative. The last 18-year cycle was also in 2009 with the previous one seen in either 1987 or 1990. The next one is due 2027–2029 but could be as early as 2025. It could also coincide with a 90-year cycle low.
Shorter cycles are a 6-year cycle (1/3 of 18 years). From 2009 we had an important cycle low 2015/2016. The next one is due in 2021–2023. Four-year cycles are also noted and again from 2009 we had important lows in 2011, 2015/2016, and 2020. The next one could be due in 2023–2025. So, there is a lot of overlap pointing to important lows sometime over the next year or two. In the interim there is nothing stopping the stock markets rising once again to new highs. However, as we note on the chart of the S&P 500, we have hit the top of a bull channel. So, we are more likely to pull back than to see a big advance at this time. And, given the cycles, the likelihood is we could see an important low in 2022.
Note how overbought the S&P 500 is given a monthly RSI consistently over 70 for the past number of months. Yes, we can stay that way as previous overbought periods suggest, but once we fall the decline tends to be steep. Previous periods of extreme overbought monthlies saw the S&P 500 fall 33.5% in 1987, 36.8% in 2002, and 56.8% in 2009. Even the last decline in March 2020 saw the S&P 500 fall 33.9% after spending several months in overbought territory. Our expectations for the next major decline would be at least 30% to 50%, starting sometime in 2022 but not necessarily bottoming in 2022.
Source: www.stockcharts.com
What are the risks for 2022? We see them as follows: geopolitical risk, interest rate risk, China slowdown risk, COVID variants, domestic politics risk and social unrest, climate change risk, and cyberwars risk.
Geopolitical risk
With both the U.S. and China vying for global supremacy, the risk of the U.S./China relationship deteriorating further is quite high. There are also tensions with Russia over the Ukraine/Russia dispute. While many analysts put a low probability of Russia invading Ukraine or China invading Taiwan, if those events happened then that could have huge disruptions on markets. There is more risk of the conflict between the U.S. and China deepening than there is of an invasion. We have already seen the negative fallout from the trade wars unleashed by former President Donald Trump. We note that President Biden has not reversed those tariffs. Sanctions remain on many individuals, particularly Russians. There are growing attempts to remove Russia or China or both from the global payments system known as SWIFT. China and Russia are already working on an alternative to SWIFT. Already we have seen negative impacts on the technology sector as the U.S./China cold war heats up. Disputes could negatively impact consumer or industrial sectors as we have already seen with supply-chain disruptions. China is too important in the global economy to try to choke them off as it could force many countries to either choose the U.S. or China or try to find a way to please both.
Interest rate risk (monetary policy)
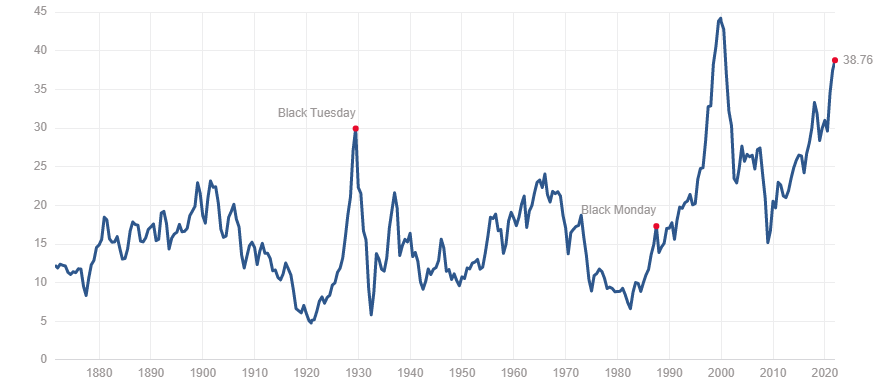
We live in an extremely debt-heavy world. There is now an estimated $280 trillion to $300 trillion in global debt outstanding. The U.S. Federal debt now surpasses $29 trillion and total U.S. debt (governments, corporations, households) exceeds $85 trillion the highest for any country in the world. A 25 bp hike in rate could in theory cost the U.S. government annually $725 billion. If there are three rate hikes, the cost could be as high as $2.2 trillion. That is an upper range as not all the debt comes due in 2022. Regardless of this, interest rate hikes to combat inflation in 2022 could prove devastating for the economy. The Fed is signalling that they are taking away the “punch bowl”. Given that U.S. stock price-earnings are at or near record levels, interest rate hikes could trigger a shock and then a stock market crash. We note that the current Case-Shiller PEs are higher today than they were before the 1929, 1987, and 2008 stock market crashes. The only time they were higher was before the 2000–2002 dot.com/tech crash. We are already seeing falling consumer confidence, which in turn could dampen retail sales and especially the housing market. Even if they hike rates, it is not a guarantee that it will quell inflation, at least not immediately. Stagflation could be order of the day: an economy with elevated inflation and stagnant GDP growth. However, all this could be good for gold although not necessarily immediately.
Shiller PE Ratio
Source: www.multpl.com
China slowdown risk
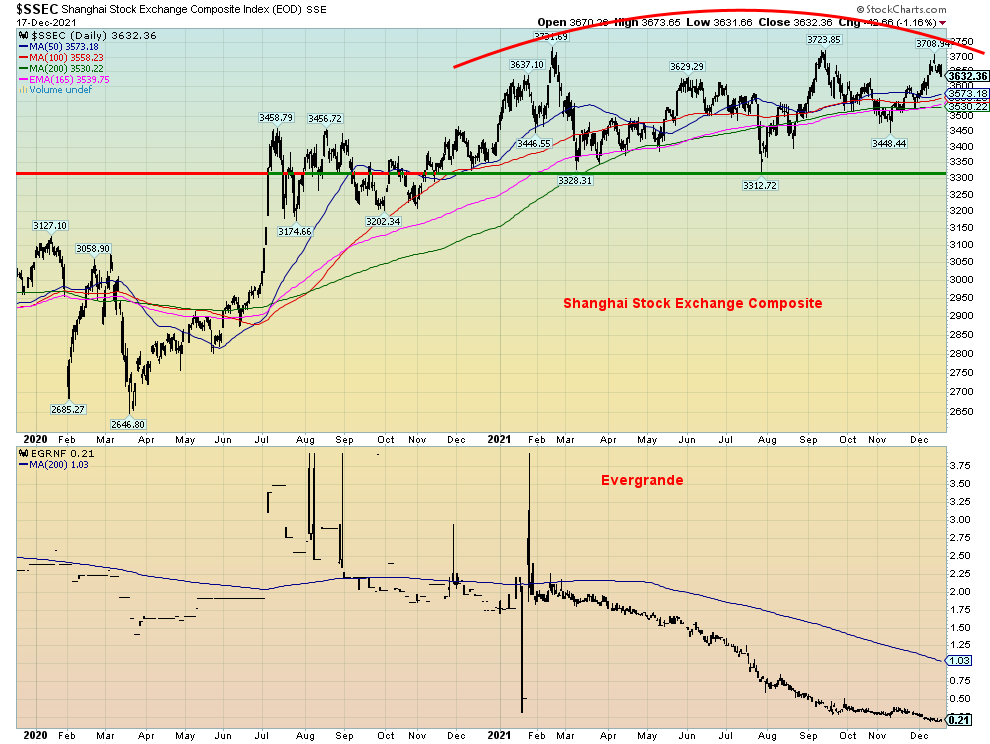
Evergrande has already missed payments on $300 billion of debt. They have moved into default territory. Other Chinese property developers are right behind them. Chinese property giants are a huge part of China’s economy. The good news is that the Chinese government, along with PBOC, have considerable room to cushion or even bail out the sector. A series of defaults could therefore prove more devastating and harder to control. With the property giants wavering or failing, that could spark a crash in the housing market, which would in turn could negatively impact China’s shadow banking system. A Chinese economy turning down could have global ramifications. Demand for commodities could then suffer. China’s Shanghai Composite (SSEC) appears to be making a potential huge topping pattern. The breakdown point is around 3,300.
Source: www.stockcharts.com
COVID variants risk
Delta, Mu, and Omicron are already in the COVID dialogue. Pandemics morph. Historically, pandemics have lasted years, even decades but in a rolling fashion where they ebb and flow. We have already seen that as we enter what may either be the fourth or fifth wave—or is it the third? Vaccines work, but if the COVID keeps morphing, vaccines may have trouble keeping up with the changes or may stop working all together. A reminder that there has never been an effective vaccine developed against HIV/AIDS. HIV/AIDS has killed an estimated 36 million since roughly 1980. Separate counts for the COVID virus have indicated the death toll may already be as high as 15/16 million. The official death toll is currently 5.3 million, including over 800 thousand in the U.S. alone. The U.S. could surpass one million dead by April/May 2022 at current rates. As well, with climate change there is concern that the melting Arctic permafrost could unleash new diseases kept under wraps for centuries. If the current virus morphs further and sparks more shutdowns, that could have a negative impact on the economy and could also spark more social unrest. Social unrest for the most part emanates from the unvaccinated.
Domestic politics risk
There has been a steady rise in nationalism and far-right parties over the past decade in Europe and the U.S. There has also been a rise in far-left movements. That could intensify as the pandemic rages on. According to Our World in Data (www.ourworldindata.org), the global population living in a democracy has plunged to 32% from levels over 50% in the past decade. We note from the chart below that previous periods of falling democracy seem to coincide with social unrest, economic uncertainty, and war. Two stand out on the chart. The period from roughly 1920 to 1950 saw democracy fall along with a roaring stock market (Roaring Twenties), the rise of fascism, the Great Depression, and World War II. A blip was seen in the late 1970s. That coincided with the Arab Oil Crisis, the end of the Vietnam War, domestic unrest in the U.S. as a result of the Vietnam War and racial unrest, the Watergate crisis, and ended with the 1979 Iranian hostage crisis. Stocks performed poorly during that period while gold and commodities rose.
The current collapse is more recent, but we have already seen the pandemic along with rising nationalism and unrest in both Eastern and Western Europe, Latin America, the Middle East, Africa, and the U.S. In the U.S. the tensions are between the political parties and the former president’s claim that the 2020 election was stolen. Unrest culminated in the January 6, 2020 assault on the Capitol to overturn the election in Trump’s favour. Tension is rising as the investigation continues into the January 6 attack. Arrests have been made and prison sentences handed out. Many high-profile persons subpoenaed by the Committee have refused to appear and as a result been charged with contempt of Congress, a criminal offense. But many are predicting that 2022 could be very difficult, indicating that assaults on U.S. democracy could occur again, especially with the midterms coming in November 2022. Polarization in the U.S. has become deeply entrenched. Widespread unrest could lead to government collapses and panicking investors, sparking a stock market sell-off and interrupting international capital flows. That in turn would endanger any global recovery.
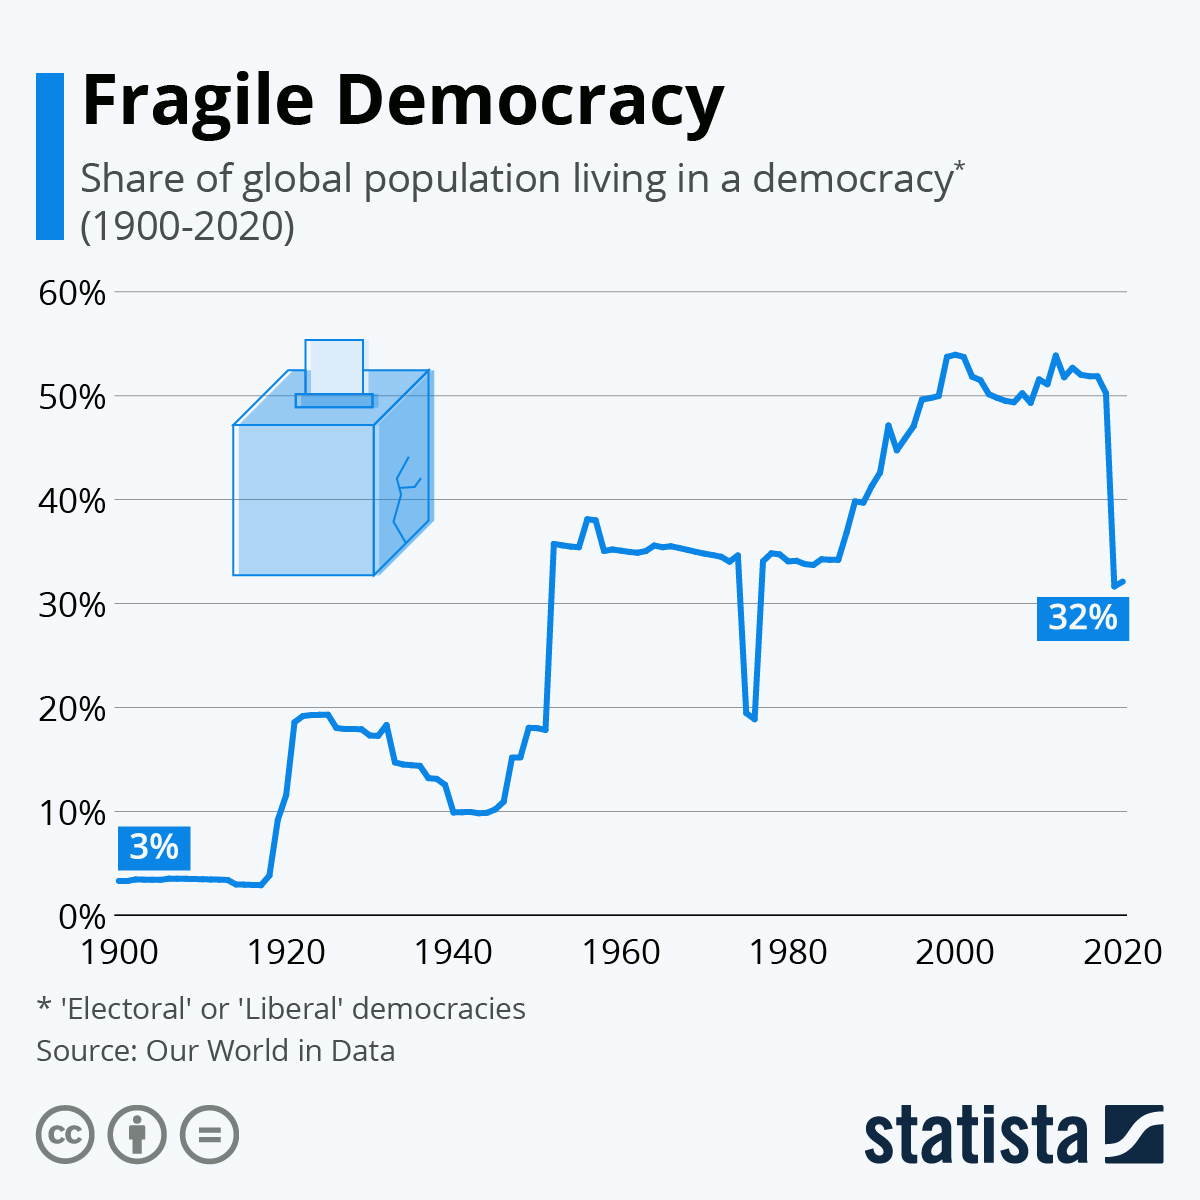
Source: www.statista.com, www.ourworldindata.org
Major volcanic eruptions, killer tornadoes, heat domes sparking record temperatures, raging wildfires, raging floods, killer hurricanes/cyclones, severe winter storms, drought, humanitarian disasters, and earthquakes—the world has experienced all of them in 2021. And, yes, we have experienced them in the past. Climate change models had pointed to increased frequency and ferocity of all these events as the earth’s temperatures rise. The oceans are also rising as a result of melting icecaps. What will 2022 bring? Costs to deal with these extreme weather events could be in the trillions. Costs to mitigate and control these events also faces costs that could be in the trillions. The former could ultimately be more expensive than the latter. Already the world is dealing with hundreds of thousands of refugees, if not millions (climate refugees?), including rising homelessness here in Canada and the U.S. as a result of devastating wildfires, floods, tornadoes, and hurricanes.
Potentially, the biggest risk is increased droughts. So far, there have been few but the potential for more severe droughts is rising. With droughts also come water shortages. Already we have seen growing water shortages in southern Europe, the Mediterranean, Southwest U.S., and southern Africa. These are the bread baskets of the world. If they fail, global agriculture prices could rise precipitously, especially for crops that are highly irrigated. Droughts also displace people who then flee to regions not impacted by droughts. Their numbers could be in the millions. The cost of climate change is rising and the worst could be yet to come. Yet the world fiddles while it burns.
Note in the chart below the rise in temperatures from roughly 800 AD to 1000 AD or so was known as the Medieval warming. It was during this period that Mayan civilization collapsed, most likely due to periods of long droughts. The long temperature decline that ran from roughly the 14th through to the 19th century was known as the Little Ice Age. During that period, numerous plagues were recorded from the Black Death to the Bubonic plague and more. The warming we are currently experiencing got underway with the start of the industrial revolution.
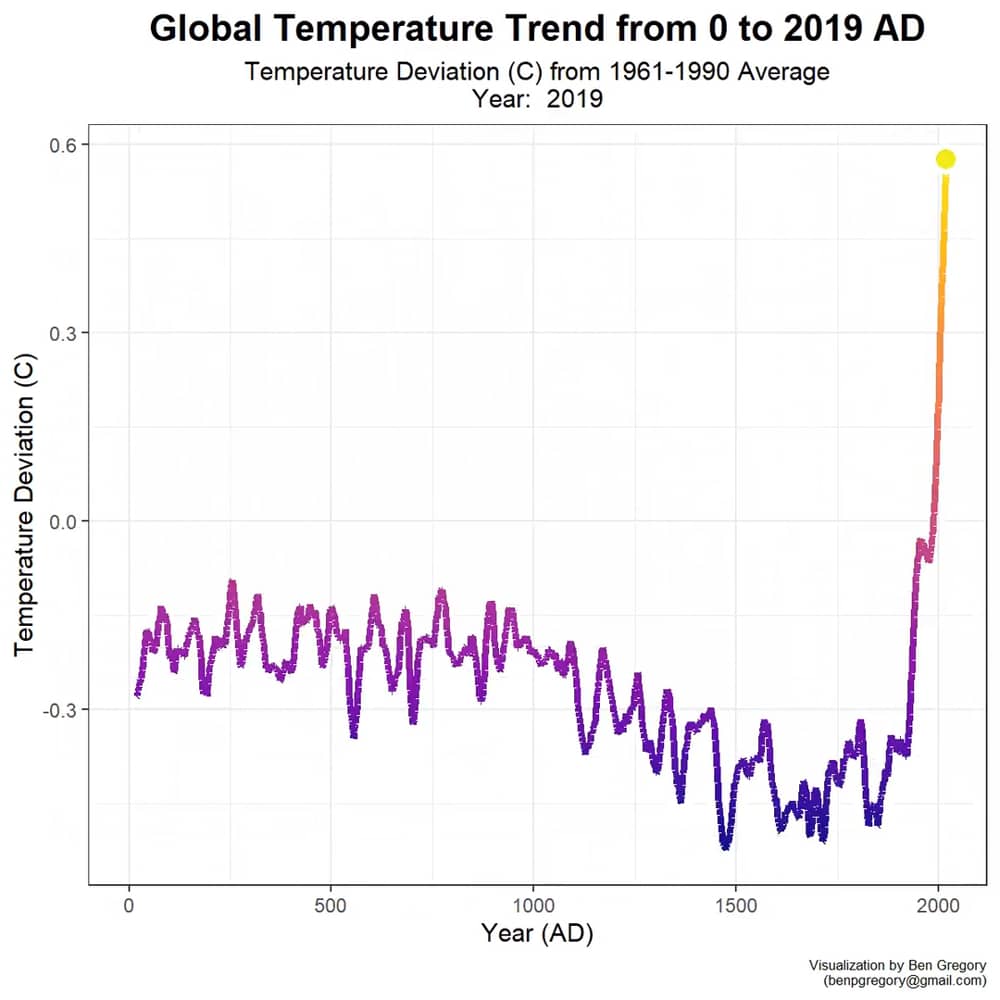
Source: www.visualcapitalist.com
Cyberwars risk
Geopolitical conflict is giving way to a new form of warfare. Cyberwar! In 2021 there have already been cyber attacks on government agencies, banks, defense installations, and high-tech companies. The Centre for Strategic & International Studies (CSIS) (www.csis.org) has identified over 100 cyber attacks in 2021 alone. Amongst the many attacked in the past year are: business, telecom companies, internet companies, central banks, water supplies, atomic energy plants, nuclear installations, universities, defense contractors, law firms, infectious disease researchers, policy think tanks, legislative bodies, transportation companies and authorities, media companies, hospitals, pipelines, and airlines. Add in political figures, activist groups, and political opponents and cyberwar attacks are already a major problem. Attackers can be professional hackers with no particular political motive or individuals with possible government involvement. Identifying the attackers is very difficult. Instead of military conflict, we get cyberwarfare. It’s cheaper and it can be more deadly, especially if the target is a country’s infrastructure such as electricity or water. What would happen if the national grid were shut down? Not only could it severely disrupt business and banking, but it could spark a stock market panic. Cyber attacks are on the rise and no country or government is safe from them, as attacks can come from all sides in the geopolitical wars.
Conclusions
Like it or not, 2022 is shaping up to be potentially a very difficult year. Over the past number of weeks, we have noted numerous growing negative divergences in the stock markets. Deteriorating stock market breadth, divergences with the advance-decline line, and other indicators could already be showing up in a declining stock market. Gold’s sudden rise this past week coupled with falling yields in the bond market could be reflective of a move to potential safe havens. Volatility is on the rise. Defensive measures are paramount.
“The only function of economic forecasting is to make astrology look respectable.”
- John Kenneth Galbraith, Canadian-American economist, diplomat, public official, intellectual, author The New Industrial State (1967) + others, U.S Ambassador to India 1961-1963, professor economics Harvard University, Princeton University, University of California Berkley; 1908-2006
MARKETS AND TRENDS
|
|
|
|
% Gains (Losses) Trends
|
|
||||
|
|
Close Dec 31/20 |
Close Dec 17/21 |
Week |
YTD |
Daily (Short Term) |
Weekly (Intermediate) |
Monthly (Long Term) |
|
|
Stock Market Indices |
|
|
|
|
|
|
|
|
|
S&P 500 |
3,756.07 |
4,620.64 |
(1.9)% |
23.0% |
neutral |
up |
up |
|
|
Dow Jones Industrials |
30,606.48 |
35,365.44 |
(1.7)% |
15.6% |
down (weak) |
up |
up |
|
|
Dow Jones Transports |
12,506.93 |
15,828.97 |
(3.5)% |
26.6% |
down |
up |
up |
|
|
NASDAQ |
12,888.28 |
15,169.68 |
(3.0)% |
17.7% |
down |
up |
up |
|
|
S&P/TSX Composite |
17,433.36 |
20,739.01 |
(0.7)% |
19.0% |
down |
up |
up |
|
|
S&P/TSX Venture (CDNX) |
875.36 |
893.78 |
(1.7)% |
2.1% |
down |
down |
up |
|
|
S&P 600 |
1,118.93 |
1,345.15 |
(2.4)% |
20.2% |
down |
down (weak) |
up |
|
|
MSCI World Index |
2,140.71 |
2,317.55 |
flat |
8.3% |
down (weak) |
down (weak) |
up |
|
|
NYSE Bitcoin Index |
28,775.36 |
46,437.09 |
(3.4)% |
61.4% |
down |
neutral |
up |
|
|
|
|
|
|
|
|
|
|
|
|
Gold Mining Stock Indices |
|
|
|
|
|
|
|
|
|
Gold Bugs Index (HUI) |
299.64 |
247.52 |
2.3% |
(17.4)% |
down |
down |
neutral |
|
|
TSX Gold Index (TGD) |
315.29 |
284.93 |
4.3% |
(9.6)% |
neutral |
down |
neutral |
|
|
|
|
|
|
|
|
|
|
|
|
Fixed Income Yields/Spreads |
|
|
|
|
|
|
|
|
|
U.S. 10-Year Treasury Bond yield |
0.91 |
1.41% |
(5.1)% |
55.0% |
|
|
|
|
|
Cdn. 10-Year Bond CGB yield |
0.68 |
1.32% |
(9.8)% |
94.1% |
|
|
|
|
|
Recession Watch Spreads |
|
|
|
|
|
|
|
|
|
U.S. 2-year 10-year Treasury spread |
0.79 |
0.77% |
(7.1)% |
(2.5)% |
|
|
|
|
|
Cdn 2-year 10-year CGB spread |
0.48 |
0.40% |
(17.2)% |
(16.7)% |
|
|
|
|
|
|
|
|
|
|
|
|
|
|
|
Currencies |
|
|
|
|
|
|
|
|
|
US$ Index |
89.89 |
96.55 |
0.5% |
7.4% |
up |
up |
up (weak) |
|
|
Canadian $ |
0.7830 |
0.7766 |
(1.2)% |
(0.9)% |
down |
down |
up (weak) |
|
|
Euro |
122.39 |
112.43 |
(0.7)% |
(8.1)% |
down |
down |
down (weak) |
|
|
Swiss Franc |
113.14 |
108.20 |
(0.4)% |
(4.4)% |
neutral |
down (weak) |
up |
|
|
British Pound |
136.72 |
132.38 |
(0.2)% |
(3.2)% |
down |
down |
up (weak) |
|
|
Japanese Yen |
96.87 |
87.93 |
(0.3)% |
(9.2)% |
up (weak) |
down |
down |
|
|
|
|
|
|
|
|
|
|
|
|
|
|
|
|
|
|
|
|
|
|
Precious Metals |
|
|
|
|
|
|
|
|
|
Gold |
1,895.10 |
1,804.90 |
1.1% |
(4.8)% |
neutral |
neutral |
up |
|
|
Silver |
26.41 |
22.53 |
1.5% |
(14.7)% |
down |
down |
up (weak) |
|
|
Platinum |
1,079.20 |
934.50 |
flat |
(13.4)% |
down |
down |
neutral |
|
|
|
|
|
|
|
|
|
|
|
|
Base Metals |
|
|
|
|
|
|
|
|
|
Palladium |
2,453.80 |
1,784.80 |
2.0% |
(27.3)% |
down |
down |
neutral |
|
|
Copper |
3.52 |
4.30 |
0.2% |
22.0% |
down |
neutral |
up |
|
|
|
|
|
|
|
|
|
|
|
|
Energy |
|
|
|
|
|
|
|
|
|
WTI Oil |
48.52 |
70.72 |
(1.3)% |
45.8% |
down |
neutral |
up |
|
|
Natural Gas |
2.54 |
3.69 |
(6.0)% |
45.3% |
down |
neutral |
up |
|
Source: www.stockcharts.com, David Chapman
Note: For an explanation of the trends, see the glossary at the end of this article.
New highs/lows refer to new 52-week highs/lows and, in some cases, all-time highs.
Copyright David Chapman, 2021
|
GLOSSARY Trends Daily – Short-term trend (For swing traders) Weekly – Intermediate-term trend (For long-term trend followers) Monthly – Long-term secular trend (For long-term trend followers) Up – The trend is up. Down – The trend is down Neutral – Indicators are mostly neutral. A trend change might be in the offing. Weak – The trend is still up or down but it is weakening. It is also a sign that the trend might change. Topping – Indicators are suggesting that while the trend remains up there are considerable signs that suggest that the market is topping. Bottoming – Indicators are suggesting that while the trend is down there are considerable signs that suggest that the market is bottoming. |
Disclaimer
David Chapman is not a registered advisory service and is not an exempt market dealer (EMD) nor a licensed financial advisor. He does not and cannot give individualised market advice. David Chapman has worked in the financial industry for over 40 years including large financial corporations, banks, and investment dealers. The information in this newsletter is intended only for informational and educational purposes. It should not be construed as an offer, a solicitation of an offer or sale of any security. Every effort is made to provide accurate and complete information. However, we cannot guarantee that there will be no errors. We make no claims, promises or guarantees about the accuracy, completeness, or adequacy of the contents of this commentary and expressly disclaim liability for errors and omissions in the contents of this commentary. David Chapman will always use his best efforts to ensure the accuracy and timeliness of all information. The reader assumes all risk when trading in securities and David Chapman advises consulting a licensed professional financial advisor or portfolio manager such as Enriched Investing Incorporated before proceeding with any trade or idea presented in this newsletter. David Chapman may own shares in companies mentioned in this newsletter. Before making an investment, prospective investors should review each security’s offering documents which summarize the objectives, fees, expenses and associated risks. David Chapman shares his ideas and opinions for informational and educational purposes only and expects the reader to perform due diligence before considering a position in any security. That includes consulting with your own licensed professional financial advisor such as Enriched Investing Incorporated. Performance is not guaranteed, values change frequently, and past performance may not be repeated.
About the author


Website: https://www.enrichedinvesting.com
Disclaimer: David Chapman is not a registered advisory service and is not an exempt market dealer (EMD) nor a licensed financial advisor. We do not and cannot give individualised market advice. David Chapman has worked in the financial industry for over 40 years including large financial corporations, banks, and investment dealers. The information in this newsletter is intended only for informational and educational purposes. It should not be considered a solicitation of an offer or sale of any security. The reader assumes all risk when trading in securities and David Chapman advises consulting a licensed professional financial advisor before proceeding with any trade or idea presented in this newsletter. David Chapman may own shares in companies mentioned in this newsletter. We share our ideas and opinions for informational and educational purposes only and expect the reader to perform due diligence before considering a position in any security. That includes consulting with your own licensed professional financial advisor.