
“The first panacea for a mismanaged nation is inflation of the currency; the second is war. Both bring temporary prosperity; both bring permanent ruin. But both are the refuge of political and economic opportunists.”
—Ernest Hemingway, American novelist, short-story writer, journalist, 1954 Nobel Prize in Literature, author of For Whom the Bell Tolls (1940) and many others; 1899–1961
“If you can’t deal with emotion, get out of trading.”
—J. Welles Wilder, Jr., American mechanical engineer, real estate developer, technical analyst creator of several technical indicators, including the Relative Strength Index (RSI); 1935–2021
“Knowing others is intelligence; knowing yourself is true wisdom. Mastering others is strength; mastering yourself is true power.”
—Lao Tzu aka Laozi aka Li Er, Ancient Chinese Taoist philosopher, Shaolin monk, contemporary of Confucius, founder of philosophical and religious Taoism, composed the Tao Te Ching, became an immortal hermit or God of the celestial bureaucracy; born 6th century BC, died 5th century BC
Well, hasn’t this been a fun week…^NOT. Overall, however, it did not seem to impact markets that much as we actually ended the week up, or down only slightly, despite some gyrations. Well, not everybody. Gold was slaughtered. After all, we’ve had that famous “golden cross”, an indicator many love to follow even as it is a lagging one. Gold, silver, and a number of indices all had seen the “golden cross” (50-day MA crossing above both the 100-day and 200-day Mas).
First, the Fed raised 25 bp as was widely expected. And, while Fed Chairman Jerome Powell delivered a speech that hovered between hawkish and dovish, initially the market liked it. The only thing the Fed did not do was essentially signal a pause in rate hikes as did the Bank of Canada (BofC) earlier. More rate hikes are undoubtedly on the way and even 5.25% now seems to be in trouble. The ECB and the BOE both followed this week with 50 bp rate hikes. Who suffered the most this past week? Well, gold and the precious metals in particular did not like the rate hikes after initially responding positively—then things turned really nasty afterward and the job numbers finished them.
Oh yes, the job numbers (Canada is out next week). The market was totally shocked—or was it astonished—on Friday when the Bureau of Labour Statistics (BLS) reported that January’s nonfarm payrolls rose by a staggering 517,000, well above the expected gain of 188,000. As well, the previous two months were revised upward by 71,000. It was the biggest jump in NFP since February 2022. Nowhere did we see anyone predict a number like that.
The unemployment rate (U3) fell to 3.4%, despite the labour force participation rate (LFPR) rising to 62.4% from 62.3%. That unemployment number is now below where it was in February 2020 (the pre-COVID number) and is the lowest since 1969. Normally, a higher LFPR translates into a higher unemployment rate. But lo, we looked over at the U6 unemployment rate (U3 plus short term discouraged and other marginally attached workers, and those forced to work part-time who would like full-time) rose to 6.6% from 6.5%. The Shadow Stats (SS) (www.shadowstats.com) unemployment (U6 plus those defined out of the labour force in 1994) was 24.5% vs. 24.4%. U3 down, but U6 and SS up? In many ways, the U6 and the Shadow Stats unemployment are a better measurement of the real employment situation. No problem. Markets pay attention to the U3, not U6 or SS. The U.S. dollar soared, bond yields rose, gold plunged, and the stock markets were mixed. Or maybe it was the stock markets were just confused. After all, rising employment is good for the economy. But it also means the Fed might hike rates more.
ECB and BOE Interest Rate 2013–2023
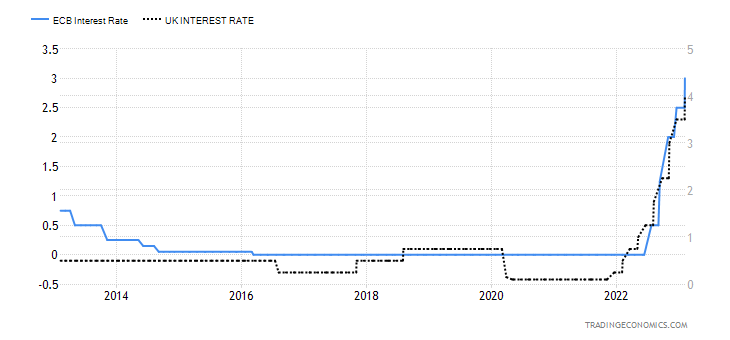
Source: www.tradingeconomics.com, www.ecb.europa.eu, www.bankofengland.co.uk
In trying every month to sort out the divergences in the employment numbers, sometimes we think we need a PhD to interpret the BLS’s numbers. While nonfarm payrolls rose 517,000, the labour force rose 866,000. Part of that is explained by a jump in not in the labour force category that rose 271,000. But then employed full-time jumped 278,000 and part-time employment was up a staggering 606,000. The numbers don’t jive. The total eligible population that could work (including retirees, etc.) jumped 1,118,000 in January. A staggering number that begs the question—where did they all come from? (Source: www.stlouisfed.org, www.bls.gov).
The jump in part-time work is most likely due to the service sector adding 397,000 jobs. That’s up sharply from November (187,000) and December (226,000) and is mostly in leisure and hospitality. But what is really confusing is that, earlier in the week, the ADP employment number came in at 106,000, well below the
expected 178,000. The Chicago PMI reading was 44.3, in line with the prediction of 45. But below 50 suggests we are in recession territory. The Consumer Confidence Index (not to be confused with the Michigan Sentiment Index) came in at 107.1, below the expected 109. But weekly jobless claims fell further to 183,000, below last week’s 186,000 and the consensus of 200,000. So, what gives? None of this adds up. Unless productivity is down. The numbers are at cross purposes to each other, with some saying strength while others are saying the economy is sliding. Which is it?
Average hourly earnings rose 0.3% on expectations, as did year-over-year earnings, up 4.4% (inflation is last at 6.5%). And, surprisingly, the average work week increased to 34.7 hours, up from 34.4 hours. Quits rose to 15.3% which is just below recent highs.
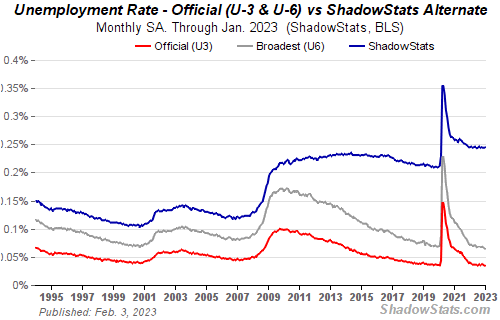
Source: www.shadowstats.com
We’ve noted this before that money supply and the Fed’s balance sheet continue to contract. That’s tightening and every time we’ve seen money supply contract along with the Fed balance sheet, either a slow down or outright recession follows.
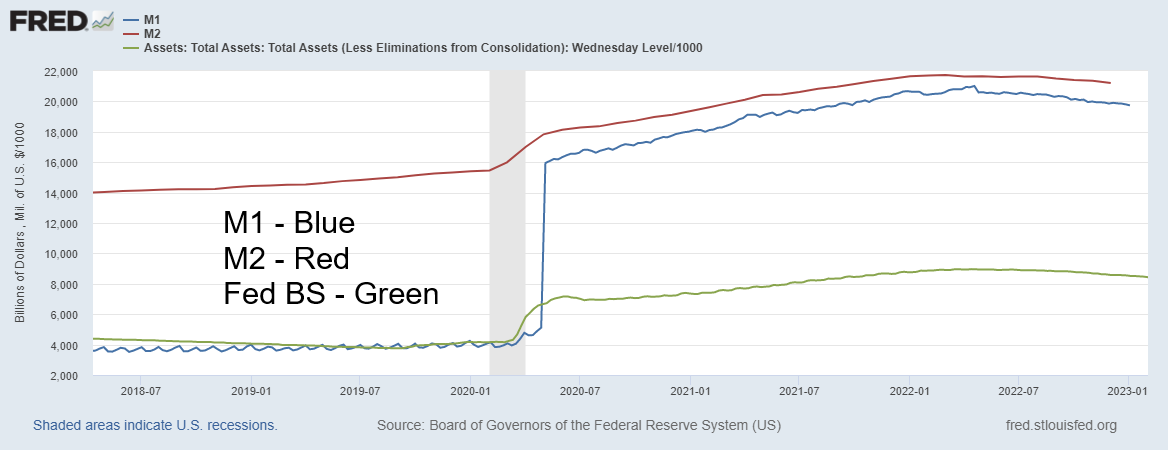
Source: www.stlouisfed.org
Since their respective peaks, M1 has declined over $1 trillion, M2 is down $532 billion, and the Fed balance sheet has contracted also $532 billion. Falling money supply and the Fed balance sheet should eventually contract the economy. Combine that with historical low velocity of money (how quickly money turns over in the economy) and it’s a deadly duo.
But money supply and the Fed’s balance sheet are not the only things falling. While the amount of federal debt keeps on rising, the amount held by foreign entities keeps on falling. As of November 2022, foreign holdings of U.S. debt have fallen to $7,273.6 billion from $7,732.1 billion a year earlier, a drop of $458.5 billion. The biggest drops have come from China, down $210.8 billion and Japan, down $246.4 billion. We raised this earlier, but with the new numbers out we note that China selling continues while Japan actually picked up a bit in November. Japan has most likely been selling to defend the yen. As Martin Armstrong (www.armstrongeconomics.com) noted, China does not want to be caught with a lot of U.S. treasuries if trouble breaks out between the U.S. and China. The Chinese balloon over the U.S. is the latest foray, although spying on one another is normal between big powers. That this has a negative impact on China’s balance of payments does not seem to be a concern.
Our chart on U.S. debt held by foreigners is below. While this chart only goes until Q3 2022, the trend is correct as foreign holdings fall and those held by private investors (mutual funds, pension funds, insurance companies, and depository institutions) go up. Also up are intragovernmental holdings (Social Security Trust, etc.)
U.S. Debt held by Foreigners and Private Investors 2018–2022
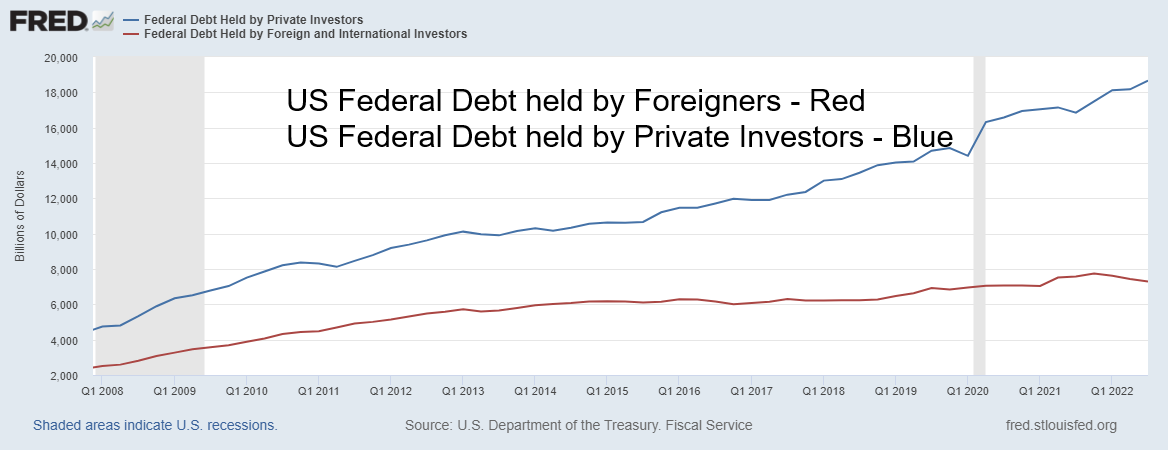
Source: www.stlouisfed.org
At the other end, central banks have been on a shopping spree for gold in 2022. In 2022 central banks purchased a 55-year high of 1,136 metric tonnes. The LBMA average price of gold in 2022 was $1,800/ounce. While central bank demand was up, jewellery demand was down. The expectation is that they’ll trade places in 2023, particularly with China re-opening. Most of the strong buying occurred in Asian markets, regardless of a drop in jewellery demand. The Middle East and Turkey, along with Central Asia, also had strong demand. Notable central bank buyers were the central banks of China, Turkey, Egypt, Kyrgyzstan, and Uzbekistan. While
central bank demand may soften in 2023, it is expected to remain high. As well, Russia and China continue to work on a gold-backed currency that could be ultimately a threat to U.S. dollar supremacy. Although this is nothing that is an immediate threat.
A summary of the S&P 500, US$ Index, gold, and oil and gas follows, followed by our usual Markets & Trends.
Source: www.stockcharts.com
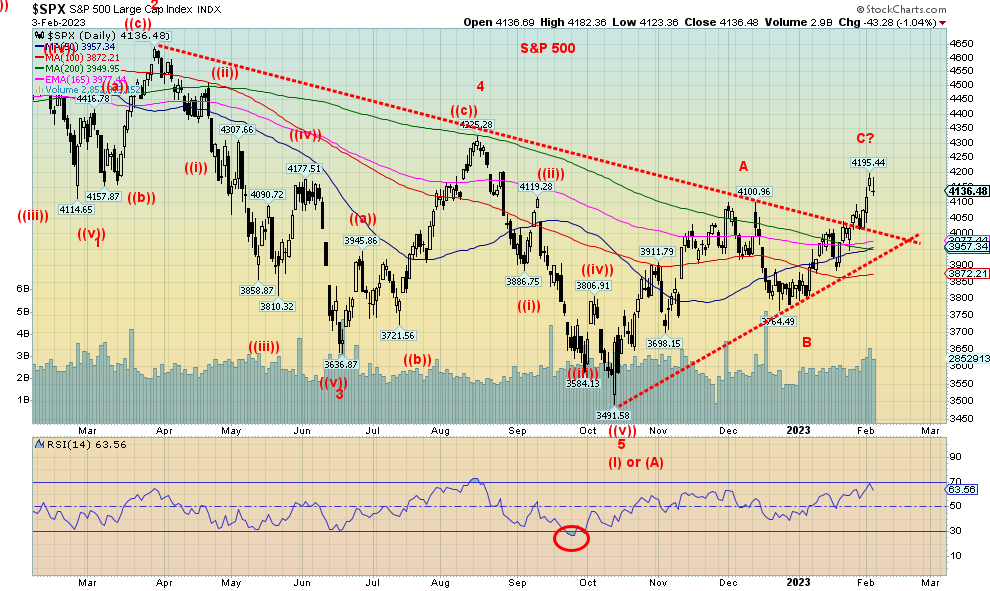
No, we can’t say we’ve topped, but Friday’s surprise nonfarm payrolls clearly put a damper on the market. The Fed hiked only 25 bp this week, although more hikes are to come. The next FOMC is not until March 21–22, the start of spring. The stock indices tried to hang in for a while after the release of the numbers, but eventually gave up the ghost and the Dow Jones Industrials (DJI) finished down some 127 points or 0.4%. Indeed, the DJI was the only index not in the green at the end of the week, losing 0.2%. The S&P 500 gained 1.6% but the Dow Jones Transportations (DJT) soared up 7.2% (a divergence with the DJI) while the NASDAQ gained a healthy 3.3%. That might have been helped along by the New York FANG Index that gained 7.0%. Meta was up a phenomenal 23.0% to lead the way.
The S&P 400 (Mid) gained 3.4% while the S&P 600 (Small) was up 5.0%. Bullishness was in the air as the Fear & Greed Index hit the extreme greed level (barely) at 76. We were seeing also sorts of bullish predictions. Our first thought was they are coming too soon. We are barely up from the lows seen in October and suddenly we are headed for new all-time highs against a debt limit war, a wobbly economy despite the robust job numbers, ongoing political divisiveness, and ongoing geopolitical tensions with Russia and China. Even we were going, what gives!
This kind of bullishness at this point seemed to be way ahead of itself. Some people described the market has becoming euphoric, even giddy. Following the horrible 2007–2009 financial crisis, we didn’t start see more bullishness until at least two or three years beyond the low of March 2009. Now we are seeing it not even six months from our low. This kind of euphoria at this stage is simply not sustainable. Nor is it like the 2020 pandemic where oodles of liquidity (QE) and zero percent interest rates triggered the huge rally to 2022. This time we are raising rates and the Fed is not finished. Money supply and the Fed balance sheet are contracting, not expanding. Money velocity is dragging along the bottom. Thoughts of a new great bull market appear to be very premature.
Elsewhere, the TSX Composite was up a small 0.2% but the TSX Venture Exchange (CDNX) lost 0.3%. We couldn’t help but notice that the TSX Consumer Discretionary Index (TCD) made fresh 52-week highs. In the EU, the London FTSE was up 1.8%, the EuroNext was up 1.6%, the Paris CAC 40 gained 1.9%, and the German DAX was up 2.2%. In Asia, China’s Shanghai Index (SSEC) was flat, the Tokyo Nikkei Dow (TKN) was up 0.5%, but the Hong Kong Hang Seng (HSI) was down 4.5%.
No, we can’t tell the market has topped just yet. But a decline below 4,000 would be negative and under 3,900 would be another bad sign. Below 3,800 the top is most likely in. We have, oddly, made what appears to us an ABC pattern. However, we can’t confirm as to whether the C wave is complete just yet. We always knew this was a bear market rally, but thought it could last longer and higher. What’s key is the nature of any pullback. Below 3,800 the rally is most likely over. Resistance is just above 4,200 but above that level we could run to 4,600. But the whole pattern is more corrective in nature than an indication we are starting a major bull market. And that the market as a whole is becoming too bullish too fast.
Incidently, the slaughter of the billionaires continues. This week it was Gautam Adani, one of the world’s richest men and head of the Adani Group of Companies, a monstrously huge Indian holding company. Mr. Adani allegedly lost $52 billion in less than a week (some reports say $100 billion), thanks to an attack by some short seller called Hindenburg. Adani joins Elon Musk and Sam Bankman-Fried as tarnished and humbled billionaires. Seems a lot of companies have exposure to Adani Enterprises so there could be more fallout yet. And there could be more billionaires humbled in coming days. What goes up comes down even faster.
Source: www.stockcharts.com
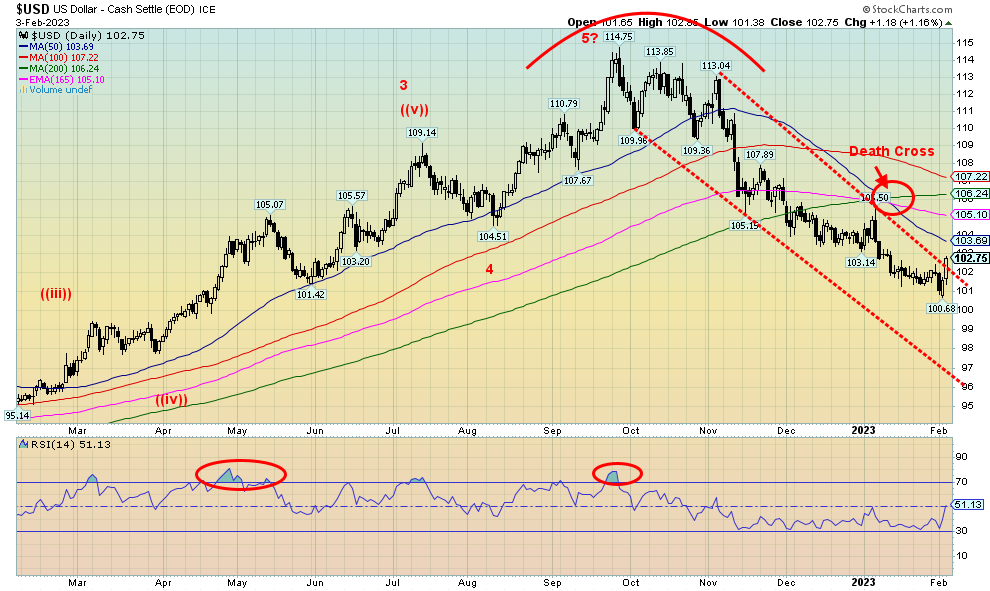
Following a lengthy drop, the US$ Index finally broke out of its downtrend this past week, thanks to the hugely better-than-expected nonfarm payrolls on Friday. On the week, the US$ Index rose 1.0%, the euro fell 0.6%, the Swiss franc was down 0.5%, the strike-and-recession-plagued U.K. dropped a sharp 2.8%, and the Japanese yen was off 1.0%. The Cdn$ also fell, down 0.7%. The US$ Index never got particularly oversold, but a rebound back towards the 200-day MA currently near 106 would not be a surprise. Given the “death cross” we saw, we don’t believe the decline of the US$ Index is over. But an overdue correction was probably going to happen. The trend for the US$ Index is still down, despite the rebound. The question is, is this a wave four correction or the start of a better rebound? We don’t know that yet.
Source: www.stockcharts.com
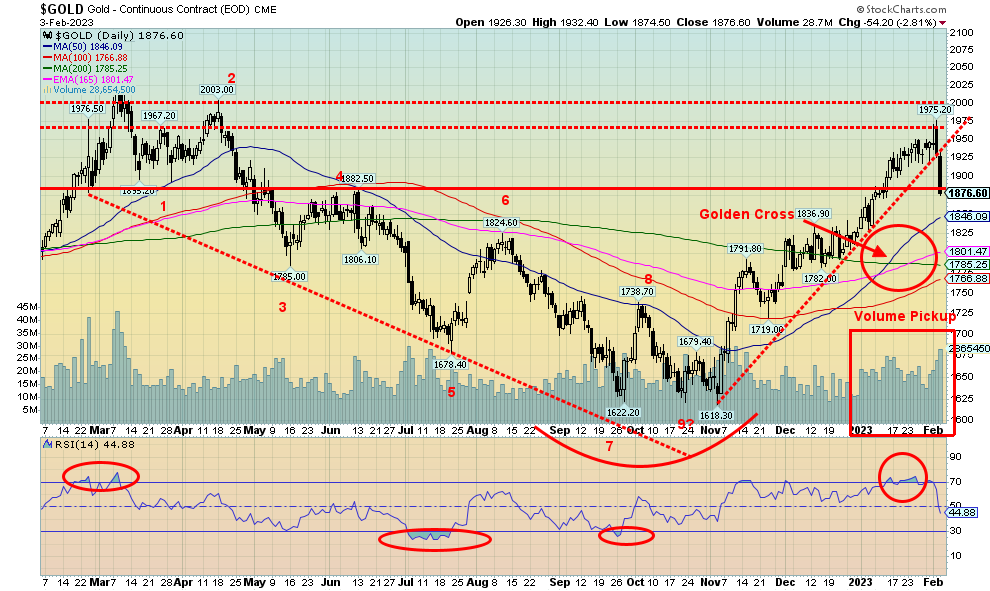
Ouch! That was nasty. $100 down on gold in two days. Suddenly, we had dancing in our memories the $200 plunge in gold April 12–15, 2013. That was the start of a long, drawn-out bear market for gold that didn’t see its final bottom until December 2015. We didn’t see a breakout to the upside from the morass until we had new highs in place in August 2020, although the breakout from a bottom pattern occurred a year earlier in July 2019. Grant you, we’ve seen these shakedowns before, especially during the year of the pandemic when gold plunged from $1,704 to $1,450 in a space of seven days at the height of the pandemic. But then everything went down, not just gold.
While gold in the end lost a more modest 2.7% on the week, silver was hammered, down 5.1%. Platinum also dropped 3.6%, palladium was actually up 1.2%, but copper lost 3.8%. The gold stock indices took a hit with the Gold Bugs Index (HUI) down 5.7% and the TSX Gold Index (TGD) off 5.1%. Surprisingly, the TSX Venture Exchange (CDNX), which is made up of at least 50% gold mining companies, was down only 0.3% on the week. Many junior miners barely budged.
Yes, we were overbought at the top with the RSI over 70. But we’ve seen huge overbought levels in gold before. The daily sentiment index (DSI) for gold did hit over 90, a level that has often seen tops. But the Gold Miners Bullish Percent Index (BPGDM) only hit a recent high of 55% and the pullback has seen it down to 51%. Not particularly bullish.
Admittedly, we saw no one predicting this kind of drop, although a few had noted we were getting overbought and due for a pullback. We were also at significant resistance in the $1,950/$1,975 zone, a level that if it could clear could signal new highs ahead.
We had been noting the ongoing divergence between gold and silver where gold was making new highs but silver was not. This eventually translated into the drop, albeit steeper than we believed. We broke uptrend lines for gold and fell out a what is now a topping pattern for silver. The gold stock indices had reached resistance levels but, as noted, were nowhere near overbought. We also had the infamous “golden cross” for both gold and silver. The trend was up.
So, where are we headed? While we’d love to say this was a vicious two-day drop and we should rebound, there are now targets below. Gold could next fall to $1,825/$1,840 and silver to $21.90/$22.00. We can see clearly the potential for gold to test the 200-day MA near $1,785 and silver to do the same near $21.00/$21.10. Some people accuse the central banks and bullion banks of coordinating against gold, but the evidence has always been sketchy. One thing for sure is this was not a sell-off of physical gold. It was a sell-off of paper gold, a market that is by most estimates anywhere from 200 to 250 times larger than the physical market. Paper drives physical, not the other way around.
The question we’ve continued to have on our mind is, did we ever see our 23.5-year and 7.83-year cycle low? Ideally, that cycle low is due during 2022–2025, but did we see it in November 2022 with gold at $1,618? Or is it yet to come? Unfortunately, we won’t know we could take out the low for gold at $1,618 and silver at $17.40 and we won’t know they are being challenged until we break down under $1,700 and $19.00 respectively. Danger zones would be seen for gold under $1,765 and silver under $21.00. We are not that far away. If we really are at the start of a new bear market for gold, then it has some time to run and could go a lot deeper.
The jobs number was a catalyst for the sell-off in gold. This raises the potential for more Fed hikes and if there is anything gold hates it’s Fed hikes. A soaring or at least a breakout on the US$ Index also weighed on gold. The US$ Index was also due for a correction. Wild bullish predictions as to where the price of gold and silver are going are clearly put on hold.
We did not see the usual CFTC report this past week. Apparently, that’s on hold. So, comments about the COT are also on hold.
Reasons for holding gold have not abated. We still have the ongoing debt limit fight, deeply divided U.S. politics, and geopolitical tensions with Russia and China. Gold is a hedge against loss of confidence in government more than it is a hedge against inflation.
Still, the drop this past week was a nasty surprise for many. And it may not be over. A bounce of some sort would be ideal. Even after the huge two-day plunge in April 2013, we had a decent rebound that recouped about half the drop over the next 10 days. Still, the drop this week shouldn’t be ignored. More downside could be yet to come. $1,950/$1,975 is clearly stiff resistance. But was it our top?
Source: www.stockcharts.com
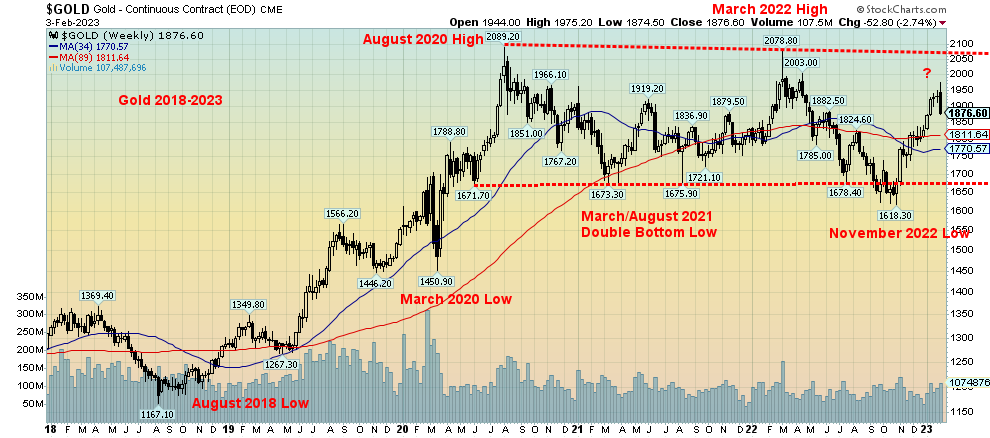
This is the gold chart that bothers us concerning gold’s next move. Gold’s cycles, for the most part work so one should not ignore them. Not shown is we had the last 7.83-year cycle low for gold at $1,045 in December 2015. The 7.83-year cycle breaks down into three 31.33-month cycle (range 26-37 months) or one-half cycle of 3.9-years. It’s not unusual to see both. The first 31.33-month cycle low came in August 2018 roughly 32 months following the December 2015 low. The March/August double bottom low came 31 months and 36 months after the August 2018 low. The next 31.33-month cycle low is due October 2023 +/- 6 months. If there was a half cycle low, that lines up nicely with the March 2020 pandemic low that came 51 months after the December 2015 low or 4.3-years. That puts the final low sometime around December 2023 which lines up nicely with the 31.33-month cycle.
The third cycle of 7.83-year cycle is usually the most bearish and this chart continues to suggest it is not in yet. The only way this could turn bullish is first we would have to make new all-time highs above $2,089 and that 34-month MA would have to cross back over the 89-month MA (Note: two Fibonacci numbers). The huge drop this past week is a bad sign. As well another bad sign was the breaking of the double bottom March/August 2021 low seen in November 2022. While gold didn’t break down then it may have been a harbinger. That we bounced back is moot if we turn down once again. We are currently potentially failing at a key zone that might suggest we could take out those highs. Now the focus has to change to the downside.
Targets for gold once we break under $1,675 could be down to around $1,250 with a minimum objective to around $1,425. Overall, the target range could go from $1,150 to $1,525 wide but all possible. We believe right now given what happened this week we should concentrate on protecting positions. Some positives we see is the fact that the junior market did not get that beat up this past week so the juniors may actually outperform. Once that low is in which would also be our 23.5-year cycle low it could then turn into a great buying opportunity for gold and the precious metals.
Source: www.stockcharts.com
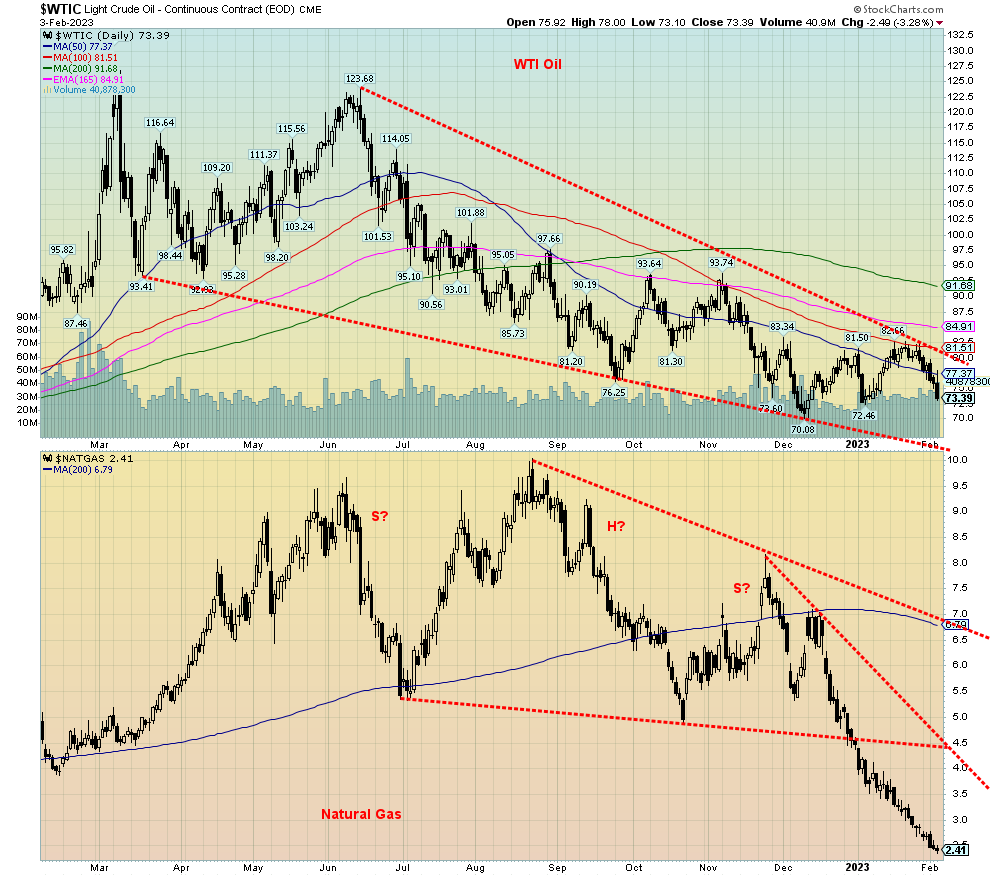
The bear market in both oil and gas continues. Despite the job numbers that should have been a delight to oil prices, it didn’t matter as WTI oil fell 3.3% on Friday and was down 7.9% on the week. Brent crude fared no better—well, maybe a little bit better, losing 4.7%. The depression in natural gas (NG) continued as NG once again hit 52-week lows, losing a whopping 15.4% on the week and is now down in just over a month, a huge 46.2%. EU NG at the Dutch Hub also hit new 52-week lows but rebounded by week’s end, gaining 4.5%. The energy indices didn’t fare any better with the ARCA Oil & Gas Index (XOI) off 7.7% and the TSX Energy Index (TEN) down 5.6%.
Feast or famine, it seems. Too much supply, at least at the moment, as stocks have been rebuilt and a very warm winter so far in the EU has conspired to see demand fall. We are having a cold spell here in North America that might help WTI oil and NG in the coming week. Oil is once again approaching the bottom of still what appears as a descending wedge triangle. But that bottom is now under $70. As for NG, we can’t even tell where the bottom is as it just goes down relentlessly. Oversold is merely a word. We have seen these kinds of plunges before for NG, most notably in 2012 and 2015. The RSI is at 21, but in 2015 it hit 17. Maybe more downside yet.
There is a looming EU embargo on Russian oil products, particularly diesel, so that might change the narrative yet. But the reality is that oil and gas especially are in bear markets and we can’t say with any clarity that we’ve hit bottom. One thing that was never particularly clear before is the possibility that, arguably, we made a huge head and shoulders top on NG. We say it wasn’t clear as that left shoulder that topped in June 2022 at $9.66 wasn’t that far from the actual top of $10.03 in August 2022. Technically not a double top as the second high was above the first high and usually it’s the other way around. But let’s say it was a H&S top. The target price was also a bit ridiculous, given it was effectively about $0.40, a price that has never been seen before. Also, there was the awkward, down-sloping neckline. Nonetheless, we thought we’d mention it. An interim price target that could be more reasonable is $2.05. We are not that far away.
At some point, the positive seasonals are sure to kick in and a rebound should get underway for both oil and gas. Meanwhile, enjoy the lower prices at the pump while you can.
Copyright David Chapman 2023
Markets & Trends
|
|
|
|
% Gains (Losses) Trends |
|
||||
|
|
Close Dec 31/22 |
Close Feb 3/23 |
Week |
YTD |
Daily (Short Term) |
Weekly (Intermediate) |
Monthly (Long Term) |
|
|
Stock Market Indices |
|
|
|
|
|
|
|
|
|
`S&P 500 |
3,839.50 |
4,136.48 |
1.6% |
7.7% |
up |
up |
up (weak) |
|
|
Dow Jones Industrials |
33,147.25 |
33,926.01 |
(0.2)% |
2.4% |
up |
up |
up |
|
|
Dow Jones Transport |
13,391.91 |
15,518.21 |
7.2% |
15.9% |
up |
up |
up |
|
|
NASDAQ |
10,466.48 |
12,006.96 |
3.3% |
14.7% |
up |
up |
neutral |
|
|
S&P/TSX Composite |
19,384.92 |
20,758.34 |
0.2% |
7.1% |
up |
up |
up |
|
|
S&P/TSX Venture (CDNX) |
570.27 |
620.09 |
(0.3)% |
8.7% |
up |
neutral |
down |
|
|
S&P 600 (small) |
1,157.53 |
1,310.80 |
5.0% |
13.2% |
up |
up |
up |
|
|
MSCI World Index |
1,977.74 |
2,156.81 |
1.3% |
9.1% |
up |
up |
up (weak) |
|
|
Bitcoin |
16,535.23 |
23,619.74 |
2.6% |
42.8% |
up |
up (weak) |
neutral |
|
|
|
|
|
|
|
|
|
|
|
|
Gold Mining Stock Indices |
|
|
|
|
|
|
|
|
|
Gold Bugs Index (HUI) |
229.75 |
243.87 |
(5.7)% |
6.2% |
neutral |
up |
neutral |
|
|
TSX Gold Index (TGD) |
277.68 |
291.17 |
(5.1)% |
4.9% |
neutral |
up |
neutral |
|
|
|
|
|
|
|
|
|
|
|
|
% |
|
|
|
|
|
|
|
|
|
U.S. 10-Year Treasury Bond yield |
3.88% |
3.52% |
0.3% |
(9.3)% |
|
|
|
|
|
Cdn. 10-Year Bond CGB yield |
3.29% |
2.92% |
0.7% |
(11.3)% |
|
|
|
|
|
Recession Watch Spreads |
|
|
|
|
|
|
|
|
|
U.S. 2-year 10-year Treasury spread |
(0.55)% |
(0.77)% |
(10.0)% |
(40.0)% |
|
|
|
|
|
Cdn 2-year 10-year CGB spread |
(0.76)% |
(0.90)% |
(12.5)% |
(18.4)% |
|
|
|
|
|
|
|
|
|
|
|
|
|
|
|
Currencies |
|
|
|
|
|
|
|
|
|
US$ Index |
103.27 |
102.75 |
1.0% |
(0.5)% |
down |
down |
up |
|
|
Canadian $ |
73.92 |
74.70 |
(0.7)% |
1.1% |
up |
down (weak) |
down |
|
|
Euro |
107.04 |
108.00 |
(0.6)% |
0.9% |
up |
up |
down |
|
|
Swiss Franc |
108.15 |
108.03 |
(0.5)% |
(0.1)% |
up (weak) |
up |
neutral |
|
|
British Pound |
120.96 |
120.55 |
(2.8)% |
(0.3)% |
down (weak) |
up |
down |
|
|
Japanese Yen |
76.27 |
76.23 |
(1.0)% |
(0.1)% |
up |
up |
down |
|
|
|
|
|
|
|
|
|
|
|
|
|
|
|
|
|
|
|
|
|
|
Precious Metals |
|
|
|
|
|
|
|
|
|
Gold |
1,826.20 |
1876.60 |
(2.7)% |
2.8% |
up (weak) |
up |
up |
|
|
Silver |
24.04 |
22.41 |
(5.1)% |
(6.8)% |
down |
up |
up (weak) |
|
|
Platinum |
1,082.90 |
980.30 |
(3.6)% |
(9.5)% |
down |
up |
up |
|
|
|
|
|
|
|
|
|
|
|
|
Base Metals |
|
|
|
|
|
|
|
|
|
Palladium |
1,798.00 |
1,618.40 |
1.2% |
(10.0)% |
down |
down |
down |
|
|
Copper |
3.81 |
4.06 |
(3.8)% |
6.6% |
up (weak) |
up |
up (weak) |
|
|
|
|
|
|
|
|
|
|
|
|
Energy |
|
|
|
|
|
|
|
|
|
WTI Oil |
80.26 |
73.39 |
(7.7)% |
(1.5)% |
down |
down |
up (weak) |
|
|
Nat Gas |
4.48 |
2.41 (new lows) |
(15.4)% |
(46.2)% |
down |
down |
down (weak) |
|
Source: www.stockcharts.com
Note: For an explanation of the trends, see the glossary at the end of this article.
New highs/lows refer to new 52-week highs/lows and, in some cases, all-time highs.
|
GLOSSARY Trends Daily – Short-term trend (For swing traders) Weekly – Intermediate-term trend (For long-term trend followers) Monthly – Long-term secular trend (For long-term trend followers) Up – The trend is up. Down – The trend is down Neutral – Indicators are mostly neutral. A trend change might be in the offing. Weak – The trend is still up or down but it is weakening. It is also a sign that the trend might change. Topping – Indicators are suggesting that while the trend remains up there are considerable signs that suggest that the market is topping. Bottoming – Indicators are suggesting that while the trend is down there are considerable signs that suggest that the market is bottoming. |
Disclaimer
David Chapman is not a registered advisory service and is not an exempt market dealer (EMD) nor a licensed financial advisor. He does not and cannot give individualised market advice. David Chapman has worked in the financial industry for over 40 years including large financial corporations, banks, and investment dealers. The information in this newsletter is intended only for informational and educational purposes. It should not be construed as an offer, a solicitation of an offer or sale of any security. Every effort is made to provide accurate and complete information. However, we cannot guarantee that there will be no errors. We make no claims, promises or guarantees about the accuracy, completeness, or adequacy of the contents of this commentary and expressly disclaim liability for errors and omissions in the contents of this commentary. David Chapman will always use his best efforts to ensure the accuracy and timeliness of all information. The reader assumes all risk when trading in securities and David Chapman advises consulting a licensed professional financial advisor or portfolio manager such as Enriched Investing Incorporated before proceeding with any trade or idea presented in this newsletter. David Chapman may own shares in companies mentioned in this newsletter. Before making an investment, prospective investors should review each security’s offering documents which summarize the objectives, fees, expenses and associated risks. David Chapman shares his ideas and opinions for informational and educational purposes only and expects the reader to perform due diligence before considering a position in any security. That includes consulting with your own licensed professional financial advisor such as Enriched Investing Incorporated. Performance is not guaranteed, values change frequently, and past performance may not be repeated.
About the author


Website: https://www.enrichedinvesting.com
Disclaimer: David Chapman is not a registered advisory service and is not an exempt market dealer (EMD) nor a licensed financial advisor. We do not and cannot give individualised market advice. David Chapman has worked in the financial industry for over 40 years including large financial corporations, banks, and investment dealers. The information in this newsletter is intended only for informational and educational purposes. It should not be considered a solicitation of an offer or sale of any security. The reader assumes all risk when trading in securities and David Chapman advises consulting a licensed professional financial advisor before proceeding with any trade or idea presented in this newsletter. David Chapman may own shares in companies mentioned in this newsletter. We share our ideas and opinions for informational and educational purposes only and expect the reader to perform due diligence before considering a position in any security. That includes consulting with your own licensed professional financial advisor.