
“There are three ways to make a living in this business: be first, be smarter, or cheat.”
—John Tuld, played by Jeremy Irons in Margin Call (2011)
“We live in an era of fraud in America. Not just in banking, but in government, education, religion, food, even baseball… What bothers me isn’t that is not nice. Or that fraud is mean. For fifteen thousand years, fraud and short-sighted thinking have never, ever worked. Not once. Eventually you get caught, things go south. When the hell did we forget that? I thought we were better than this, I really did.”
—Mark Baum, played by Steve Carell in The Big Short (2015)
“Bulls make money. Bears make money. Pigs? They get slaughtered.”
—Gordon Gekko, played by Michael Douglas in Wall Street: Money Never Sleeps (2010)
As was widely expected, the Fed hiked rates by 25 bp to the 5–5.25% range. With the last inflation rate also around 5% year over year (y-o-y), the two are now roughly equal. Does this guarantee that it will now bring the inflation rate down further to the Fed’s 2% range? Not necessarily. We still don’t have an official recession, but we continue to see signs that a recession is coming. The ECB also hiked rates again by 25 bp and were firmer than the Fed in signaling that there could be more rate hikes. They said, “We are not pausing.”
The Fed didn’t target much in its statement, providing little in the way of forward guidance. But that is not unusual. We received their usual non-committal response. The Fed still has a rather mixed picture on the economy and for whatever reason downplayed the banking crisis. Jobs still remain robust (see job numbers chart of the week) and inflation is down but sticky. Fed Chair Jerome Powell said they are prepared to do more if further rate rises are needed and data supports it. As we have often noted, the Fed is caught between two conflicting events. The Fed needs to balance the risks of tipping the economy into recession and deepening the banking crisis versus letting inflation flare up once again. Despite the musings of Powell, it is not surprising that we are seeing some analysts price in rate cuts later in 2023 and into 2024. A lot has to happen before that can occur, including a recession. But the hint is that the tightening cycle has ended.
Despite some continued good economic numbers, we do see signs of a coming recession. They are as follows:
- The ongoing inverted yield curve. Our two closely watched yield spreads are still deep in negative territory. The 2-year–10-year spread is negative 53 bp and the 3-month–10-year spread is worse at negative 179 bp. Although the latter spread may be impacted by the looming debt ceiling crisis as the 1-month–3-month spread is still in record-busting territory at negative 75 bp. Typically, however, a recession does not get underway until the yield curve begins to normalize.
- Consumer confidence remains at multi-year lows at levels last seen during the 1980–1982 recession and the 2007–2009 recession. And a recession hasn’t even officially started.
- Bond yields have fallen as the 10-year U.S. treasury note is down some 82 bp from its high. And, as our charts are showing, they appear to be forming a topping pattern in yields.
- Oil prices have fallen precipitously. A year ago, at the peak of the Russia/Ukraine war, WTI oil hit around $130. Today it is around $70. However, we recognize that events could change that quickly.
Copper prices have also fallen. They peaked at just over $5 in March 2022 and today sit around $3.85 and reached as low as $3.13 in July 2022. Are weak oil and copper prices presaging a recession?
- Money supply (M1), the Fed’s balance sheet, and bank deposits have all been contracting. M1 has contracted by over $2 trillion since April 2022; Fed assets are only off by roughly $400 billion since their peak, also in in April 2022, but are up over $200 billion from their lows as the banking crisis unfolded; commercial bank deposits have fallen about $1 trillion from their peak, also in April 2022, but money market funds are up in the same time period. The shift to money market funds is because of worries with the banks and also the potential for a looming debt ceiling crisis. See charts below.
- The banking woes are not over. Jamie Dimon, whose bank effectively purchased First Republic Bank, believes that "The current crisis is not yet over, and even when it is behind us, there will be repercussions from it for years to come." The latest is Pac West along with Western Alliance Bancorp, both experiencing problems not dissimilar to what brought down the other banks. Eventually, those feed back into the market, lowering confidence which in turns feeds into retail sales and more. According to some sources, there are some 200 regional banks in trouble in the U.S. But that is out of a universe of an estimated 4,844 FDIC insured banks in the U.S. The KBW Regional Bank Index (KRX) is down 28% in 2023 while the KBW Bank Index (BKX) is off 25%.
- The war that never ends continues, with accusations that Ukraine tried to assassinate Russia’s Putin. As well, we read in Eurasian newspapers plans by the U.S. to place nuclear subs in South Korea. This in turn could trigger a crisis similar to the Cuban missile crisis, as China objects.
- Manufacturing activity has slowed with a number of the PMIs coming in under 50, a level that signals contraction. However, the services PMIs remain above 50, which are a bigger driver of the economy than manufacturing.
- There are signs of rising unemployment. Weekly jobless claims broke out of a period where claims were in a range of 190,000 to 220,000. Now they are up around 230,000 to 245,000. New layoff announcements are coming almost daily but have yet to show up in the job numbers.
- Commercial real estate is struggling. Office buildings are only about 80% capacity, well below normal levels of about 4% vacancies. Plus, more buildings are coming on the market. In the U.S., almost a quarter of office buildings need to be re-mortgaged in 2023. Due to mature are some $450 billion. Defaults have already been announced, including Brookfield Corp., Pacific Investment Management, and Blackstone Inc. There could be more coming.
- Not only is commercial real estate struggling, but high interest rates are digging into consumers with upwards of a third of mortgages under water as housing prices fall. As well, many are rushing to extend the term to 30 years. Bankruptcies are rising, but are not yet at critical levels.
- The debt ceiling war is a big unknown. The clock is ticking on the debt ceiling, which could become a problem by early June. Bondholders, Social Security recipients, and the military may not get paid. Shutdown of all government departments and massive layoffs of government employees who then would no longer be paid is disruptive, even if temporary. But the real danger is a default on the debt
that would have global implications, potentially plunging the world into a severe financial crisis. Rising treasury yields and a falling U.S. dollar are merely two things that could then happen. But a U.S. debt default could reverberate through the global economy. A severe U.S. debt downgrade (imagine U.S. treasury debt with junk status) could follow.
Bank Deposits, Fed Assets, Money Market Funds, M1 2007–2023
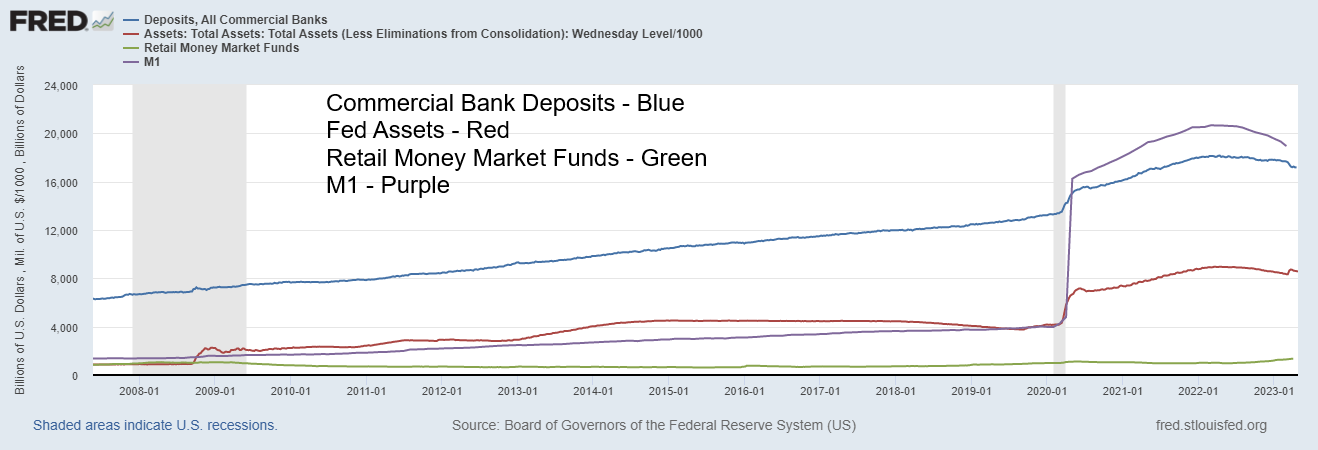
Source: www.stlouisfed.org
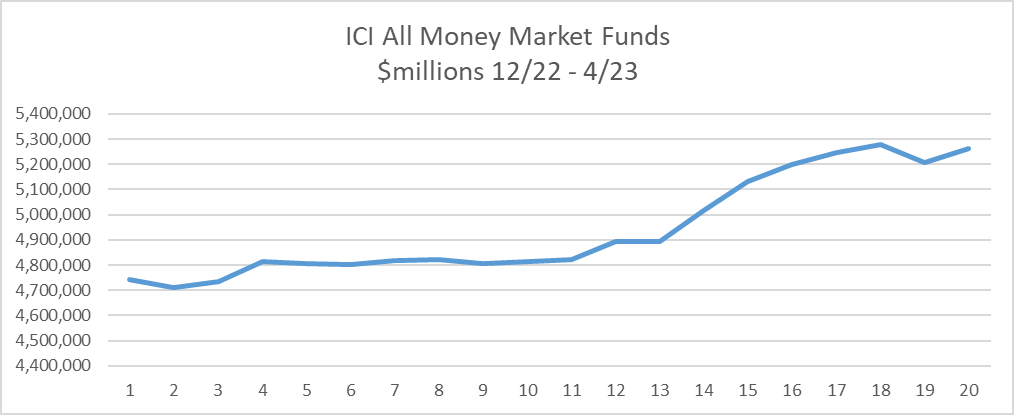
Source: www.ici.org
The Fed acknowledges that its tightening policies are causing some problems. The banking crisis is merely one of the most visible. The Fed even acknowledged that the banking crisis might help bring down inflation. The Fed also said as a result of the banking crisis it has contributed to “tighter credit conditions for households and businesses," which are "likely to weigh on economic activity, hiring, and inflation.”
As a result of the deepening banking crisis, banks are cutting back on lending and tightening credit conditions. This in turn could lead to a credit crunch. Cheap money and easy accessibility to debt gave rise to excessive risk-taking. In turn, that eventually led to inflation. All of these were the main drivers of the stock market, housing, and more bubbles that occurred between 2010 and 2022. That was especially the case after the 2020 pandemic recession. Did the Fed, along with other central banks, keep interest rates too low for too long and also keep the money spigots open too long, thus encouraging the risk-taking?
Inflation is not easy to conquer as they discovered in the 1970s. After a decade or so of low inflation during the 1950s and into the 1960s, inflation broke out and started rising in 1966. The event that may have started the rise in inflation was the onset of U.S. involvement in the Vietnam War, starting in 1965. War is inflationary. Our chart of long-term CPI below shows how inflation spiked during wars. Spikes were quite visible around the time of the American Revolution (1775–1783), the War of 1812–1814, the U.S.-Mexico War (1846–1848), the U.S. Civil War (1861–1865), World War I (1914–1918), and World War II (1939–1945).
J.P. Morgan Chase’s takeover of First Republic reminds our colleague Mike Ballanger of J.P. Morgan’s takeover of Bear Stearns in March 2008 as the financial crisis was unfolding. Six months later we had our Lehman Brothers moment and the stock market crashed 55%. Is our Lehman Brothers moment still to come? Or is all this like the Savings & Loan collapse in the late 1980’s/early 1990’s that led to 32% of all S&L’s disappearing. But the early 1990’s recession was mild. How many of the 4,000 plus regional banks will fail? And could they tip us into a recession?
Long Term CPI 1700–2020
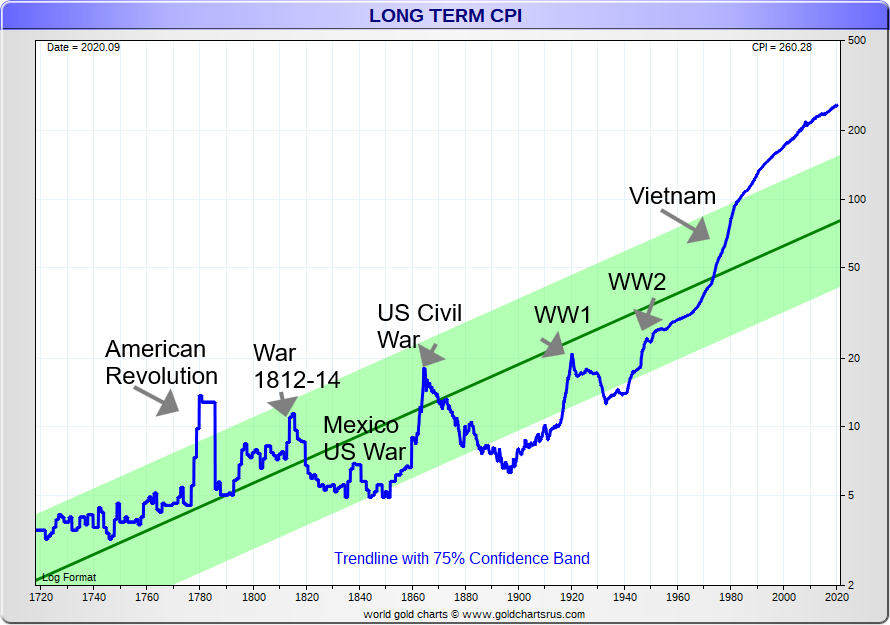
Source: www.goldchartsrus.com
Inflation briefly topped out in 1970 before abating during the early 1970s recession. However, it started to pick up again with the end of the gold standard and Bretton Woods, and with the Watergate scandal. Eventually, it was soaring as the Arab oil embargo got underway in October 1973. Once again, the recession of 1973–1975 helped bring down inflation, but then once again it went higher, culminating with the Iranian hostage crisis of 1979 that sent oil prices soaring. With Fed Chair Paul Volcker hiking interest rates to 20% and the steep recessions of 1980–1982, unemployment soared to almost 11%. Currently, inflation has been coming down, but could we have a second round of inflation, depending on how the Russia/Ukraine war unfolds? Or will it be something else?
While it is difficult to connect the two, we note the Fed did not start hiking interest rates until March 2022, a month after war broke out between Russia and Ukraine. Yet inflation had broken out in March 2021. Until the Fed started hiking rates, inflation was thought of as transitory. Did the outbreak of war change that? The Fed should be well aware of the history of inflation and war. However, they have no idea how long this war could last. Will others (NATO) become directly involved rather than being indirectly involved, as is the case now? That in turn could spark a global war.
Inflation and the Fed Rate 2007–2023
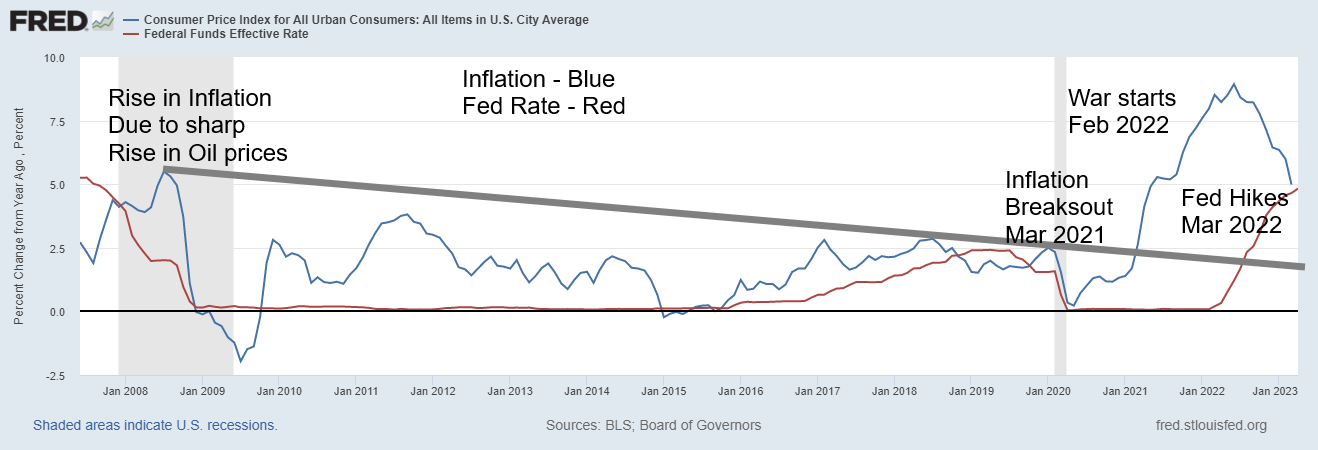
Source: www.stlouisfed.org
Inflation has come down but is still nowhere near Fed targets of 2%. There are signs of a slowing economy, but we are not yet in recession. Some believe we could have only a mild recession, while some believe no recession. Others believe we could be in for a hard landing. Years of excess beget years of hardship to balance things out. This time is not different. We are coming off years of excess that saw the stock market soar, housing prices soar, and manias abound in cryptocurrencies, meme stocks, and more. The years of excess are over. Interest rates are higher, credit is tighter, money is contracting, and the stock market and housing market have fallen. Cryptos and other manias crashed. War rages. Are the real hardships still to come?
Chart of the Week
US Job Numbers
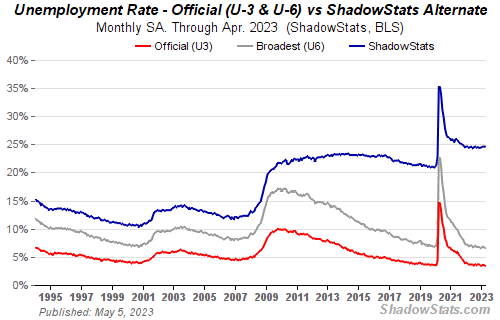
Source: www.shadowstats.com
One should never take anything for granted. After hearing about collapsing banks, major layoffs from tech companies, and continued signs that economy is weakening even if we are not in an official recession, the last thing anyone expected was a jump in employment. But that is exactly what we got. Forecasts of a gain of 180,000 nonfarm payrolls for March were shattered when the actual figure came in at a gain of 253,000. Helping a bit was a revision for March that dropped it to 165,000. Thoughts immediately turned to the Fed hiking interest rates again. The stock market jumped higher, the U.S. dollar was stronger, oil recovered, and bonds and gold sank. It’s the old boy scout motto—be prepared. Also, things sometimes are not what they seem. Don’t you just love the volatility.
The unemployment rate hit a 50 + year low at 3.4% (U3). We had to go back to 1969 to find an unemployment rate of 3.4%. The U6 unemployment rate (U3 plus all persons marginally attached to the labour force, plus total employed part time for economic reasons, as a percentage of the total labour force, plus all persons marginally attached) came in at 6.6% vs. 6.7% in March. The Shadow Stats (www.shadowstats.com) number (which is U6 plus those defined out of the labour force in 1994 revisions), those unemployed for one year or longer was unchanged at 24.6%.
Not helping was that average hourly earnings jumped 0.5% in April when they expected only a 0.3% gain. On a y-o-y basis, wages rose 4.4% after a 4.3% March gain and expectations of 4.2% gain. A 2% inflation rate that the Fed wants now seems further away. Wage growth is just too strong.
Then we have what we call weird numbers. According to data at FRED (St. Louis Fed), the civilian labour force actually contracted by 43,000. The total population level which is all over 16 years of age rose 171,000 and is up 6,815 thousand since February 2020. Yet the civilian labour force has grown at 177,770 only while those not in labour force is up 4,829 thousand since February 2020 and up 733,000 from March 2023. The total of those not in the labour force was 100,222 thousand with 58.1 million retirees and 25.3 million on disability and not in labour force.
The labour force participation rate was 62.6%, unchanged from March but down from 63.3% seen in February 2020. As well, the employment population ratio was 60.4%, also unchanged from March but down from 61.1% in February 2020. Fewer people participating in the economy does help lower the unemployment rate.
All of this is at cross purposes. Despite employment and wage gains, retail sales are tepid at best and worker productivity has been declining. Consumer spending has been declining as retail sales were negative in both February and March. The March 2023 y-o-y retail sales were 2.3%, the lowest level since the pandemic recession. Productivity has been declining for five straight quarters. That decline is the longest stretch recorded since they started tracking in 1948.
While part-time employment is not as high as it was before the pandemic, there is a heavy concentration of jobs in the leisure and hospitality sectors as well as growth in government employees, particularly state and local. Last month, full-time employment was up 161,000 while part-time fell 84,000. However, nonfarm payrolls were up? Reconciliation? Last month health and education gained 77,000 while leisure and hospitality were up 31,000.
All this good data helped the stock market jump. The FOMC doesn’t meet again until June 13–14. Certainly, the feeling is that the Fed will keep rates higher for longer. Many now don’t expect a recession until Q4. And risk is on again. Bank stocks jumped on Friday.
Canada Job Numbers
Canada, Employed Persons vs. Unemployed Persons 2018–2023
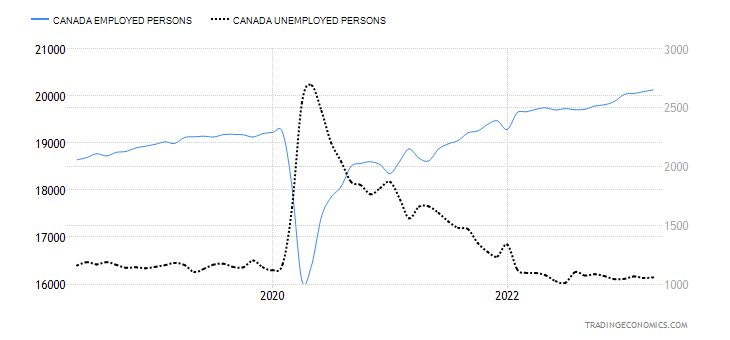
Source: www.tradingeconomics.com, www.statcan.gc.ca,
Not to be left out of the employment joy, Canada also beat employment estimates. Canada created 41,400 jobs in April, well above the forecasted 20,000. The cautionary note was, however, that full-time employment fell 6,200 while part-time employment jumped 47,600. Big gains were seen for wholesale and retail trade while business, building, and other support services were the losers. Average hourly wages were up 5.2% y-o-y. All this makes it harder for the Bank of Canada (BofC) to bring down interest rates. Wage growth is above the rate of inflation. The BofC might have to hike once again.
The unemployment rate continued at a multi-year low at 5%. They were actually looking for a slight rise to 5.1%. Last summer the official unemployment rate fell to 4.9%. The R8 unemployment rate (that adds in discouraged searchers, waiting groups, and a portion of involuntary part-timers) fell to 7.2% from 7.5%. The R8 rate is the highest level that Statistics Canada reports.
Canada, Employment Rate vs. Unemployment Rate 2018–2023
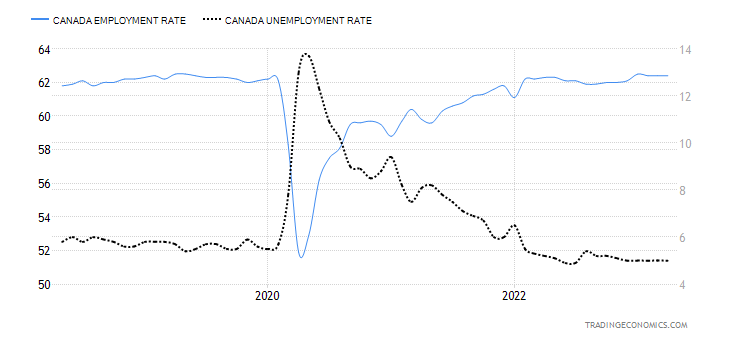
Source: www.tradingeconomics.com, www.statcan.gc.ca,
Markets & Trends
|
|
|
|
% Gains (Losses) Trends
|
|
||||
|
|
Close Dec 31/22 |
Close May 5/23 |
Week |
YTD |
Daily (Short Term) |
Weekly (Intermediate) |
Monthly (Long Term) |
|
|
Stock Market Indices |
|
|
|
|
|
|
|
|
|
`S&P 500 |
3,839.50 |
4,136.25 |
(0.8)% |
7.7% |
up |
up |
up (weak) |
|
|
Dow Jones Industrials |
33,147.25 |
33,674.38 |
(1.2)% |
1.6% |
up (weak) |
up |
up |
|
|
Dow Jones Transport |
13,391.91 |
14,123.13 |
0.72 |
5.5% |
neutral |
neutral |
up (weak) |
|
|
NASDAQ |
10,466.48 |
12,235.41 |
0.1% |
16.9% |
up |
up |
neutral |
|
|
S&P/TSX Composite |
19,384.92 |
20,542.03 |
(0.5)% |
6.0% |
up |
up |
up |
|
|
S&P/TSX Venture (CDNX) |
570.27 |
615.40 |
0.3% |
7.9% |
neutral |
neutral |
down |
|
|
S&P 600 (small) |
1,157.53 |
1,138.97 |
(0.8)% |
(1.6)% |
down |
down |
neutral |
|
|
MSCI World Index |
1,977.74 |
2,143.62 |
(0.3)% |
8.4% |
up |
up |
up (weak) |
|
|
Bitcoin |
16,535.23 |
29,298.33 |
0.2% |
77.2% |
up |
up |
neutral |
|
|
|
|
|
|
|
|
|
|
|
|
Gold Mining Stock Indices |
|
|
|
|
|
|
|
|
|
Gold Bugs Index (HUI) |
229.75 |
278.24 (new highs) |
6.8% |
21.1% |
up |
up |
neutral |
|
|
TSX Gold Index (TGD) |
277.68 |
332.64 (new highs) |
4.4% |
19.8% |
up |
up |
up |
|
|
|
|
|
|
|
|
|
|
|
|
% |
|
|
|
|
|
|
|
|
|
U.S. 10-Year Treasury Bond yield |
3.88% |
3.43% |
flat |
(11.6)% |
|
|
|
|
|
Cdn. 10-Year Bond CGB yield |
3.29% |
2.91% |
2.5% |
(11.6)% |
|
|
|
|
|
Recession Watch Spreads |
|
|
|
|
|
|
|
|
|
U.S. 2-year 10-year Treasury spread |
(0.55)% |
(0.48)% |
15.8% |
12.7% |
|
|
|
|
|
Cdn 2-year 10-year CGB spread |
(0.76)% |
(0.81)% |
2.4% |
(6.6)% |
|
|
|
|
|
|
|
|
|
|
|
|
|
|
|
Currencies |
|
|
|
|
|
|
|
|
|
US$ Index |
103.27 |
101.00 |
(0.4)% |
(2.2)% |
down |
down |
up (weak) |
|
|
Canadian $ |
73.92 |
74.84 |
1.2% |
1.2% |
up |
neutral |
down |
|
|
Euro |
107.04 |
110.19 |
flat |
2.9% |
up |
up |
down (weak) |
|
|
Swiss Franc |
108.15 |
112.32 |
0.5% |
3.9% |
up |
up |
up |
|
|
British Pound |
120.96 |
126.36 (new highs) |
0.6% |
4.5% |
up |
up |
down (weak) |
|
|
Japanese Yen |
76.27 |
74.16 |
(0.7)% |
(2.8)% |
down |
neutral |
down |
|
|
|
|
|
|
|
|
|
|
|
|
|
|
|
|
|
|
|
|
|
|
Precious Metals |
|
|
|
|
|
|
|
|
|
Gold |
1,826.20 |
2,024.80 (new highs) |
1.3% |
10.9% |
up |
up |
up |
|
|
Silver |
24.04 |
25.93 (new highs) |
2.8% |
7.9% |
up |
up |
up |
|
|
Platinum |
1,082.90 |
1,068.30 |
(2.0)% |
(1.4)% |
up (weak) |
up |
up |
|
|
|
|
|
|
|
|
|
|
|
|
Base Metals |
|
|
|
|
|
|
|
|
|
Palladium |
1,798.00 |
1,486.80 |
(1.5)% |
(17.3)% |
neutral |
down |
down |
|
|
Copper |
3.81 |
3.88 |
(0.3)% |
1.8% |
down |
up (weak) |
neutral |
|
|
|
|
|
|
|
|
|
|
|
|
Energy |
|
|
|
|
|
|
|
|
|
WTI Oil |
80.26 |
71.34 (new lows) |
(7.1)% |
(11.1)% |
down |
down |
neutral |
|
|
Nat Gas |
4.48 |
2.14 |
(11.2)% |
(52.2)% |
down |
down |
down |
|
Source: www.stockcharts.com
Note: For an explanation of the trends, see the glossary at the end of this article.
New highs/lows refer to new 52-week highs/lows and, in some cases, all-time highs.
Source: www.stockcharts.com
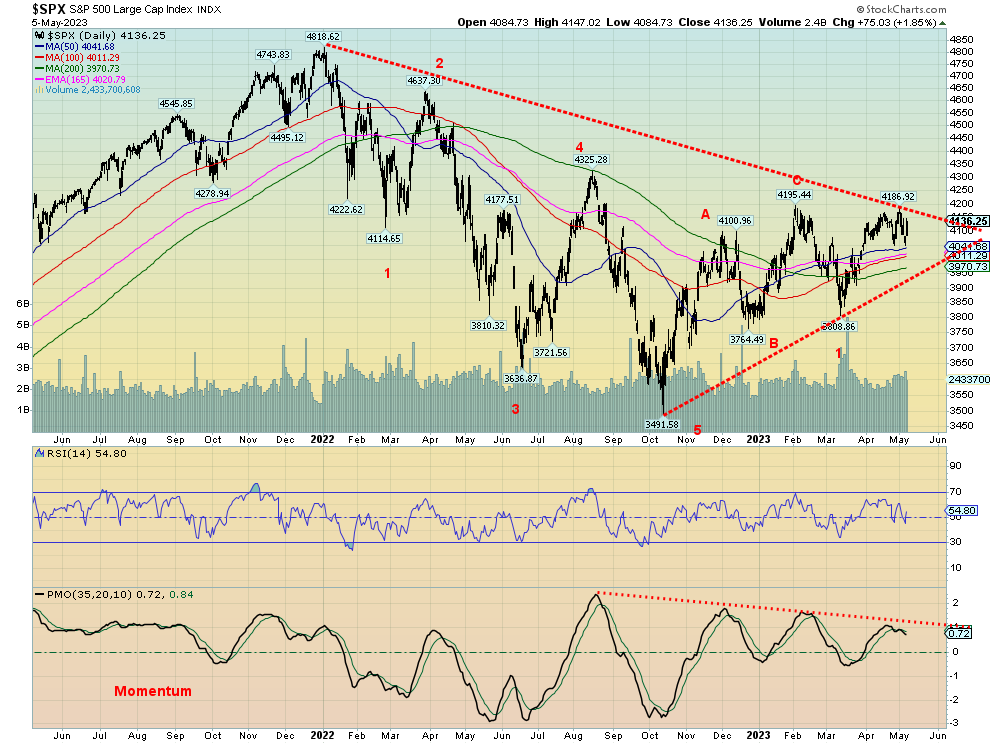
It was a rather mixed week for the stock market indices as some were up and some were down. But of the ones we follow, more were down. All this despite the stellar job numbers on Friday. Momentum continues to decline and appears to be rolling over once again, despite Friday’s gains. The S&P 500 lost 0.8% on the week and the Dow Jones Industrials (DJI) was off 1.2%; however, the Dow Jones Transportations (DJT) was up 0.7%. The NASDAQ gained a small 0.1%. But the smaller cap indices fared poorly with the S&P 400 (Mid) off 1.2% and the S&P 600 (Small) down 0.8%. Bitcoin waffled on the week, up a small 0.2%.
In Canada, the TSX Composite was down 0.5% but the TSX Venture Exchange (CDNX) gained 0.3%. In the EU, the London FTSE was down 1.2% (no, the coronation of Charles III did not help the market), the EuroNext was off 0.3%, the Paris CAC 40 down 0.8%, and the German DAX lost 0.2%. In Asia, China was closed for Chinese Labour Day (a week long, it seems), the Tokyo Nikkei Dow (TKN) jumped to 52-week highs up 1.0%, while Hong Kong’s Hang Seng (HSI) was up 0.8%. The MSCI World Index lost 0.3%.
As with other indices, the S&P 500 is trying to break out above the downtrend line from the January top. A firm break above 4,200 would do the trick. But, as we have noted, we are seeing numerous negative divergences between the index and indicators, fading momentum, indices moving higher but not being confirmed by new highs/new lows, sentiment remains high but not extreme bullishness. The move up from the October 2022 low suggests it is corrective in nature and not the start of a new bull market. The ongoing divergence between the large cap index S&P 500 and its junior counterparts S&P 400 and S&P 600 also suggests this is not a broad advance and is being led by only a few stocks, mostly in the high technology sector. A break of 4,000 would be negative and under 3,900 probably fatal and take us lower. Higher prices can’t be ruled out but the technicals are bearish.
Source: www.stockcharts.com
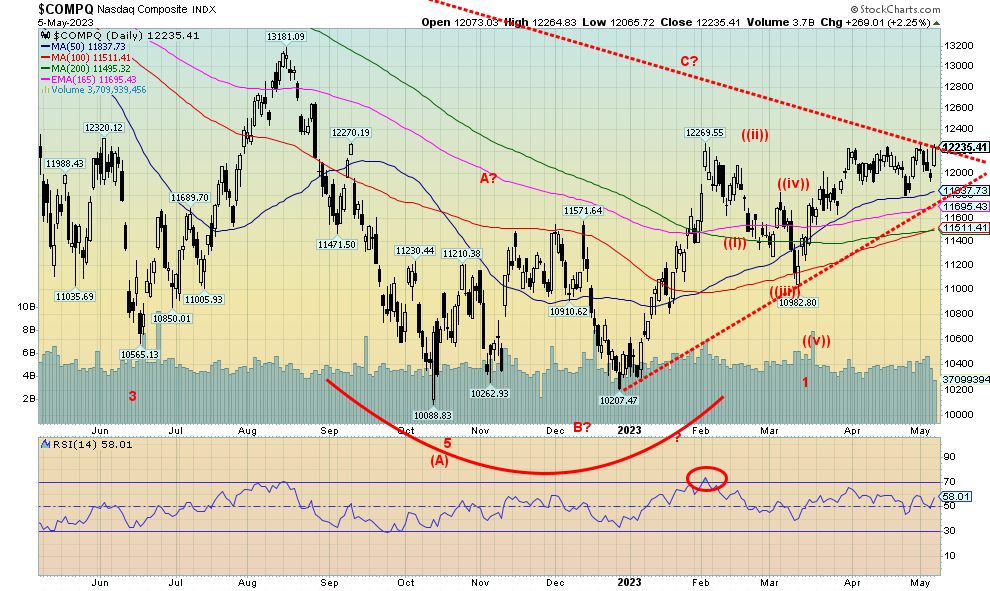
The NASDAQ keeps twigging that downtrend line from the top but has, so far, failed to break out. Volume is not impressive, so we could get a low volume breakout. But it might prove to be a false one. Looming higher is the breakdown zone, currently near 11,700. The final breakdown would be under 11,000. Under that level could suggest a retest of the October/December lows. Only a breakout above 13,200 and the August 2022 high might suggest a return to the all-time highs. The NASDAQ was up only 0.1% this past week and it took the job numbers on Friday to shift the index from down to up. So far, all we appear to be doing is making a potential double top as we remain just below that January high of 12,270. The NY FANG Index gained 0.7%, thanks once again to Microsoft jumping 1.1% to new all-time highs. The big winner on the week was Snowflake, thanks to the new AI craze, up 4.1%. The big loser was Meta (Facebook), losing 3.1%. Of the FAANG stocks, eight were up and five down. Technology continues to be the driver for the NASDAQ, but if they falter, look out below.
Source: www.stockcharts.com
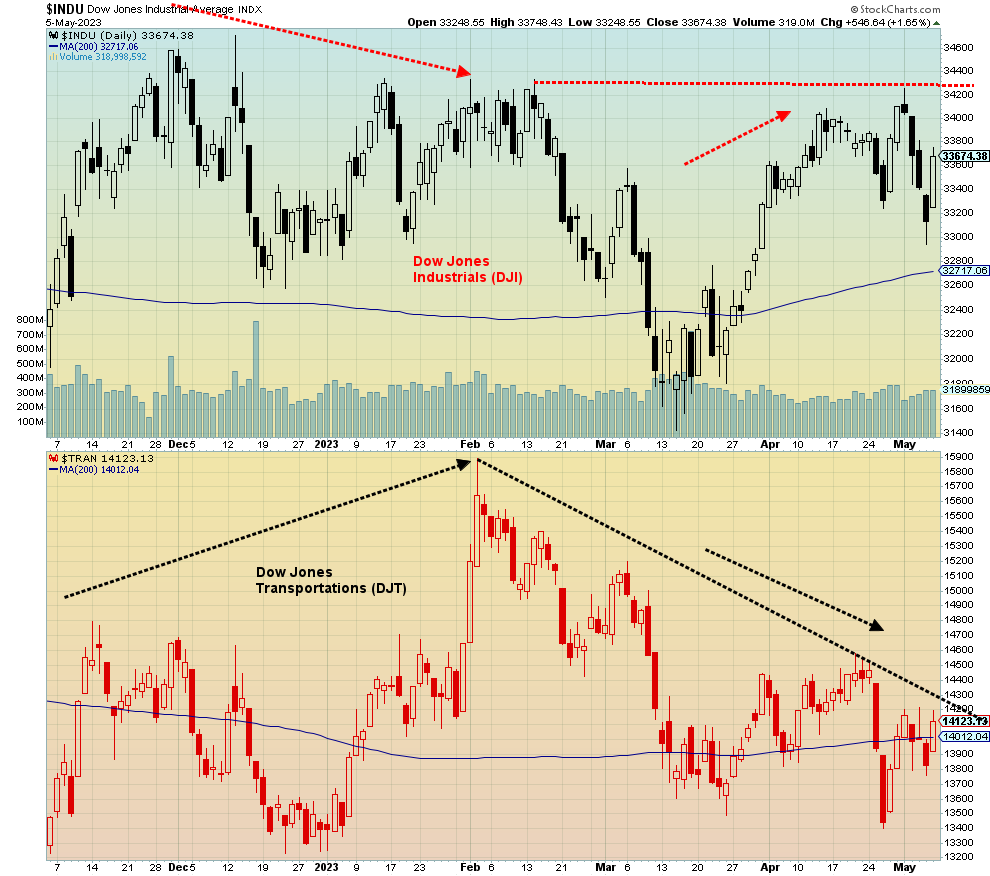
We have noted a number of negative divergences in the market. Here’s another one: the important relationship between the Dow Jones Industrials (DJI) and the Dow Jones Transportations (DJT). It’s not a clean one, but we can’t help but notice the DJI’s return to January/February highs while the DJT is nowhere near them. The averages should be confirming each other. They are not. We had earlier noted other divergences between the S&P 500 and the S&P 500 equal weight and the NASDAQ 100 and the NASDAQ 100 equal weight. The equal weight indices are consistently making lower highs than the weighted index. It’s a divergence that shouldn’t be ignored, as it all suggests that the next move should be down.
Source: www.stockcharts.com
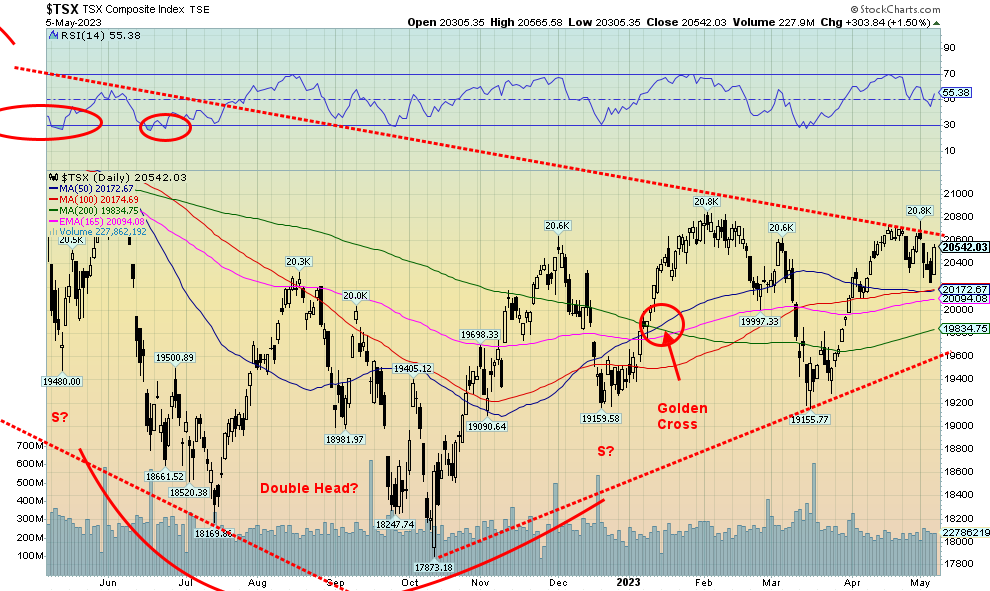
The TSX Composite lost 0.5% this past week. The TSX Venture Exchange (CDNX) gained up 0.3%. The CDNX continues to look like a huge buy and remains grossly undervalued, trading at roughly 20% of its all-time high. Yes, it’s down some 82% from that all-time high seen in 2007. We’re even down some 45% from the highs of 2020. Of the 14 sub-indices on the TSX, five were up and nine down. Leading the way was Information Technology (TKK), up 6.7% to new 52-week highs. Golds (TGD) were number two, up 4.4%. Leading the downward parade was Energy (TEN), off 5.4%. Real Estate (TRE) lost 3.1% as the REITS continue to suffer.
The TSX has failed thus far to break out over that downward-sloping trend line for the highs. As well, we could be making a double top with the high in January. A break now under 20,180 could send the index lower. We’d have to use that March low of 19,155 as our final line in the sand. If that breaks, the drop could take us to 18,000. The breakpoint is at 19,600. Only a firm breakout now above 20,800 could keep the bull alive and suggest higher prices.
U.S. 10-year Treasury Bond/Canadian 10-year Government Bond (CGB)
Source: www.tradingeconomics.com, www.home.treasury.gov, www.bankofcanada.ca
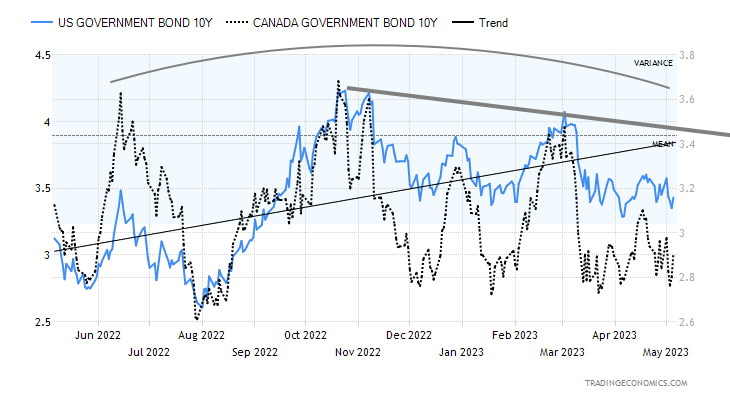
Bonds wiggled higher following the release of the April job numbers on Friday. However, they really didn’t get very far. The U.S. 10-year treasury note finished the week at 3.43%, exactly where it was a week earlier. Canada’s 10-year Government of Canada bond (CGB) wasn’t as lucky as it rose to 2.91% from 2.84%, a gain of 2.5%. The closely watched recession spreads remained about the same, the U.S. 2-year–10-year spread at negative 48 bp down from negative 51 bp and Canada’s 2–10 spread at negative 81 bp, down from negative 83 bp. While the job numbers drove the week there were a number of mixed signals on the economy once again. ISM manufacturing was recessionary, but ISM services remain in expansion; JOLTS job openings suggest they are contracting and we are reading about layoffs almost every day, but ADP unemployment and the April nonfarm coupled with another drop in unemployment (U3) were all bullish.
Bonds continue to make what we believe is a large topping pattern, but we need a breakdown under 3.00% for the U.S. 10-year to confirm. On the other hand, a breakout above 3.40% would be negative and imply higher yields. It is unknown at this time what the impact will be of the ongoing debt ceiling. Failure to pass one could lead to a rise in bond yields. A default would put them even higher.
Source: www.stockcharts.com
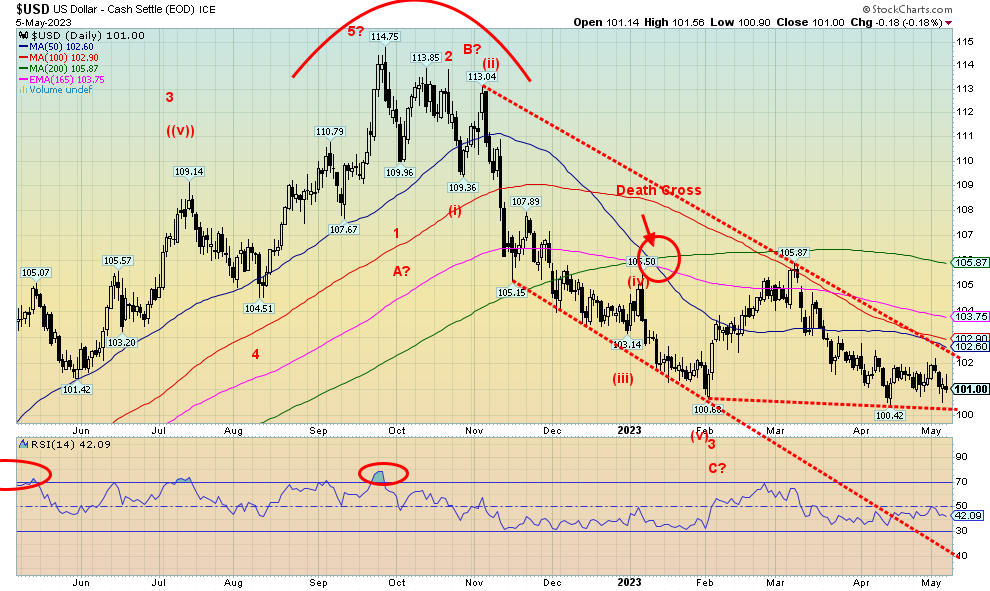
The US$ Index fell 0.4% this past week. Despite Friday’s better than expected job numbers, the US$ Index still fell. However, we continue to hang above key support near 100 and below a breakout at 102. We are perfectly poised between a breakdown or a breakout. The big winner on the week was the Canadian dollar, up 1.2%, thanks to stellar job numbers and rebounding oil prices. The euro was essentially flat, the Swiss franc was up 0.5%, the pound sterling jumped to new 52-week highs, up 0.6% on the week, with the only loser being the Japanese yen, off 0.7%. A sliding yen is not good for gold as the two are often correlated.
The pattern for us looks like a descending triangle (albeit an odd one), but we need to break down under 100 to prove it. Targets could then be as low as 95. That would be quite positive for gold. But before we hatch our chickens, a breakout above 102 could take us to that 200-day MA near 106. At that level the US$ Index would create what we call an ABC flat correction to the long decline from 114.75 to 100.68. That wave fell in what we believe was five waves. That suggests to us that the US$ Index is embarking on a major down wave. If that was the A wave (larger A), then we are forming the B wave. But a firm breakdown under 100 would suggest that B wave was complete with the high at 105.87.
Source: www.stockcharts.com
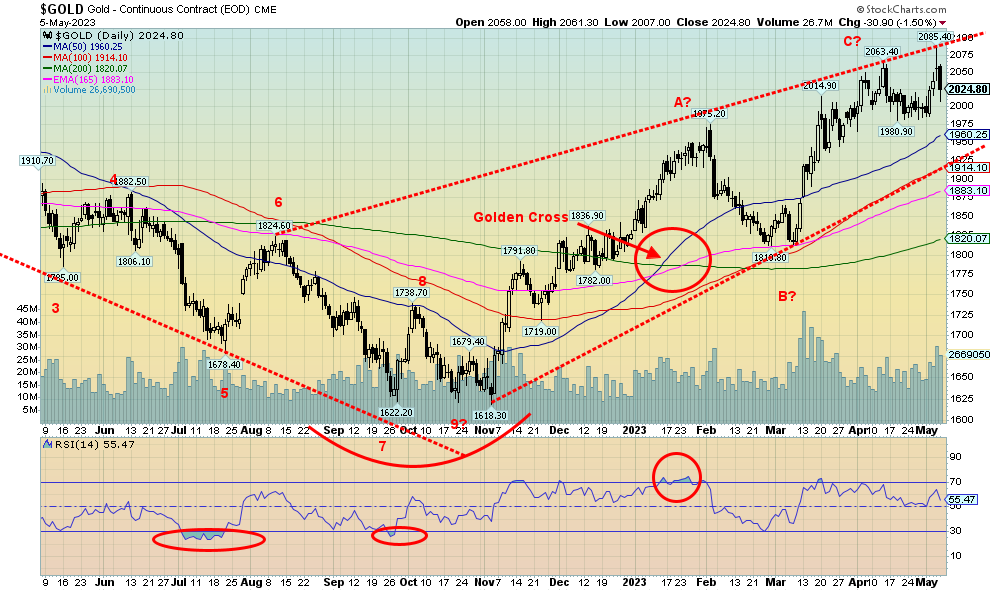
The job numbers on Friday killed the gold rally, at least for the moment. Gold spiked to fresh 52-week highs on Thursday, hitting a high of $2,085, just shy of the all-time high of $2,089 seen in August 2020. That we made higher highs than were seen in April is a positive and suggests we should find support, and then move once again to new highs. There is a possible rising channel where the top now would be just above this week’s high of $2,085. On the week, gold gained 1.3%, silver was up 2.8%, but platinum fell 2.0%. Palladium was down 1.5% and copper was off 0.3%. While gold in US$ fell just short of new all-time highs, we note that gold in Cdn$, Australian$, euro, and yen all made fresh all-time highs this past week. That suggests to us that gold in US$ should eventually join them.
A small concern is lagging demand. In 2022, the central banks made record purchases of gold. There was concern that Q1 2023 demand was down 40% from Q4 2022. Still, it was 228.4 tonnes, a level higher than had been seen in any other quarter for years. Numbers were reported by the World Gold Council (www.gold.org). Central bank purchases have been making up about a quarter of gold demand, with jewelry remaining the number one reason for gold.
While gold responded negatively to the hotter than expected job numbers, any signs of cooling and thoughts that the Fed will pause would be positive for gold. As well, the looming debt ceiling fight, along with the still-shaky regional banks, are both positive for gold. Any escalation in the Russia/Ukraine war would also be very
positive for gold. There is growing concern over NATO/U.S. involvement in the war that leads to an open clash between Russia and NATO/U.S. As well, tensions remain high between China and U.S., and then there is Iran.
Our line in the sand for gold remains at $1,975. A break of that level could lead to a fall towards $1,880/$1,900. Even longer-term support for gold is down at $1,800/$1,820. A break of that level would be far more dangerous for gold and a bigger fall could get underway. We believe we’ll see new highs. The ongoing battle between bulls and bears is keeping the suspense up.
With the new high this past week not far above the previous high, we wonder if we are in the process of forming what we call three thrusts to a high. Another new high might thrust to just above $2,100 then fail. A move above $2,100 would bring in all sorts of buyers, causing a possible spike and failure as the sellers step in. Something to watch for.
Source: www.cotpricecharts.com
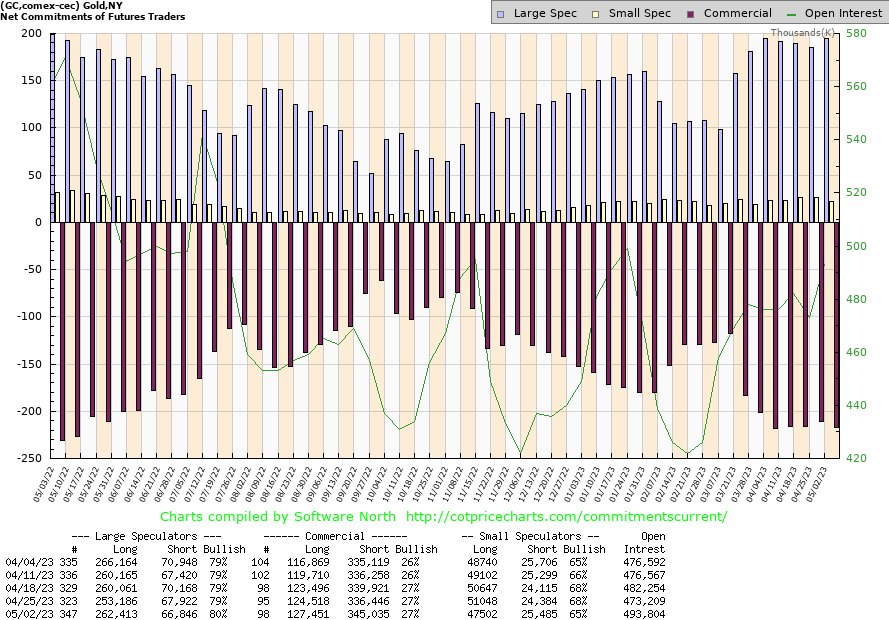
For the third week in a row, the gold commercial COT (bullion companies and banks) stayed at 27%. Longs actually added roughly 3,000 contracts while shorts jumped almost 9,000 contracts. The large speculators COT (hedge funds, managed futures, etc.) rose to 80% as they added over 9,000 longs while reducing their shorts by about 1,000 contracts. Overall, open interest rose over 20,000 contracts on the week as gold rose. With the commercial COT not growing, we’ll take that as a positive.
Source: www.stockcharts.com
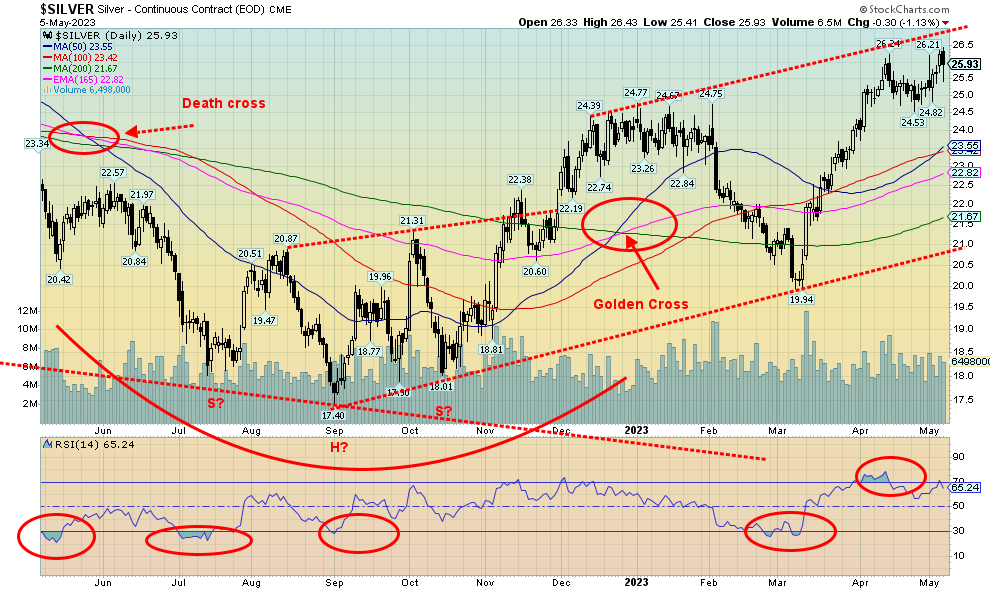
Silver finally jumped to 52-week highs this past week, joining gold. However, we remind everyone that while gold is not far off its all-time high of $2,089, silver is nowhere near its 2011 high near $50. This is a divergence that has bugged us for some time. Nonetheless, silver was up 2.8% this past week and 7.9% in 2023. The gain for 2023 is, however, subsumed by gold’s gain of 10.9% in 2023. Another divergence. We want to see silver lead.
Silver, as with gold, was negatively impacted by Friday’s job numbers. Signs of a surging economy are negative for the metals. But signs of a cooling economy and the potential for the Fed to pause are positive for gold and silver. Nonetheless, there were some divergences and a possible spike on Friday as we saw new highs followed by a outside day downside reversal and a lower close. The last low was at $24.53 and if that breaks then silver could fall further to $22.80. We note support near that level. That long term trendline near $21 does not appear to be in danger. We note silver is near the top of a potential channel. However, it is not unusual to see stocks, commodities, etc. crawl up a channel. New highs would keep the bull alive. The top of the channel is currently near $27. We’ve long held that a breakout over $27 is needed to tell us we are headed for the February 2021 highs of $30.35.
The World Silver Institute noted that silver is undersupplied by some 237.7 million ounces in 2022. Silver remains in supply deficits, a fact that should be bullish.
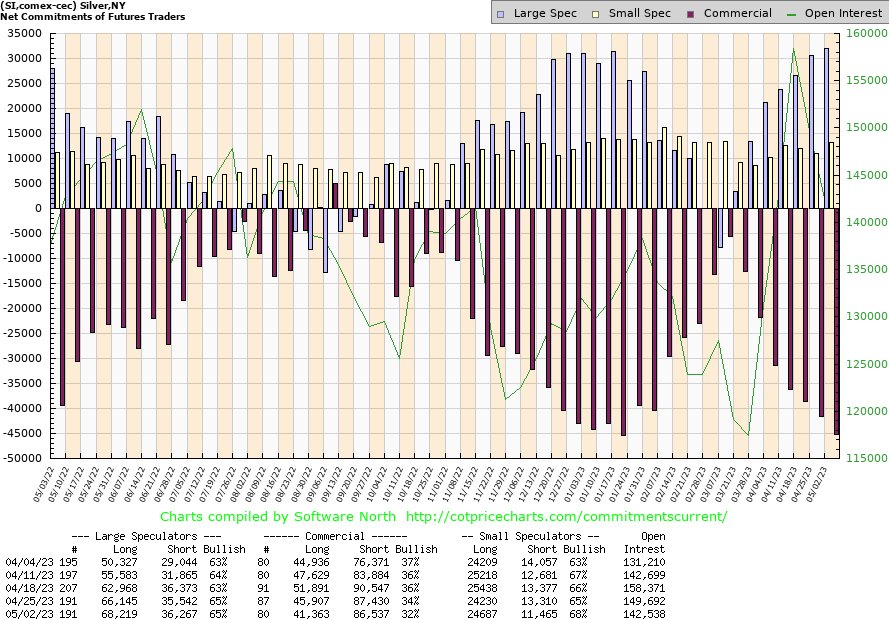
Source: www.cotpricecharts.com
The silver commercial COT fell further this past week to 32% from 34%. Longs fell over 4,000 contracts, although shorts were down as well but only by about 1,000 contracts. The large speculators COT was steady at 65%, although they added about 2,000 longs and 1,000 shorts. Overall, open interest fell roughly 7,000 contracts on an up week for silver. Slightly negative and about where the silver COT was before another drop. So, a warning?
Source: www.stockcharts.com
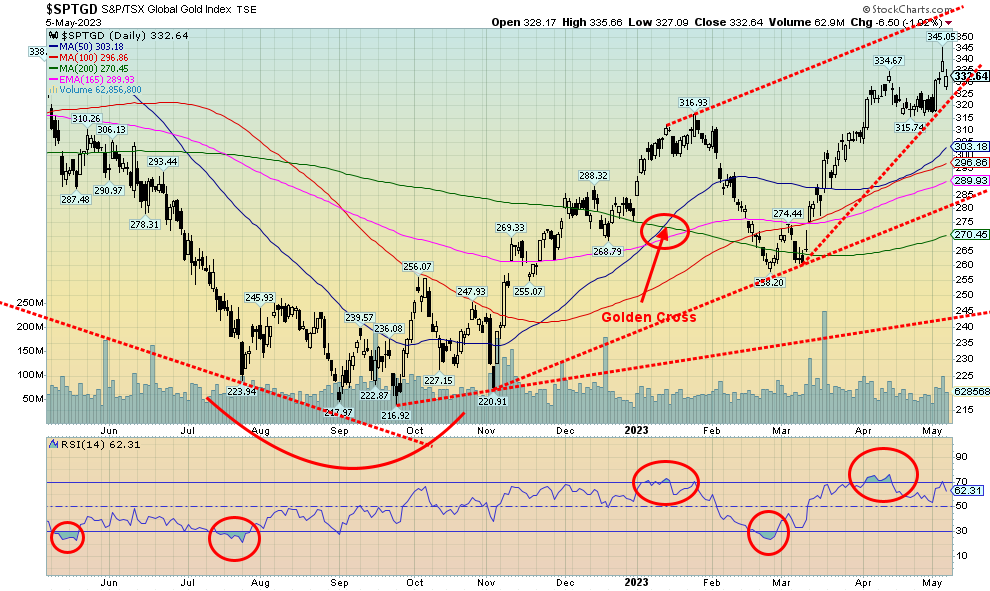
The good news. Gold stock indices made fresh 52-week highs this past week. On the week, the TSX Gold Index (TGD) was up 4.4% and the Gold Bugs Index (HUI) gained 6.8%. And they are up 19.8% and 21.1% respectively in 2023. The bad news? The TGD remains 27% off of its 2011 highs and the HUI is down 56% from its 2011 high (after 12 years). Patience is key for investors in the gold stock sector. The Gold/HUI ratio remains not far off a record level at 7.28. The record high was 10.90 in 2015. The current level is over 200% higher than it was at the gold and HUI highs in 2011 and up some 370% from the ratio’s lows seen in 2004. Gold stocks are super cheap in relation to the gold price. The pattern of the gold/HUI ratio has the look of a huge top. As well, the ratio is making what appears to be a five-point reversal pattern. The next move should be down. A break of that trendline currently near 5.70 could start a sharp decline to potential targets to at least 4.25 as a minimum.
Friday was a down day for the gold stocks as a result of the stronger than expected job numbers. However, we note that the indices started the day down sharply and then regained throughout the day. That is potentially bullish. Nonetheless, the RSI indicator did diverge at the high (higher highs for the TGD, lower highs for the RSI) so it might be signaling a possible correction. The Gold Miners Bullish Percent Index (BPGDM) is at 75, off its recent high and still bullish. Its high but has at times been even higher.
The index hit support with an uptrend line. A break now of 325 would be negative and could send the index down to support near 300. The pattern still has the look of an ascending wedge triangle which is bearish. But the TGD appears to have more room to move higher in the wedge. If support holds here, TGD could rebound to even higher highs.
Gold/HUI Ratio 2000–2023

Source: www.stockcharts.com
Source: www.stockcharts.com
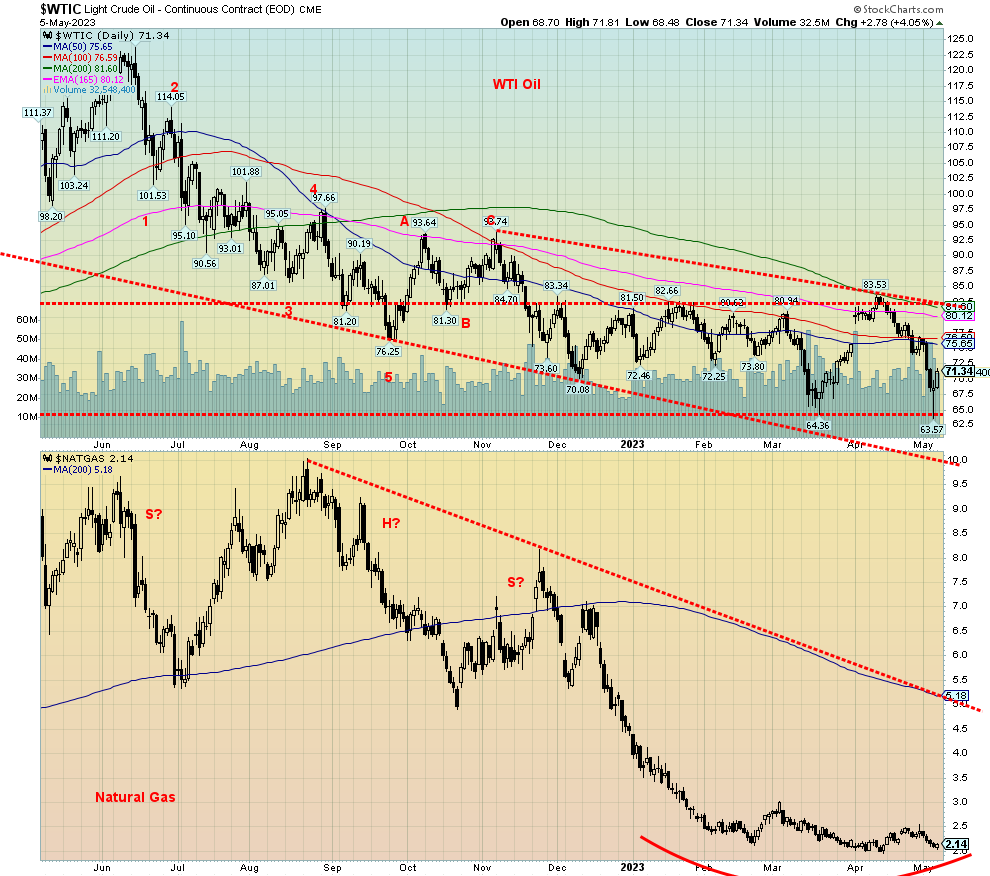
WTI oil was hammered this past week, losing 7.1% and falling to fresh 52-week lows at $63.57. But then Friday’s job numbers buoyed oil and it jumped $2.78, closing up 4.1% on the day. WTI oil was falling because of fears of a recession. But the stronger than expected job numbers sparked the rally (and short covering?). Brent crude also fell, losing 7.4% but in a possible positive divergence Brent did not make fresh 52-week lows. As well, the energy stocks, while down on the week, came nowhere near making fresh 52-week lows. The ARCA Oil & Gas Index (XOI) lost 5.7% on the week while the TSX Energy Index (TEN) was down 5.4%. The two are
down 7.4% and 6.9% respectively on the year. That’s well off what WTI oil is down. It’s down 11.1% while Brent is down 13.4% in 2023.
Not so lucky is natural gas (NG). The woes continue. Henry Hub NG fell 11.2% while the EU Dutch Hub was off 5.1%. The two are down 52.2% and 52.1% in 2023 respectively. Horrible, horrible year for NG.
What we liked about WTI oil this past week was the clear spike low it made at $63.57. That it finished some $5 off the lows and above the opening level is a big positive. If the pattern was a hammer, it has a very long handle. Nonetheless, we view it as a very bullish pattern and believe a low is now in for WTI oil and Brent as well. This should buoy energy stocks going forward.
NG continues to work on what appears as a growing rounding bottom. Those who might have thought that oil prices have had the biscuit for 2023 might want to rethink that. There remain top hot spots in Russia/Ukraine and Iran. Note that Iran has seized two oil tankers now and there are increasing calls to attack Iran. Interesting that the second oil tanker was actually empty. The tanker had been chartered by Chevron.
OPEC meets again in June and in person this time. Saudi Arabia is consistently calling for higher prices. Could there be another production cut in the offing? Meanwhile, Iraq is allowing Kurdish oil out again. Some 450,000 b/d had been shut in as a result.
Copyright David Chapman 2023
|
GLOSSARY Trends Daily – Short-term trend (For swing traders) Weekly – Intermediate-term trend (For long-term trend followers) Monthly – Long-term secular trend (For long-term trend followers) Up – The trend is up. Down – The trend is down Neutral – Indicators are mostly neutral. A trend change might be in the offing. Weak – The trend is still up or down but it is weakening. It is also a sign that the trend might change. Topping – Indicators are suggesting that while the trend remains up there are considerable signs that suggest that the market is topping. Bottoming – Indicators are suggesting that while the trend is down there are considerable signs that suggest that the market is bottoming. |
Disclaimer
David Chapman is not a registered advisory service and is not an exempt market dealer (EMD) nor a licensed financial advisor. He does not and cannot give individualised market advice. David Chapman has worked in the financial industry for over 40 years including large financial corporations, banks, and investment dealers. The information in this newsletter is intended only for informational and educational purposes. It should not be construed as an offer, a solicitation of an offer or sale of any security. Every effort is made to provide accurate and complete information. However, we cannot guarantee that there will be no errors. We make no claims, promises or guarantees about the accuracy, completeness, or adequacy of the contents of this commentary and expressly disclaim liability for errors and omissions in the contents of this commentary. David Chapman will always use his best efforts to ensure the accuracy and timeliness of all information. The reader assumes all risk when trading in securities and David Chapman advises consulting a licensed professional financial advisor or portfolio manager such as Enriched Investing Incorporated before proceeding with any trade or idea presented in this newsletter. David Chapman may own shares in companies mentioned in this newsletter. Before making an investment, prospective investors should review each security’s offering documents which summarize the objectives, fees, expenses and associated risks. David Chapman shares his ideas and opinions for informational and educational purposes only and expects the reader to perform due diligence before considering a position in any security. That includes consulting with your own licensed professional financial advisor such as Enriched Investing Incorporated. Performance is not guaranteed, values change frequently, and past performance may not be repeated.
About the author


Website: https://www.enrichedinvesting.com
Disclaimer: David Chapman is not a registered advisory service and is not an exempt market dealer (EMD) nor a licensed financial advisor. We do not and cannot give individualised market advice. David Chapman has worked in the financial industry for over 40 years including large financial corporations, banks, and investment dealers. The information in this newsletter is intended only for informational and educational purposes. It should not be considered a solicitation of an offer or sale of any security. The reader assumes all risk when trading in securities and David Chapman advises consulting a licensed professional financial advisor before proceeding with any trade or idea presented in this newsletter. David Chapman may own shares in companies mentioned in this newsletter. We share our ideas and opinions for informational and educational purposes only and expect the reader to perform due diligence before considering a position in any security. That includes consulting with your own licensed professional financial advisor.