
“Nothing is more uncertain than the favour of the crowd.”
—Marcus Tullius Cicero, Roman statesman, lawyer, scholar, philosopher, orator, politician, academic sceptic, prolific writer; 106 BC–43 BC (assassinated on orders from Marc Antony)
“Averaging down in a bear market is tantamount to taking a seat on the down escalator at Macy’s.”
—Richard Russell, American writer on finance, best known for his Dow Theory Letters (1958–2015); 1924–2015
“Brevity is the soul of wit.”
—William Shakespeare, English playwright, poet, actor, regarded as the greatest writer in the English language, wrote many famous plays, including Hamlet, Romeo and Juliet, King Lear, Othello, Macbeth; 1564–1616
We live in turbulent times. There are forces at work that are changing the world as we have known it. These periods seem to come only once in a lifetime. There is never any one year that one can pinpoint as causing that change because it happens over a period of years. The world of the 19th century came to an end with World War I, the Great Depression, and World War II. The world that emerged after World War II was very different than the one that existed before 1914. And the one that will emerge from what is going on now will be very different than the one that largely existed after World War II. That world, we believe, peaked with the great high-tech bull market of the 1990s.
We’ve identified the problems before. Economist Nouriel Roubini (aka Dr. Doom) called them MegaThreats. We summarize:
- Debt. The world has never had so much of it now, in excess of $300 trillion, and with debt related to derivatives probably upwards of another $100 trillion. Governments (central banks) have bought a lot of that debt, effectively printing money and allowing governments to borrow more and more. But governments are not the only ones as corporations and consumers also loaded up on debt, somehow figuring the government will protect them in the event of a big default. A demographic time bomb is ticking that could leave future generations in a dire position. In an effort to save the economy, governments have bailed out many, creating zombie banks and companies.
- Conflict #1. Internal conflict, as represented by poisonous, divisive politics, is present in many countries, not only in the U.S. This is evidenced by separation movements within countries, cultural wars, and a huge wealth and values divide that has populists on both the left and right fighting.
- Conflict #2. External conflict is rife, as represented by the growing global divide that has the supporters of Russia/China on one side and the supporters of the U.S. on the other. Russia/China and its supporters are challenging the global hegemony of the U.S. We see this particularly with the desire to create an alternative global currency not dependent on the U.S. dollar and institutions not controlled by the U.S. Globalization, that has added numerous benefits even as it created other conflicts, is pulling back. Supply chains have been disrupted by the growing conflict. In the past, these Great Power conflicts led to global war.
- Environment. The world is under great stress from potential environmental devastation. Climate change has led to droughts, intolerable heat waves, floods, and severe storms, including hurricanes and tornadoes. Pollution has reached a global scale as oceans, for example, are being choked by plastic. Mass extinction of birds, mammals, and insects is underway. Pandemics are just another example of how nature is causing great disruption. Migrations are a growing global problem and could become uncontrollable as people flee the devastation of climate change, wars, and pandemics.
- Technology: The world has gone through numerous periods of technological change. The First Industrial Revolution, which lasted roughly from 1700 to the mid-1800s brought us steam power, the cotton gin, and many more innovations that industrialized production. The Second Industrial Revolution brought us great scientific discoveries, mass production, and standardization. It lasted roughly from the latter part of the 19th century to early part of the 20th century. The Third Industrial Revolution that lasted from the early part of the 20th century to more recently brought us a rise in electronics, telecommunications, computers, and nuclear energy. The Fourth Industrial Revolution is underway with the rise of artificial intelligence, the internet, and the automation of almost everything. Its danger is that it will benefit a few, but leave many in its wake disadvantaged as their jobs are automated. That in turn could lead to further conflict. See conflict #1.
All this fits very well with the long-term stock market cycles we have noted before. Long-term cycles are 75 and 90 years. We tend to measure these long-term cycles from trough to trough. The Great Depression stock market low of 1932 was the trough of both the last 75- and 90-year cycle. The most recent 75-year cycle bottomed with the high-tech/dot.com low of 2002 (70 years) and the financial crisis low of 2009 (77 years). The accepted 75-year low is 2009 as it was lower and more severe than the 2002 low. The 90-year cycle low is due now with the ideal time being 2022 but the range could be from 2007-2037. For the stock market, was that March 2009 low also our 90-year cycle low? We don’t believe it was, mostly because of we haven’t as yet had a recession (or worse) nor a wash-out of the debt. To validate we’d most likely have to make a low below that 2009 low of Dow Jones Industrials (DJI) 6,469. Right now, that seems fantastical that could happen but some are predicting it will.
There have been few observations of the 90-year cycle. As noted, 1932 was the last stock market trough. Looking back 90 years, we discover an important stock market low in 1843 (89 years). Stock markets lost some 73% in that collapse of 1835–1843, compared to the 89% collapse of 1929–1932 of the Great Depression. While the stock market topped in 1835, the panic was in 1837 as the financial crisis set off a major depression.
Wars and social change dominated the period that effectively lasted until the end of the U.S. Civil War in 1865. There was also the U.S./Mexico war of 1846–1848.
Going back 90 years again, we come to what was a stock market low in 1761 (82 years), although there was a slightly lower low in 1783. However, we’ll use 1761. The 18th century was one of many wars and major change, highlighted by the Seven Years’ War of 1756–1763, the American Revolution of 1765–1791, and the French Revolution of 1789–1799. There was also a major depression. The market had actually topped in 1720 and, overall, fell 75% but over a long period of time. The high of 1720 was not taken out until after the War of 1812 and the Napoleonic Wars.
It is trickier going back further, but back 90 years was a stock market low in 1672. The market had topped in 1649 and then lost some 55% into the low of 1672 (which seems rather quaint now as the financial crisis of 2007–2009 fell some 55%). The 17th century was dominated by wars between France, Britain, and the Netherlands, and effectively ended the Netherlands reign as a global power. It was also a period of severe climatic change with a mini-ice-age and pandemics of influenza, small pox, and more. Major plagues were recorded in China, Britain, Spain, Austria, the Americas, particularly amongst the native populations, Italy, and the emerging U.S.
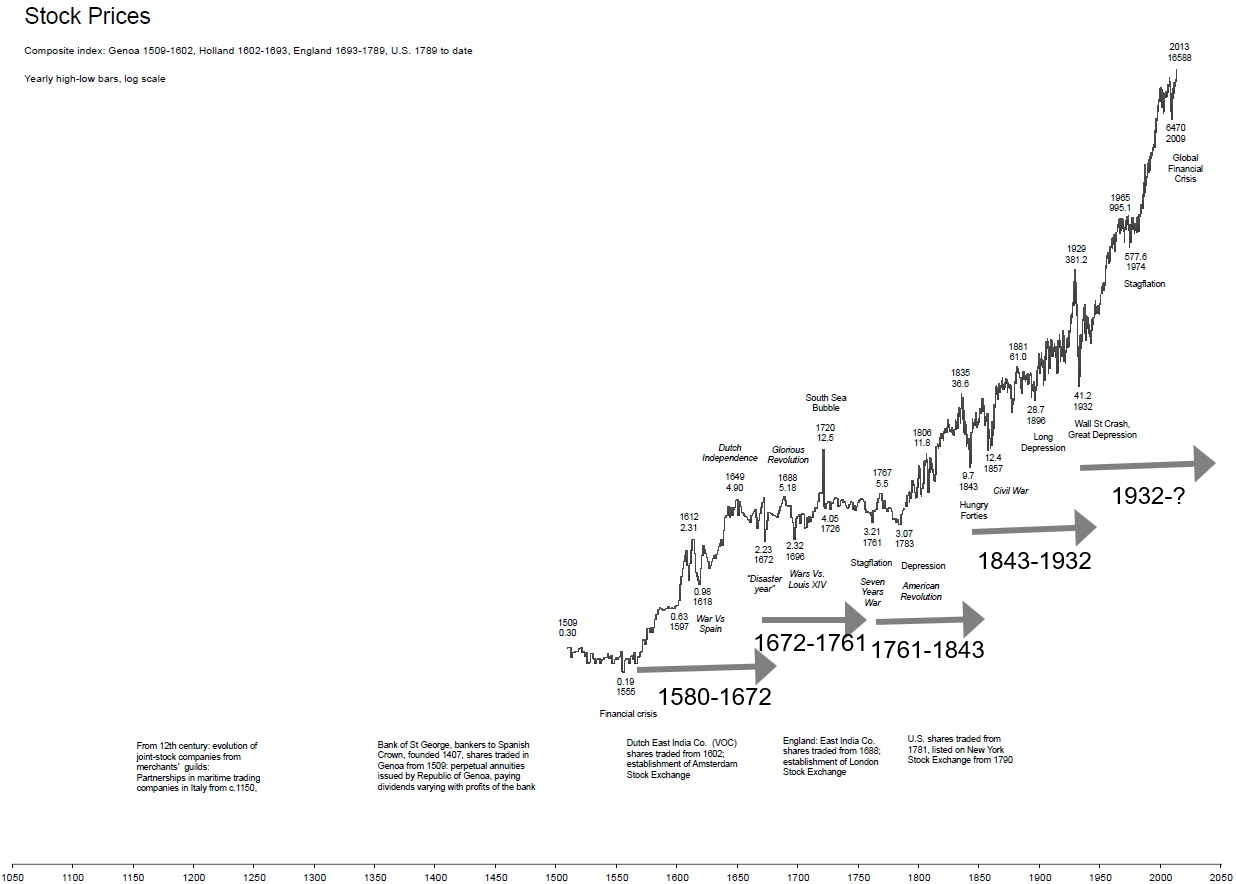
Source: www.goldchartsrus.com
Others have studied cycles back even further, including Martin Armstrong of Armstrong Economics (www.armstrongeconomics.com). However, for purposes of our illustration, we are using the chart from Gold Charts “R” Us (www.goldchartsrus.com).
The biggest threat to bring down the stock markets and potentially cause a global depression would be a major collapse of the debt market. Following the 2008 financial crisis interest rates were kept at historic record lows. Central banks provided record liquidity through quantitative easing (QE). Debt grew at a horrendous pace more than doubling from where it was at the time of the 2007–2009 financial crisis. Then along came the pandemic which disrupted everything sparking shutdowns, and disrupting supply chains.
Once again central banks and governments opened the spigots flooding the system with liquidity (money) and dropping interest rates to zero and lower. It is no surprise that as inflation rose, central banks responded by hiking interest rates and quantitative tightening (QT), leading to a rise in interest rates and a very steep inverted yield curve, that problems would arise. The ultra record low interest rates coupled with massive growth in money and debt sparked first asset inflation where everything rose. Then came price inflation as supply disruptions, climate change and the outbreak of the Russia/Ukraine war coupled with growing sanctions, sparked further supply disruptions and shortages.
Then came the collapse of SVB Bank and Signature Bank. Was the debt crisis now upon us? This could be the proverbial tip of the iceberg.
There are other regional banks in the U.S. that are also experiencing trouble. Credit conditions are tightening. That in turn could have a negative impact on businesses from small to large as well as on consumers. Consumers are feeling the pinch with rising prices particularly food and problems with debt particularly mortgages as defaults and restructuring rise.
However, the regional banks are not the only ones in trouble. Hedge funds, private equity, venture capital, and others get their returns through leverage and mismatches. It also extends to auto loans, credit cards, and more. All short-term funding. An inverted yield curve does none of them any favours as they all follow similar strategies of lending long and borrowing short. There is also the massive use of derivatives and products built on derivatives. Besides the obvious example of futures and options, derivatives also include interest rate swaps and forward rate agreements. They cover many markets including interest rates (bonds, money markets), foreign exchange, stocks, indices, commodities, and derivatives of derivatives. Derivatives are used for both hedging and speculation.
Commercial real estate is also in considerable trouble. This was highlighted this past week when Brookfield Properties (BN/NYSE, BN/TSX), one of the largest real estate companies in the world, supposedly defaulted on $161.4 million of office building mortgages in the Washington D.C. area. Earlier they had defaulted on $784 million of mortgages in Los Angeles. Blackstone Group (BX/NYSE) had defaulted on some $531 million of European properties and shut down a large real estate fund. Some believe a bigger real estate crisis is growing. REITS here in Canada have dropped sharply. Many were also lending long and borrowing short.
European banks are in particular trouble, highlighted by what appears to be the collapse of Credit Suisse and its hurried merger with UBS. Sovereign debt is also in significant trouble with quite a number of countries effectively bankrupt. Many Chinese and Japanese banks and companies have been described as zombies as the BOJ and PBOC keep them artificially alive. While the U.S., along with France-led Paris Club, are attempting to restructure emerging market debt, others such as China are taking a different tack in dealing with bankrupt countries. Finally, there is the U.S. debt ceiling fight which, if not resolved, could spark a bond market collapse. Which is the prime reason this one should be resolved in some format, even if at the last moment. The stakes are simply too high.
So, what does one do in an environment like this? Surprisingly, at least right now, bonds look like a good investment. Our chart below of Canadian 10-year yields, long-term Canada bond yields, and real return long-term bonds all appear to be making a large topping pattern. Indeed, the chart has the look of a potential head and shoulders pattern. Naturally, they have to bust what appears to be the neckline. For the 10-year Canada bond (CGB) that appears to be around 2.80%. 3-month out to one-year Canada T-Bills yield are around 4.30%/4.40% vs. Canada 10-year at 2.95%. We are still in the slowing-down stage for the economy and we haven’t yet entered an official recession. Bond yields would come down under those circumstances, but remember that the 1970s inflation was two-pronged: a rise in inflation followed by a fall, then another rise in inflation, higher than the previous rise, before falling again after interest rates were raised to choking levels sparking the 1980-1982 steep recession.
Government of Canada Bond Yields 2018–2023
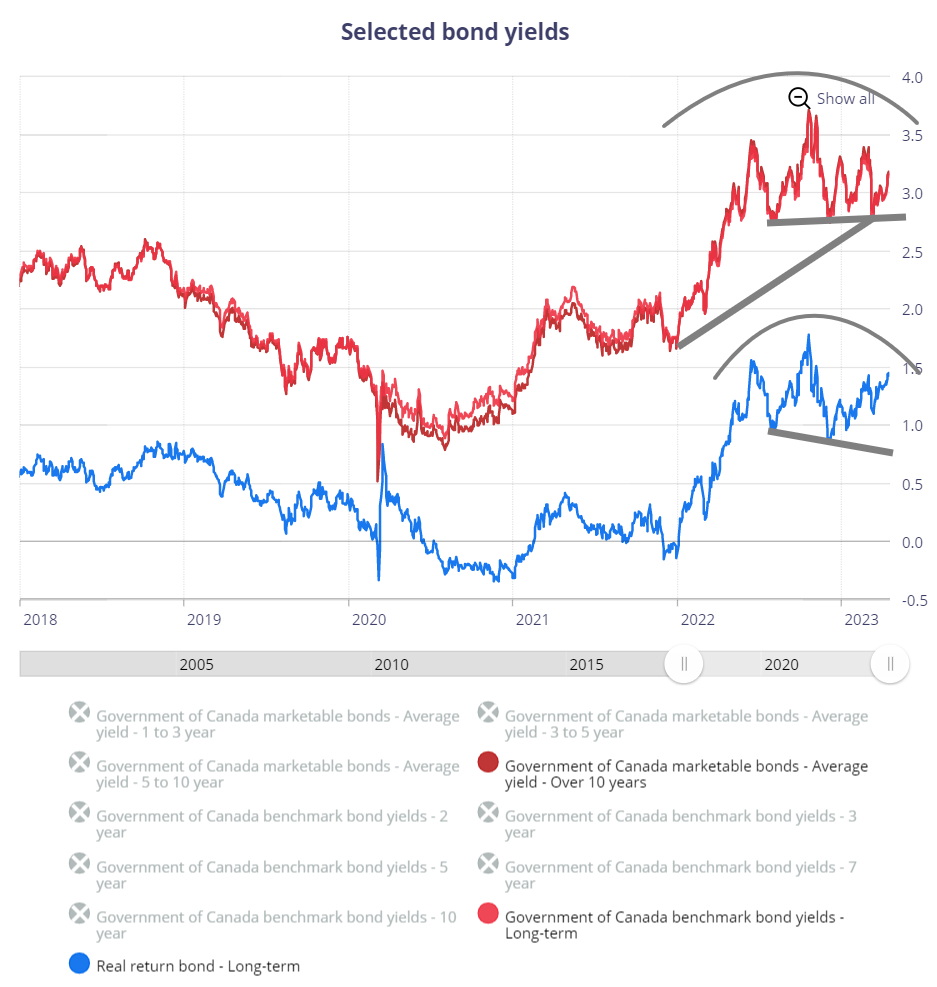
Source: www.bankofcanada.ca
What are the areas to avoid? Our ratio chart below shows how Financials (TFS), Income Trusts (TCM), Real Estate (TRE), and Utilities (TUT) have all underperformed the TSX Composite. While these areas might see some improvement if interest rates were to fall, there are better options within the TSX.
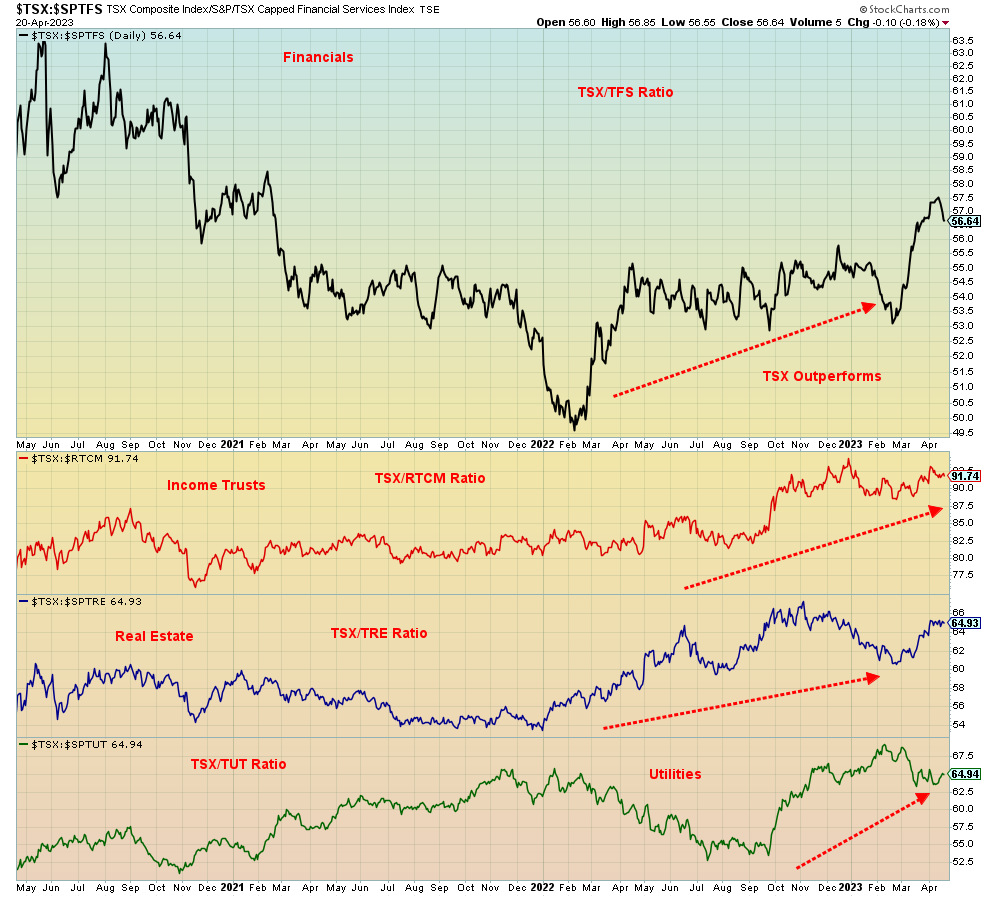
Source: www.stockcharts.com
Better options appear to be in commodity stocks. Outperforming the TSX Composite, albeit somewhat erratically, have been Materials (TMT), Energy (TEN), Golds (TGD), and Metals & Mining (TGM). These areas can, however, be more volatile. Hence, periods of outperformance followed by periods of underperformance, then a period of outperformance once again. Currently we are in a period of outperformance but a reminder that these sectors can be volatile.
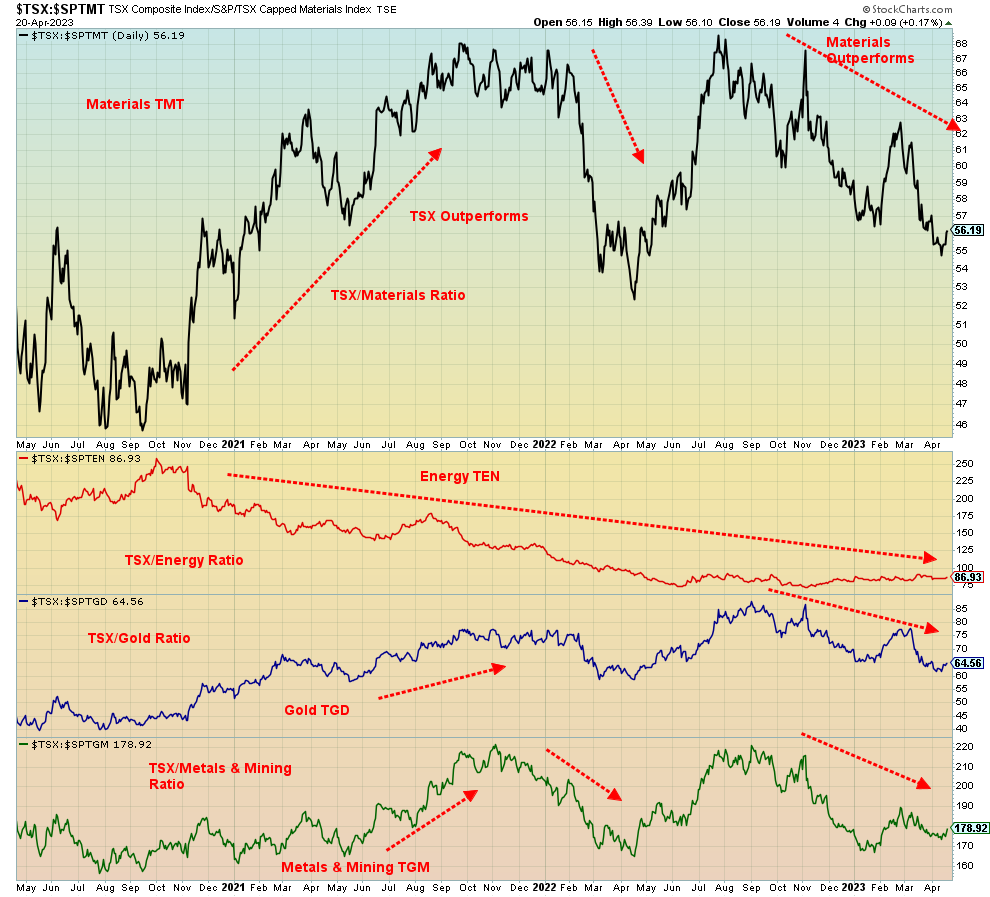
Source: www.stockcharts.com
We live in very volatile times with considerable conflict. Are central banks recognizing that buying up record amounts of gold to add to their reserves in 2022? In 2022 central banks added some 1,136 tonnes up 152% from the previous year. They have continued to add in 2023. Gold is recognized for its stability in times of instability and geopolitical turmoil. Significant change is coming but it occurs over a period of years. The investment environment is fraught with challenges. Our attempt is to see where we are and what may come up going forward. It is the same trying to determine where one puts one’s money. Markets will remain volatile and the risks will rise and fall. What’s key is to try and manage that risk.
Chart of the Week
Source: www.stockcharts.com
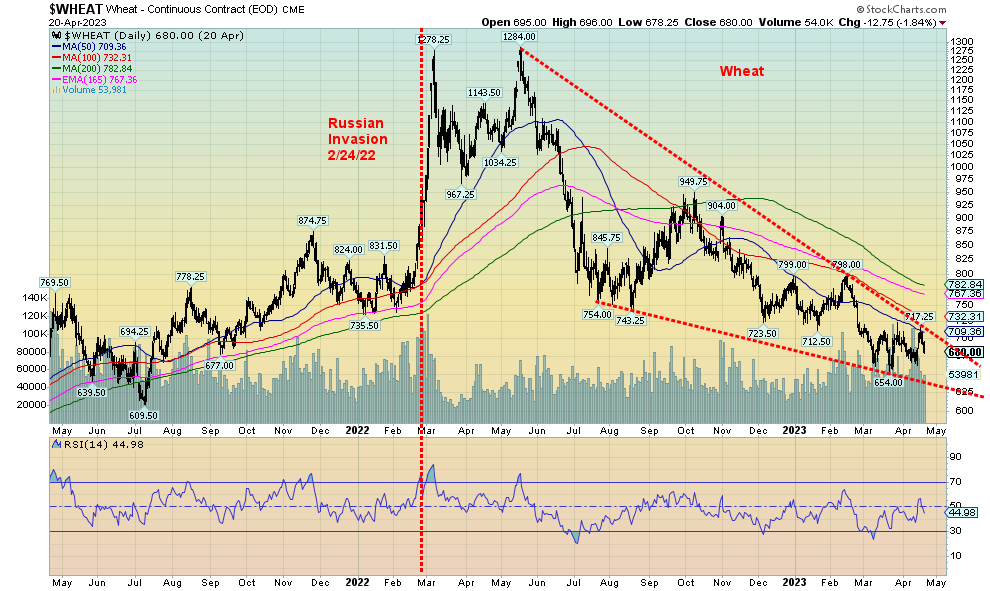
If you have been wondering why we have high food prices, you need look no further than the ongoing conflict in Ukraine, coupled with sanctions on Russia. According to trade data statistics from the U.N. (www.comtrade.un.org, www.unctad.org), Ukraine and Russia account for some 53% of global sunflower oil and seeds, 27% of wheat, 23% of barley, 16% of rapeseed, and 14% of corn. They also have some 40% of potash exports, a critical element for fertilizers. Ukraine and Russia are agriculture giants.
The global shortage of key food grains, along with the loss of fertilizer, has sparked famines, mostly in Africa. Add in severe droughts in major crop-growing countries and the result is higher food prices globally, particularly for bread and pasta, and growing famines.
In order to work around the resultant blockages, a deal was signed with Russia and Ukraine to allow exports of Ukrainian and Russian wheat to get out. Turkey is also part of the deal as they control the exit from the Black Sea through the Straits of Bosporus into the Marmara Sea, then through the Dardanelles into the Mediterranean Sea. Numerous countries depend on receiving wheat from the two agriculture giants. This is especially true of Asian countries such as Pakistan and numerous states in Northern Africa.
And now comes a new potential threat. Russia has warned that the outlook for a further extension of what was known as the Black Sea grain deal is “not so great.” The current deal expires on May 18, 2023. The reason is the continued sanctions on Russia that are hindering their ability to export their agriculture products. Why? While Russia’s food and fertilizer exports have not been sanctioned, they have sanctions that negatively impact payments, logistics, and insurance.
The Russian Agricultural Bank (Rosselkhozbank) was banned from SWIFT. That has negatively impacted payments. Russia was banned from importing agricultural machinery. Russian ships have been unable to obtain insurance or reinsurance, thus restricting their movements, particularly through the Turkish-controlled straits. Russia has also asked that the Togliatti-Odessa ammonia pipeline be restored and that assets being blocked of Russian food and fertilizer companies be unblocked.
The UN has been trying to get these resolved, but none of the players involved are making any moves to unblock. The UN does not control SWIFT nor does it control insurance companies or shipping companies. The U.S. says Russia’s problems are being caused by Russia. The result is Russia is threatening to end the deal, block ships from entering the war zone, and place floating mines around ports in Ukraine. Ships would only be able to enter with Russia’s agreement. All this could result in fewer (if any) exports of critical food and fertilizer supplies from leaving, let alone getting to their destinations. Will another deal get done?
As a result, could another global food crisis break out? The chart of wheat appears as a potential huge descending wedge triangle. A firm break above 720/730 could, in theory, send wheat prices back towards the highs seen in March/May 2022. Wheat prices are perking up, but have yet to break out. Given the background and the recent leak of the Pentagon papers, the odds that a crisis could break out are rising. And that would translate into, amongst other things, higher wheat prices and ultimately higher food prices.
Markets & Trends
|
|
|
|
% Gains (Losses) Trends
|
|
||||
|
|
Close Dec 31/22 |
Close Apr 21/23 |
Week |
YTD |
Daily (Short Term) |
Weekly (Intermediate) |
Monthly (Long Term) |
|
|
Stock Market Indices |
|
|
|
|
|
|
|
|
|
`S&P 500 |
3,839.50 |
4,133.52 |
(0.1)% |
7.7% |
up |
up |
up (weak) |
|
|
Dow Jones Industrials |
33,147.25 |
33,808.96 |
(0.2) |
2.0% |
up |
up |
up |
|
|
Dow Jones Transport |
13,391.91 |
14,413.58 |
1.2% |
7.6% |
up (weak) |
up (weak) |
up (weak) |
|
|
NASDAQ |
10,466.48 |
12,072.46 |
(0.4)% |
15.3% |
up |
up |
neutral |
|
|
S&P/TSX Composite |
19,384.92 |
20,693.15 |
0.6% |
6.8% |
up |
up |
up |
|
|
S&P/TSX Venture (CDNX) |
570.27 |
614.20 |
(3.7)% |
7.7% |
down (weak) |
up (weak) |
down |
|
|
S&P 600 (small) |
1,157.53 |
1,160.11 |
(0.3)% |
0.2% |
down (weak) |
down (weak) |
neutral |
|
|
MSCI World Index |
1,977.74 |
2,165.76 |
0.1% |
9.5% |
up |
up |
up (weak) |
|
|
Bitcoin |
16,535.23 |
28,193.93 |
(7.8)% |
70.5% |
up (weak) |
up |
neutral |
|
|
|
|
|
|
|
|
|
|
|
|
Gold Mining Stock Indices |
|
|
|
|
|
|
|
|
|
Gold Bugs Index (HUI) |
229.75 |
260.24 |
(4.9)% |
13.3% |
up |
up |
neutral |
|
|
TSX Gold Index (TGD) |
277.68 |
318.61 |
(2.6)% |
14.7% |
up |
up |
up (weak) |
|
|
|
|
|
|
|
|
|
|
|
|
% |
|
|
|
|
|
|
|
|
|
U.S. 10-Year Treasury Bond yield |
3.88% |
3.57% |
1.7% |
(8.0)% |
|
|
|
|
|
Cdn. 10-Year Bond CGB yield |
3.29% |
2.94% |
(3.3)% |
(10.6)% |
|
|
|
|
|
Recession Watch Spreads |
|
|
|
|
|
|
|
|
|
U.S. 2-year 10-year Treasury spread |
(0.55)% |
(0.61)% |
(5.2)% |
(10.9)% |
|
|
|
|
|
Cdn 2-year 10-year CGB spread |
(0.76)% |
(0.81)% |
(2.5)% |
(6.6)% |
|
|
|
|
|
|
|
|
|
|
|
|
|
|
|
Currencies |
|
|
|
|
|
|
|
|
|
US$ Index |
103.27 |
101.55 |
0.3% |
(1.7)% |
down |
down |
up |
|
|
Canadian $ |
73.92 |
73.89 |
(1.4)% |
flat |
up (weak) |
down |
down |
|
|
Euro |
107.04 |
109.92 |
0.1% |
2.7% |
up |
up |
down (weak) |
|
|
Swiss Franc |
108.15 |
112.04 |
0.1% |
3.6% |
up |
up |
up |
|
|
British Pound |
120.96 |
124.45 |
0.2% |
2.9% |
up |
up |
down (weak) |
|
|
Japanese Yen |
76.27 |
74.57 |
(0.3)% |
(2.2)% |
neutral |
up |
down |
|
|
|
|
|
|
|
|
|
|
|
|
|
|
|
|
|
|
|
|
|
|
Precious Metals |
|
|
|
|
|
|
|
|
|
Gold |
1,826.20 |
1,990.50 |
(1.3)% |
9.0% |
up |
up |
up |
|
|
Silver |
24.04 |
25.06 |
(1.6)% |
4.2% |
up |
up |
up |
|
|
Platinum |
1,082.90 |
1,138.70 (new highs) |
8.0% |
5.2% |
up |
up |
up |
|
|
|
|
|
|
|
|
|
|
|
|
Base Metals |
|
|
|
|
|
|
|
|
|
Palladium |
1,798.00 |
1,607.40 |
7.4% |
(10.6)% |
up |
down |
down |
|
|
Copper |
3.81 |
3.98 |
(3.2)% |
4.5% |
down |
up |
up (weak) |
|
|
|
|
|
|
|
|
|
|
|
|
Energy |
|
|
|
|
|
|
|
|
|
WTI Oil |
80.26 |
77.87 |
(5.6)% |
(3.0)% |
up (weak) |
down (weak) |
up (weak) |
|
|
Nat Gas |
4.48 |
2.41 |
14.2% |
(46.2)% |
neutral |
down |
down |
|
Source: www.stockcharts.com
Note: For an explanation of the trends, see the glossary at the end of this article.
New highs/lows refer to new 52-week highs/lows and, in some cases, all-time highs.
Source: www.stockcharts.com
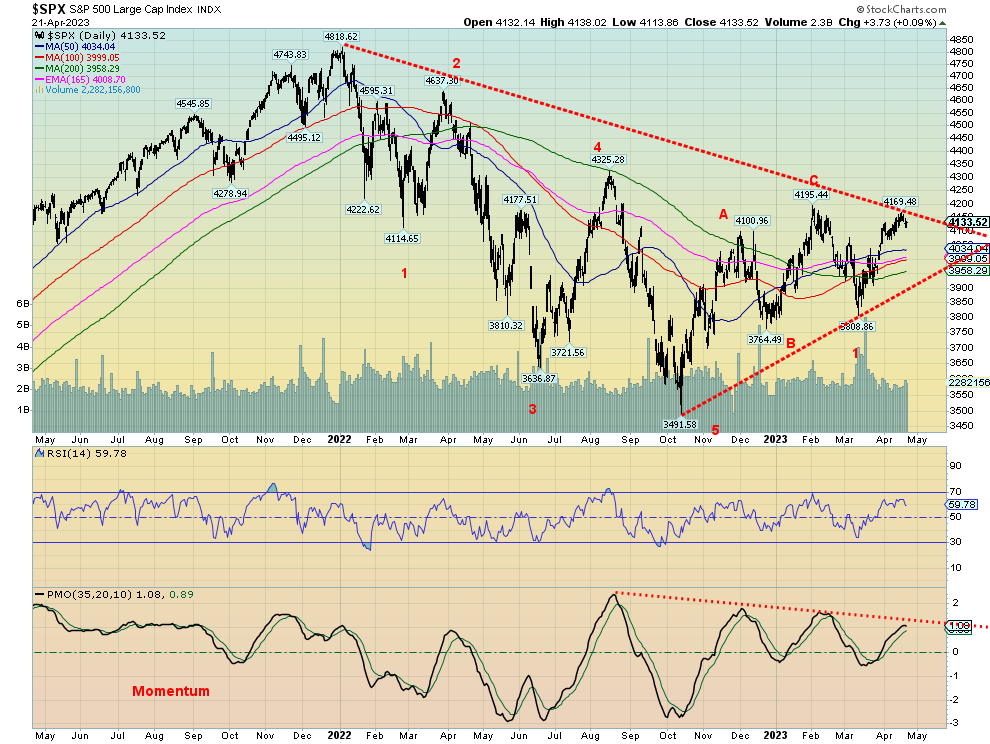
It was a decidedly mixed week for the stock markets, at least the U.S. markets. There were fears of more interest rate hikes and some weak economic numbers that were offset by a stronger Purchasing Managers Index (PMI) on Friday. On the week, the S&P 500 was up a small 0.1%, but the Dow Jones Industrials (DJI) lost 0.2%. The Dow Jones Transportations (DJT) gained 1.2% but the NASDAQ fell 0.4%. The S&P 400 (Mid) was up 0.4%, but the S&P 600 (Small) fell 0.3%. A possible harbinger was Bitcoin losing 7.8% this past week and threatening to break back under 28,000. The S&P 500 Equal Weight Index gained 0.2%, but the NY Fang Index lost 1.7%.
In Canada, the TSX Composite was up 0.6% but the small cap TSX Venture Exchange (CDNX) fell 3.7%. The global MSCI World Index was up a small 0.1%. In the EU, things were better as the London FTSE gained 0.5% as did the EuroNext. The Paris CAC 40 was up 0.8% while the German DAX gained 0.5%. Both continental indices made fresh 52-week highs. In Asia, things were not as good as China’s Shanghai Index (SSEC) fell 1.1%, the Tokyo Nikkei Dow (TKN) gained a small 0.3%, but Hong Kong’s Hang Seng (HSI) fell 1.8%.
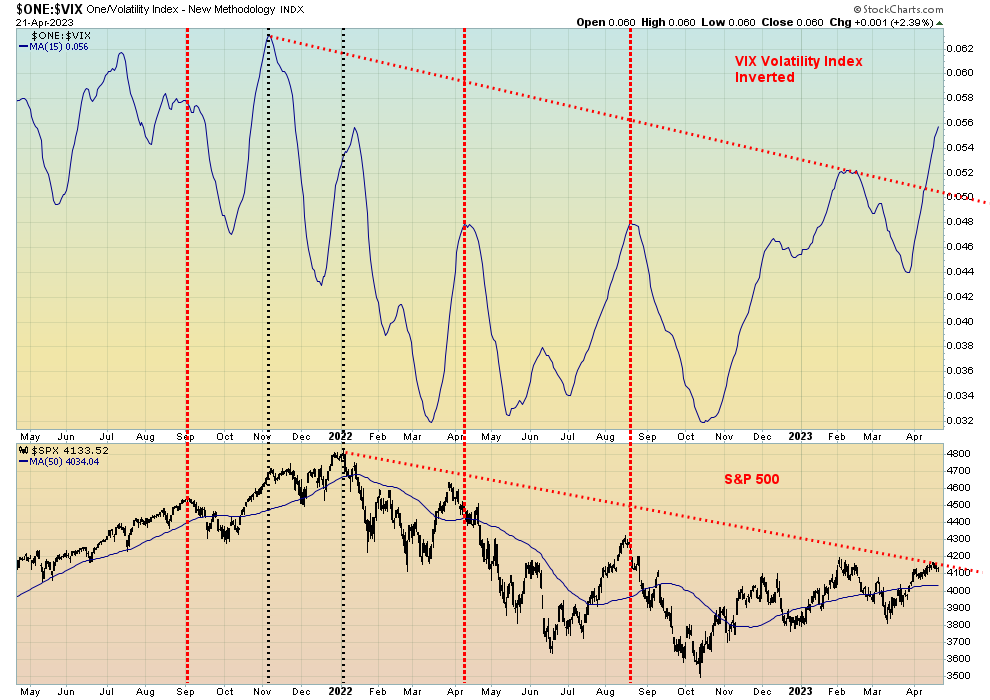
One thing we noted was that the CBOE Volatility Index was making new highs and was at the highest level since the peak last January. Yet we remain some 14% off that high. The Fear & Greed Index remains on Greed (not yet Extreme Greed). That the Volatility index is making new highs (the chart below shows the inverted VIX Volatility Index vs. the S&P 500) is a bit of a surprise, considering that amongst other indicators, volume as an example are not confirming this move.
We also note that only 55% of S&P 500 stocks are trading above the 50-day MA. Not a strong rally. This despite the index itself above the 50-day MA. It all suggests a narrow rally with, as some are saying, the large mega-cap stocks leading the way while everyone else lags. Momentum is currently lagging as well. We put momentum on our chart of the S&P 500 above. Note the growing negative divergence.
Source: www.stockcharts.com
What we need to see is a breakout over 4,200 and soon; otherwise, this rally could come to an end. And then we are in “sell in May and go away” territory. The market is not giving off good vibes, but a move above 4,200 could keep this rebound alive.
Source: www.stockcharts.com
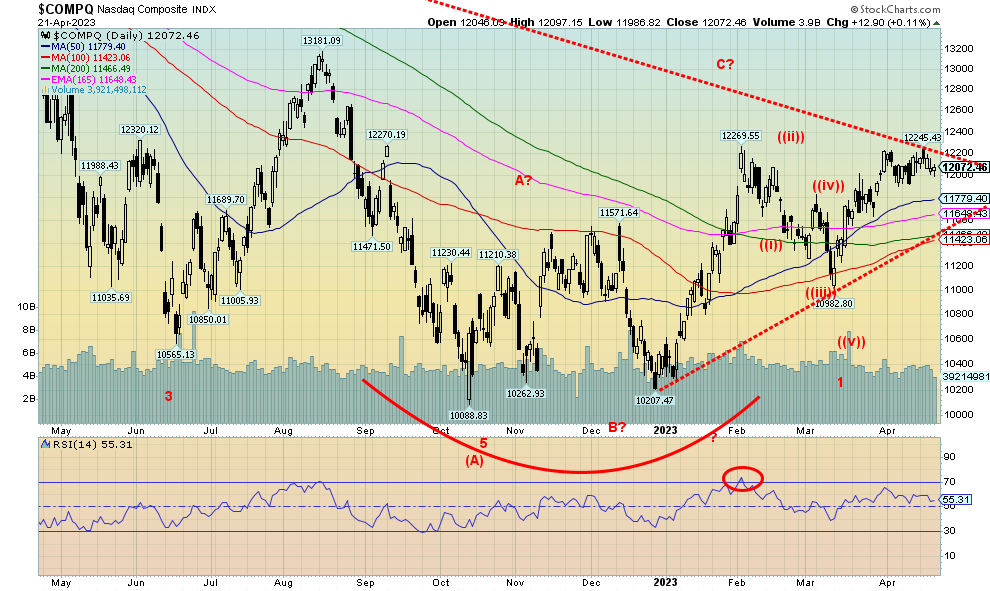
The NASDAQ fell 0.4% this past week. So far, it has failed to convincingly get through 12,200. The NY Fang Index was also down off 1.7%. It has been the high-tech stocks that have helped take the market higher. Could they now take the market lower? The big loser on the week was Tesla, down 10.8%. Indeed, the only ones up on the week were Amazon (+4.3%), Nvidia (+1.4%), and Snowflake (+2.2%). Otherwise, it was a poor week for what had been the leaders taking the market higher. We do appear to be rolling over. It is noteworthy that the NASDAQ advance/decline line has barely moved off its low, even as the NASDAQ moved higher. The NASDAQ new highs/new lows line is diverging as well with the index. Volume continues to be weak. Only 32% of NASDAQ stocks are above the 200-day MA and the 50-day MA. This is not a particularly strong market. A drop below 12,000 would be slightly negative, but a drop below 11,700 would most likely suggest that a top is in. Only continued new highs will keep this market alive.
Source: www.stockcharts.com
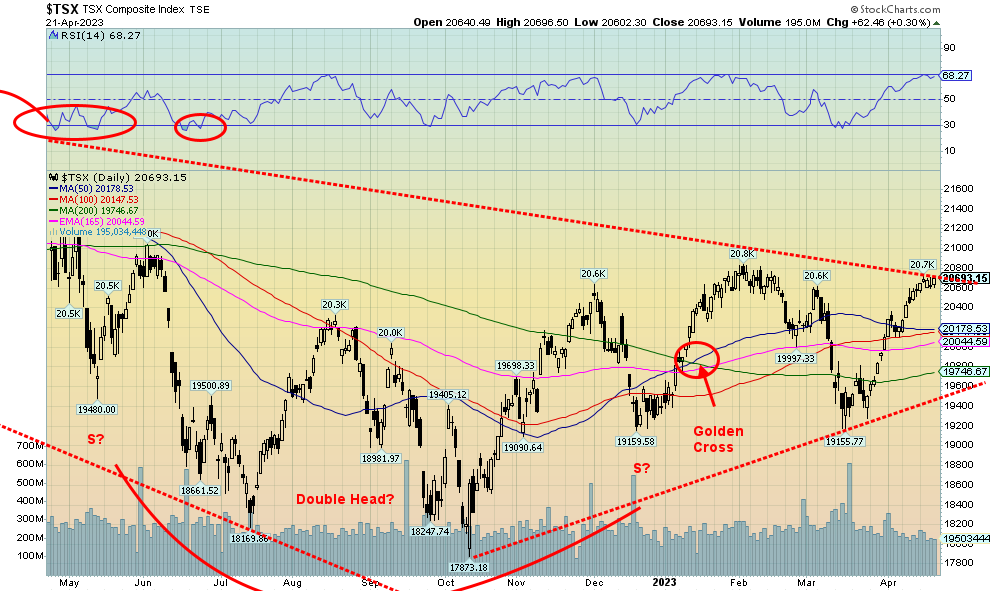
The TSX Composite gained 0.6% this past week but the junior TSX Venture Exchange (CDNX) fell 3.7%. Not a good week for the junior market as it turned the short-term trend down once again. Four of the 14 sub-indices were down on the week and all four were our commodity sub-indices. Golds (TGD) lost 2.6%, Metals & Mining (TGM) was off 3.4%, Materials (TMT) was off 2.4%, and Energy (TEN) dropped 2.7%. Not good for what we believe are the better sectors to be in. But, so far, they are just pullbacks within uptrends. Leading the way up was Health Care (THC), up a big 14.8%. But that sector can be volatile, depending on how they view cannabis stocks. Other than THC, the big winner was Industrials (TIN), up 2.7% to fresh 52-week highs. That was a bit of a surprise. Most of the other gains were small, under 1%, although Financials (TFS) was up 1.7%.
The TSX is twigging a downtrend line but so far has failed to break over. And, so far, it has not made new highs despite being close to that January high. Like the U.S. indices, the move from the October 2022 low appears to us as an ABC correction with the C wave topping in January. However, that decline into March also appears as an ABC so it is possible that we are either forming an ABCDE correction or the January high was merely the A wave of a larger ABC with the March low the B wave. We are now in the C wave, which has made a 5-wave advance up (albeit the pullbacks were small). The question is, is the move over? New highs above the January high would be positive, but a drop below 20,000 would tell us a top is most likely in. That uptrend line is currently near 19,500, so a drop through that level would be quite negative. A drop under 18,560 would suggest new lows ahead.
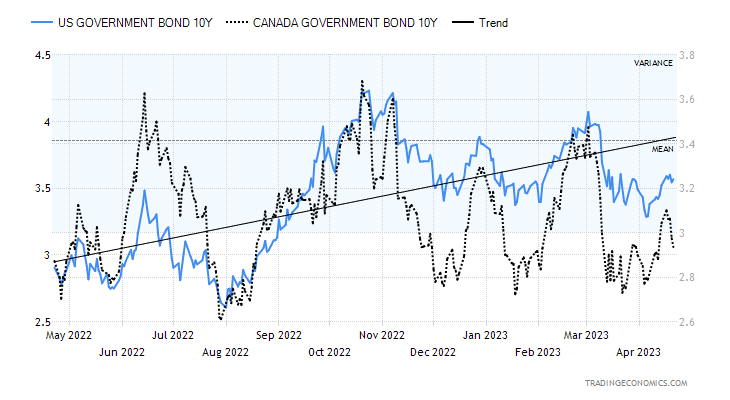
U.S. 10-year Treasury Bond/Canadian 10-year Government Bond (CGB)
Source: www.tradingeconomics.com, www.home.treasury.gov, www.bankofcanada.ca
Bond yields rose this past week but fell in Canada. The U.S. 10-year treasury note rose to 3.57% from 3.51%, but the Canadian 10-year Government of Canada bond (CGB) fell to 2.94% from 3.04%. It is unusual to see one rise and the other fall. They normally rise and fall together. Still, none of this takes away from what we see as a potential large top forming in yields. Naturally, we need to fall and break that neckline to prove the case. The U.S. 10-year falling under 3.00% would most likely confirm a top. The Cdn 10-year under 2.70% would also be good for falling yields. Despite U.S. bond yields rising this past week, the economic numbers were decidedly mixed. Housing starts and building permits were somewhat weaker than expected as was the Red Book; the Philly Fed at negative 31% was well below last month’s negative 23.2% and below consensus of negative 19.2%; weekly jobless claims came in at 245,000 above last week’s 240,000 and expectations of the same. But the April Purchasing Managers Index (PMI) was higher than expected at 50.4%, when they expected only 49%. Anything under 50% is considered recessionary while over 50% is considered expansionary. Overall, though, it wasn’t a big week for numbers.
This coming week we get the Shiller House Price Index on Tuesday along with new home sales. Durable goods are out on Wednesday and they are looking for a gain of 0.8%. The trade numbers are also out for March and the expectation is another big deficit of $89 billion. Watch for PCE prices on Thursday, another measure of inflation. Pending home sales and the Kansas City Fed are also out. Personal Income and spending are out on Friday along with PCE prices, another measure of inflation. The Chicago PMI is also out Friday and they are expecting a negative 43.5% reading.
Overall, bond yields indicate to us that we are headed lower. Clearly, a break for the U.S. 10-year over 3.5% would be negative and probably eliminate the potential topping pattern.
Source: www.stockcharts.com
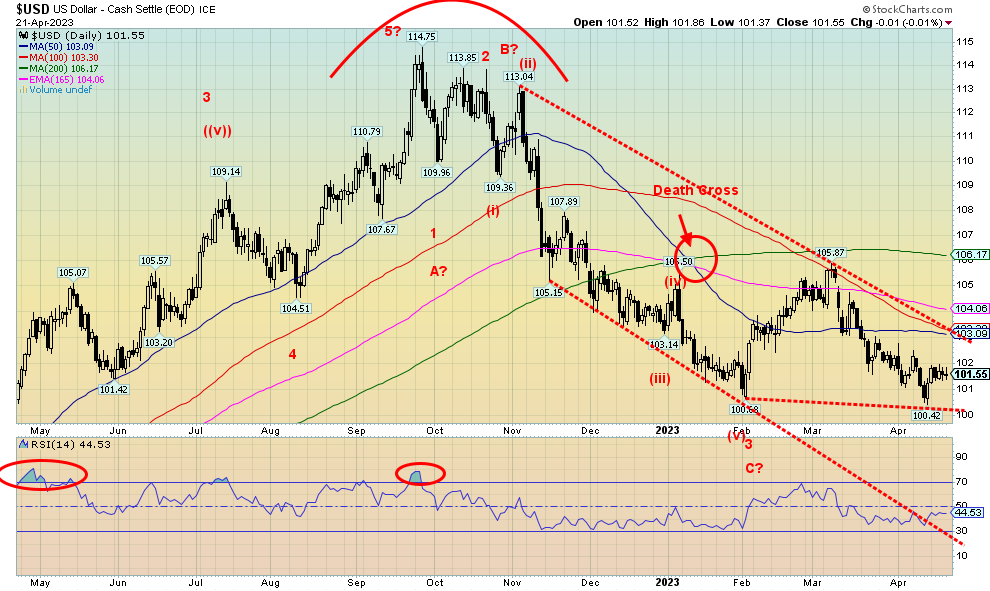
With a hawkish Fed and the stronger than expected PMI on Friday, we’d thought we’d see the US$ Index higher than it is. But at the end of the week the US$ Index was barely up with a gain of 0.3%. And that was despite gains by some of the currencies. The euro fell 0.1% but the Swiss franc was up 0.1%. The pound sterling gained 0.2% but the Japanese yen lost 0.3%. The Cdn$ lost 1.4%, thanks to lower oil prices.
Given the USDX rebound, we are wondering whether we’re seeing a correction to the move that saw USDX fall from 114.75 to a low of 100.68. We counted that one as falling in five waves. The move from 100.68 to a high of 105.87 may have been an A wave and this is the B wave. If that’s correct, then a C wave back towards to 105.87 or slightly higher could get underway. It would be a classic ABC flat correction if that happened. Only a breakdown under 100 would tell us that we are embarking instead on another wave to the downside. Resistance is seen up to 103 and again at 104 before moving towards the old high of 105.87 or the 200-day MA currently at 106.17.
While much has been made of de-dollarization, it is, as we have emphasized, not something that is going to happen overnight. The U.S still has the largest and most liquid capital markets, the largest military, and the largest economy. And it still has rule of law. All should help the U.S. dollar remain on top for the foreseeable
future, at least. But de-dollarization is underway and it is ultimately a threat to U.S. hegemony. As much as it is largely ignored. Recall Iraq had announced a switch to the euro for oil before the 2003 invasion and
Libya under Ghaddafi was trying to set up a Pan-African currency zone using the gold dinar as currency. Russia and China clearly cause a bigger concern and are not so easily dismissed.
Source: www.stockcharts.com
Stealing gold, it seems, is a pastime for some. This week’s heist of some $20 million of gold (although it said gold and other luxury items—Gucci bags?) at Toronto’s Pearson International Airport made headlines. The heist is really rather insignificant in a gold market estimated at US$13 trillion. But gold continues to hold sufficient mystique that a minor heist is major headlines. Who did it? Who knows? An inside job? Professionals? Russians? After all, Russia and China have been adding to their gold reserves. It was not said whether it was unmarked gold bars or well-identified gold bars. Marked bars will be a lot harder to unload unless the purpose was to sell them to others outside Canada. They can also be melted down and re-issued as unmarked gold bars. Still, one has to have the facilities to do that. All the more reason to assume it was a professional job.
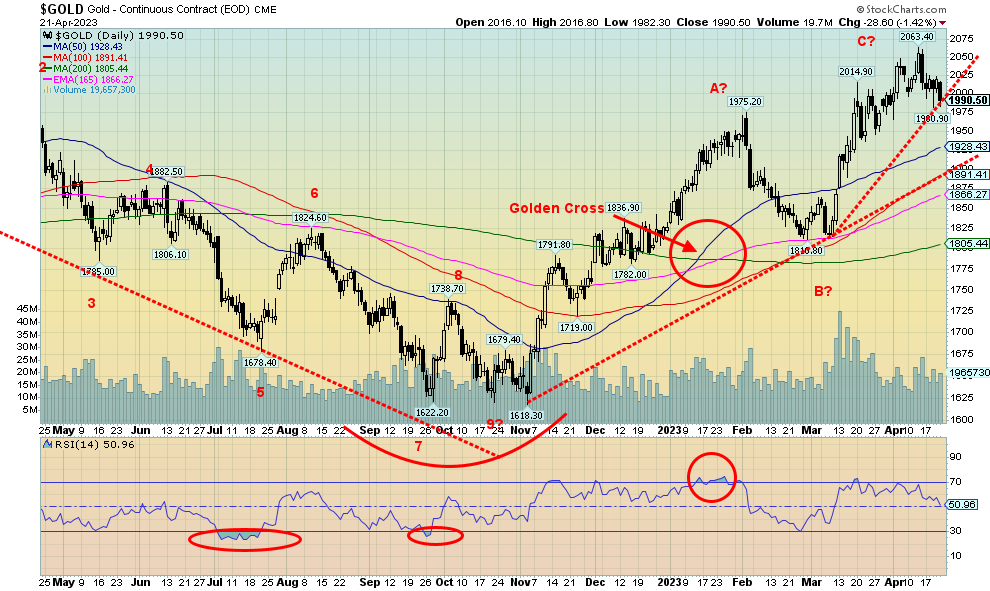
Gold fell this past week, thanks to a hawkish Fed, fear of rising interest rates, a bond market that backed up in yield, and continued signs of a potentially stronger than expected U.S. economy. The release of the April Purchasing Managers Index (PMI) on Friday that came in higher-than-expected spooked gold down and pushed
interest rates higher. That was ignoring the earlier higher weekly jobless claims and weaker Philly Fed. But we were overdue for a correction as gold had gone up some 13.4% from that March low. On the week, gold lost
1.3%. Silver fell more, down 1.6%, but platinum surprised and made fresh 52-week highs up 8.0% on the week.
Is platinum leading the way? Apparently supply concerns in South Africa, a leading platinum producer, are sparking some shortages. South Africa is the world’s largest producer of platinum and also has the largest reserves. The near PMs saw palladium gain 7.4%, but copper lost 3.2%. We put more stead in copper as a leader.
For gold, this was the worst week in eight. Silver snapped a five-week winning streak. U.S. Fed officials talked hawkish and that spooked gold. Most expect the Fed to hike 25 bp at the May 2–3 FOMC, but then there are also some expectations of a pause. Gold tends to rise when the Fed pauses. Inflation remains well above the Fed’s target of 2%, but at 5% it now equals the last reported year-over-year (y-o-y) inflation. So, a move to 5.25% would put it above and potentially spark a pause in rate hikes.
As long as gold holds above $1,975/$2,000 we should be okay. A drop below $1,975 is negative and under $1,965 a top is most likely in for the time being. Gold is also contending with weak seasonals from now into June and sometimes July as well. A pause would not be completely surprising. A move back above $2,025 would be positive and above $2,045 new highs are probable. We have to overhaul $2,060 to tell us we are going to set new highs above $2,079/$2,089. This zone remains a make-or-break zone. Either we make new highs or, as we have noted in some scenarios, we fail and head down towards $1,500. This is the third attempt at $2,100. The previous two failed. Third time success? Or a strikeout?
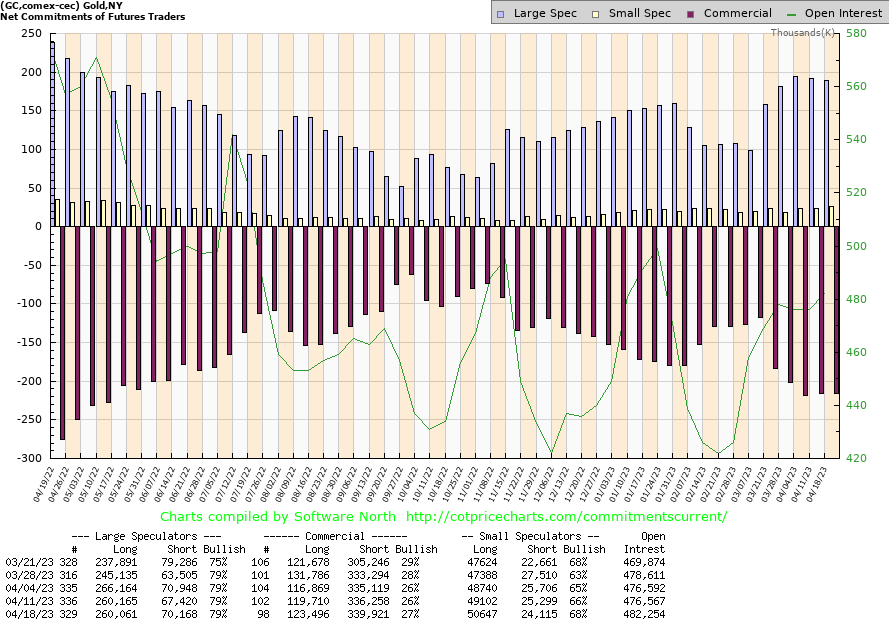
Source: www.cotpricecharts.com
Surprisingly, some improvement in the commercial COT (bullion companies and banks) this past week. It rose to 27% from 26% as longs added some 4,000 contracts, although shorts also added up over 3,000 contracts. The large speculators (hedge funds, managed futures, etc.) were steady at 79% even as their shorts rose by almost 3,000 contracts. Overall, open interest was up almost 6,000 contracts on a down week. We’d have preferred to see it fall.
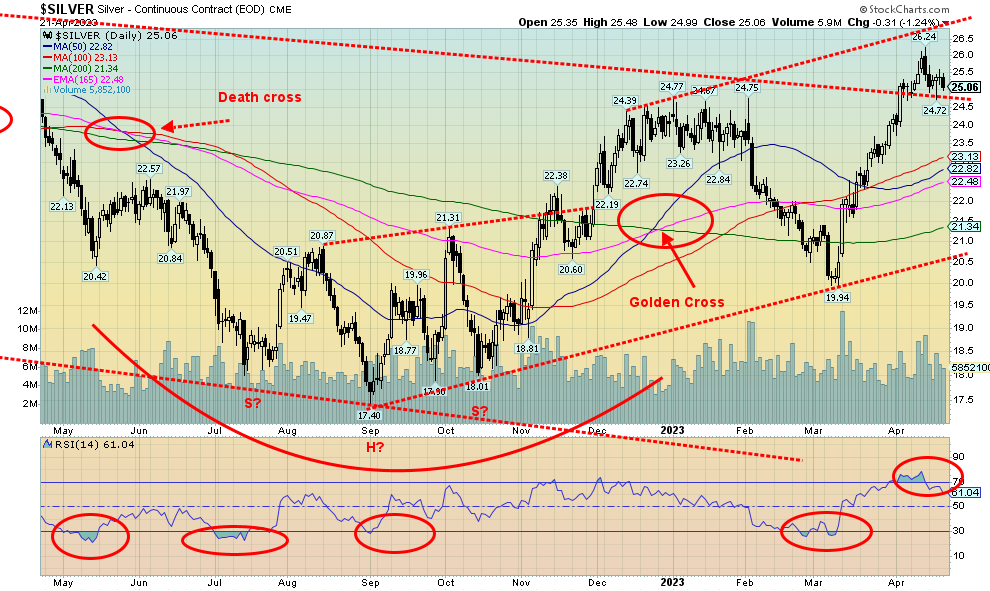
Source: www.stockcharts.com
As with gold, silver was pulled lower this past week, losing 1.6%. Overall, that’s not much considering that before this pullback silver had gained 31.6% from that March low. We were also overbought with the RSI over 70 for a number of days in April. Right now, silver appears to be caught between some support down to $24.75 and resistance up at $27. A break under $24.70 would be mildly negative and we could see silver fall towards $23 and much better support. That we recovered and saw new highs after that drop from a consolidation top to a low of $19.94 we have to view as positive. Note that top was at $24.77 and, as we noted, our support is at $24.75. The low this past week was $24.72. Hence the breakdown is more negative under $24.70. We need to overhaul that resistance up to $27 to tell us that we could then make an assault on the February 2021 high of $30.35. We continue to note that gold made new highs but to date silver has not. It’s a divergence we’d like to see resolved, but $50 is a long way off.
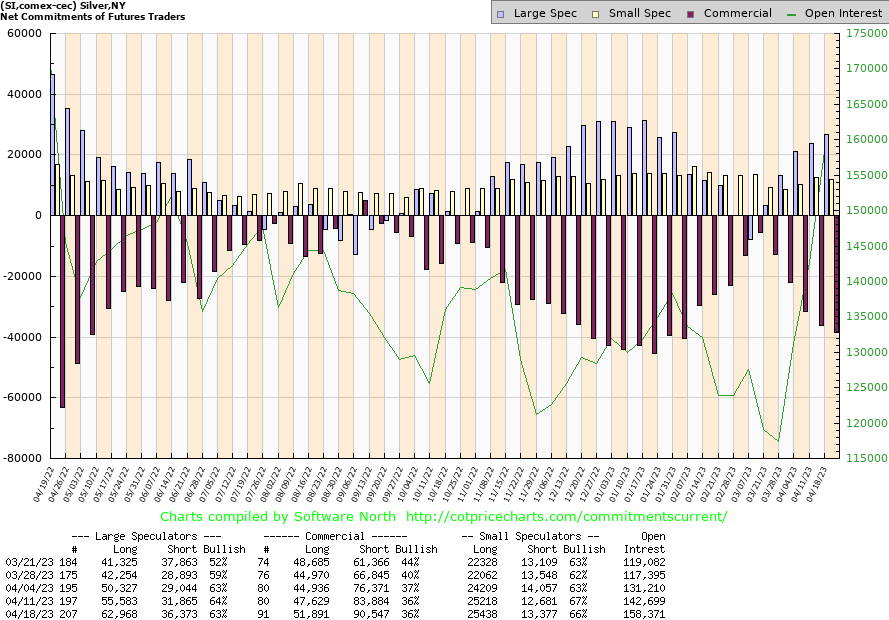
Source: www.cotpricecharts.com
The commercial COT for silver was steady at 36% this past week. However, longs rose over 4,000 contracts while shorts jumped almost 7,000 contracts. The large speculators dropped to 63% from 64% even as they added over 7,000 longs and almost 5,000 shorts. Open interest was up almost 16,000 contracts despite silver, like gold, falling on the week.
That the commercial COTs were the same or better this past week for both gold and silver we have to view as at least mildly positive.
Source: www.stockcharts.com
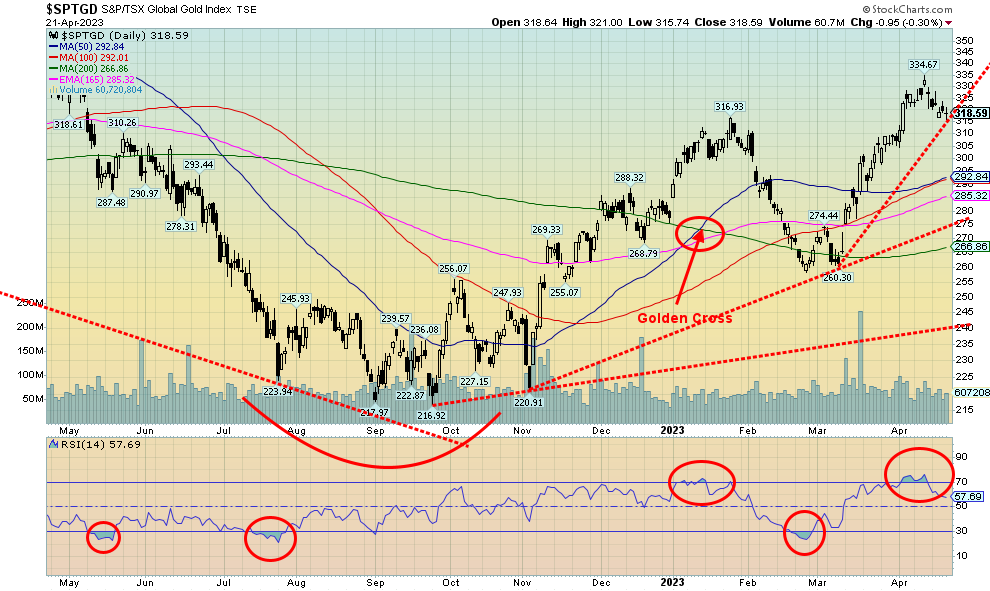
With both gold and silver down on the week, it is no surprise that the gold stocks were also down. The TSX Gold index (TGD) fell 2.6% while the Gold Bugs Index (HUI) fell even more, down 4.9%. Still both indices remain the best performing of the indices that we follow in 2023. The TGD is up 14.7% while the HUI is up 13.3% in 2023 thus far. This is the first correction since the March low of 260, so the pullback is not surprising. The TGD is also coming off an RSI over 70 that had stayed that way for a number of days. It is a 5% drop off the highs after earlier being up over 28% from that March low. A pullback to that turning up 50-day MA and 100-day MA near 292 would not be a complete surprise, as that would be considered a normal correction. We doubt we’ll get back that far, but it cannot be ruled out. A drop under 290, however, would be negative. That uptrend line is currently near 275. We closed at 318.59 on Friday. Re-taking out 330 would be positive and could suggest that new highs are possible above 334.67. That we recovered from that steep correction in January/March and saw new highs we have to view as positive. However, seasonal weakness could drag us lower in the coming days. As with gold, a weaker USDX and fears of higher interest rates could negatively impact thoughts of the Fed pausing.
Source: www.stockcharts.com
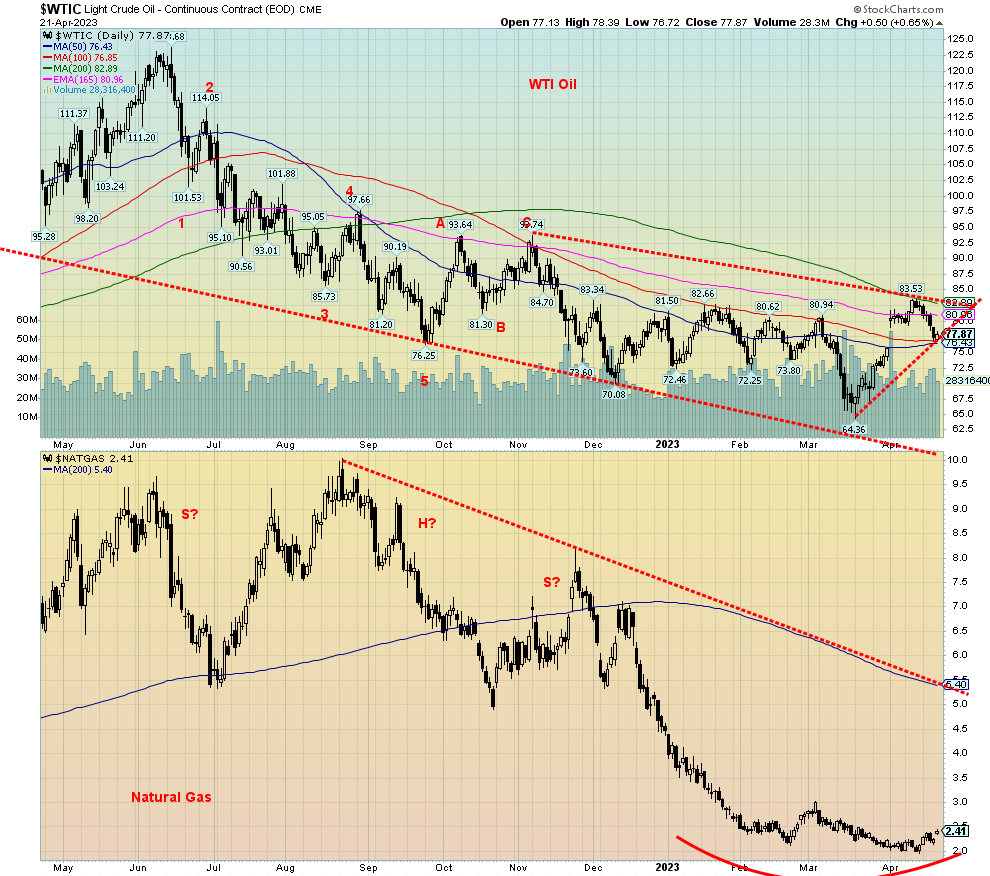
Worries about interest rate hikes. Worries about a slowing economy. They both conspired to help push oil prices lower this past week. An inventory decline and signs of potentially increased demand in China helped stabilize the market by the week’s end. We suppose we could just call it a correction to the gap up in March following the announcement that OPEC (led by Russia and Saudi Arabia) is poised to cut production to help keep oil prices high. That gap on the chart was between $75.72 and $79. With the drop this week we’ve penetrated 61.8% (a Fibonacci number) into that gap. If that turns out to be it, we should recover and eventually print new highs above $83.53. On the other hand, if that gap is closed, the odds favour WTI oil moving lower.
On the week, WTI oil fell 5.6% and is now down roughly 3% on the year. Brent crude fell 6.3%. However, natural gas (NG) jumped 14.2% on the week. Is the NG misery over? Maybe, but we’d like to see it first take out and close over $3 to begin to even think that a low is in. It’s a long way to that downtrend line from the top which also coincides with the 200-day MA near $5.40.
The energy stocks, unfortunately, pay more attention to oil than to NG as the ARCA Oil & Gas Index (XOI) fell 4.1% and Canada’s TSX Energy Index (TEN) dropped 2.7%. The indices have plenty of gassy stocks but they have more oil stocks.
An interesting political story we picked up this past week is evidence that Saudi Arabia is buying a lot of Russian diesel fuel, and that, on the other side, their exports of the same fuel to the EU have picked up substantially. The implication, of course, being that Saudi Arabia is laundering Russian oil, probably to get around sanctions. Would it be surprising? No, because Saudi Arabia has been making considerable moves to China and Russia by dealing oil to China in yuan, suddenly signing a peace agreement with Iran and now making moves to end the conflict in Yemen. Saudi Arabia also wants in BRICS. In a growing bipolar world, Saudi Arabia moving from being an ally of the U.S. and going to China and Russia is increasing the divide and could have further negative impacts on the price of oil, given that Saudi Arabia remains the world’s second largest producer of oil and has the world’s second largest reserves. The story, for the record, was reported in Bloomberg amongst others.
WTI oil bounced off the flattening 50 and 100-day MAs on Friday. Earlier WTI was pushed back from the 200-day MA. If the corrective pullback is correct, we should soon start rising again. A move over $80 once again could set up a move against the earlier high at $85.53 and the 200-day MA. Only filling that gap and dropping below $75 and $72.50 would be quite negative for WTI oil.
Copyright David Chapman 2023
|
GLOSSARY Trends Daily – Short-term trend (For swing traders) Weekly – Intermediate-term trend (For long-term trend followers) Monthly – Long-term secular trend (For long-term trend followers) Up – The trend is up. Down – The trend is down Neutral – Indicators are mostly neutral. A trend change might be in the offing. Weak – The trend is still up or down but it is weakening. It is also a sign that the trend might change. Topping – Indicators are suggesting that while the trend remains up there are considerable signs that suggest that the market is topping. Bottoming – Indicators are suggesting that while the trend is down there are considerable signs that suggest that the market is bottoming. |
Disclaimer
David Chapman is not a registered advisory service and is not an exempt market dealer (EMD) nor a licensed financial advisor. He does not and cannot give individualised market advice. David Chapman has worked in the financial industry for over 40 years including large financial corporations, banks, and investment dealers. The information in this newsletter is intended only for informational and educational purposes. It should not be construed as an offer, a solicitation of an offer or sale of any security. Every effort is made to provide accurate and complete information. However, we cannot guarantee that there will be no errors. We make no claims, promises or guarantees about the accuracy, completeness, or adequacy of the contents of this commentary and expressly disclaim liability for errors and omissions in the contents of this commentary. David Chapman will always use his best efforts to ensure the accuracy and timeliness of all information. The reader assumes all risk when trading in securities and David Chapman advises consulting a licensed professional financial advisor or portfolio manager such as Enriched Investing Incorporated before proceeding with any trade or idea presented in this newsletter. David Chapman may own shares in companies mentioned in this newsletter. Before making an investment, prospective investors should review each security’s offering documents which summarize the objectives, fees, expenses and associated risks. David Chapman shares his ideas and opinions for informational and educational purposes only and expects the reader to perform due diligence before considering a position in any security. That includes consulting with your own licensed professional financial advisor such as Enriched Investing Incorporated. Performance is not guaranteed, values change frequently, and past performance may not be repeated.
About the author


Website: https://www.enrichedinvesting.com
Disclaimer: David Chapman is not a registered advisory service and is not an exempt market dealer (EMD) nor a licensed financial advisor. We do not and cannot give individualised market advice. David Chapman has worked in the financial industry for over 40 years including large financial corporations, banks, and investment dealers. The information in this newsletter is intended only for informational and educational purposes. It should not be considered a solicitation of an offer or sale of any security. The reader assumes all risk when trading in securities and David Chapman advises consulting a licensed professional financial advisor before proceeding with any trade or idea presented in this newsletter. David Chapman may own shares in companies mentioned in this newsletter. We share our ideas and opinions for informational and educational purposes only and expect the reader to perform due diligence before considering a position in any security. That includes consulting with your own licensed professional financial advisor.