
“There is nothing like losing all you have in the world for teaching you what not to do. And when you know what not to do in order not to lose money, you begin to learn what to do in order to win. Did you get that? You begin to learn!”
—Edwin Lefèvre, American journalist, writer, diplomat, author of Reminiscences of a Stock Operator (1923) and others; 1871–1943
“Most obviously, the federal minimum wage, adjusted for inflation, has fallen by a third over the past half century, even as worker productivity has risen 150 percent.”
—Paul Krugman, American economist, professor of economics, City University of New York, columnist for The New York Times, winner of numerous awards, author of Arguing with Zombies: Economics, Politics, and the Fight for a Better Future (2020) and many others, including textbooks, academic books, etc.; b. 1953
“Economics is extremely useful as a form of employment for economists.”
—John Kenneth Galbraith, Canadian-American economist, diplomat, public official, intellectual, leading proponent of 20th century American liberalism, Harvard professor, served in U.S. administrations of Franklin D. Roosevelt, Harry S. Truman, John F. Kennedy, and Lyndon B. Johnson, U.S. ambassador to India 1961–1963, author of The Great Crash 1929 (1954) and others; 1908–2006
There is an old saying: “Never short a dull market.” Well, we have had a dull market. The markets move relentlessly higher without, it seems, a care in the world. May saw the S&P 500 gain just over 0.5%. Call it a grind upwards. It was the fourth consecutive monthly rise. Only January has been a losing month in 2021 so far, but barely. The TSX Composite did even better, gaining about 3.3%. It too was the fourth consecutive monthly increase. Since the March 2020 pandemic crash the markets have really only paused once—in September/October 2020 when the TSX fell roughly 8.4% and the S&P 500 was off 9.9%. Since then, the S&P 500 is up roughly 30% and the TSX has gained about the same. The TSX even hit a milestone at 20,000. With monthly RSIs now over 70, one has to wonder whether we could be poised for another correction. Yet, so far, none has developed.
While no correction has yet developed the indicators continue to spell potential trouble. It almost seems a waste of time to note that the Case Shiller Price Earnings (noted in the “Scoop” of May 31, 2021) is at the second highest level ever seen since the peak of the dot.com bubble in 1999/2000. Margin debt is at record levels ($847 billion as of April 2021 Source: www.Finra.org). According to JP Morgan, U.S. household equity allocation as a percentage of household total financial assets is at 41%, higher than it was at the peak of the dot.com bubble in March 2000 (39%) and higher than the peak of the 1960s—the peak in December 1968 (30%).
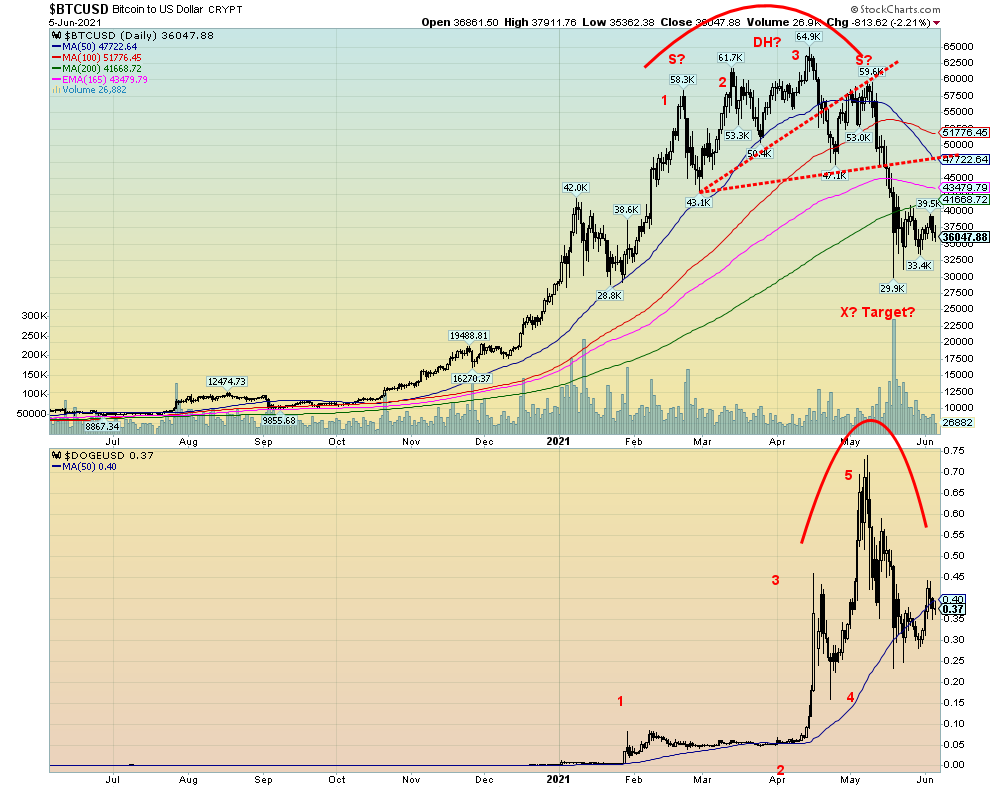
Millions of new brokerage accounts have been opened over the past 14 months. 2021 has seen a few crazes, including the cryptocurrencies and individual stocks like GameStop. Bitcoin (BTC) soared 124% to its peak in April. A joke meme, Dogecoin (DOGE) was up some 1,400% at one point. Since then, BTC has fallen 40% and DOGE is down 50%. Robinhood traders, and platforms like Reddit and other online brokers and platforms have become household names. AMC Entertainment (AMC/NY) became the latest craze, rising 500% in a mere 10 days (and has since fallen sharply, down over 30%).
There was also the Special Purpose Acquisition Companies (SPACs) craze. SPACs are IPOs that raise money with the intention of buying an unidentified firm. It is the ultimate speculation vehicle for well-healed investors. To the end of April 2021 some $160 billion had been raised, more than double all of 2020. SPACs have since all but collapsed. A Gallup survey on stock ownership dates from only June 2020 but says that some 55% of Americans own stock. However, 51% of stock is held by the 1% and 96% of all stock is held by the top 20%. The bottom 50% effectively hold close to zero. Yet it has been online traders who have been leading the charge in these crazes and short squeezes. High net worth investors have led the SPAC craze. Institutions jumped into cryptos.
Source: www.stockcharts.com
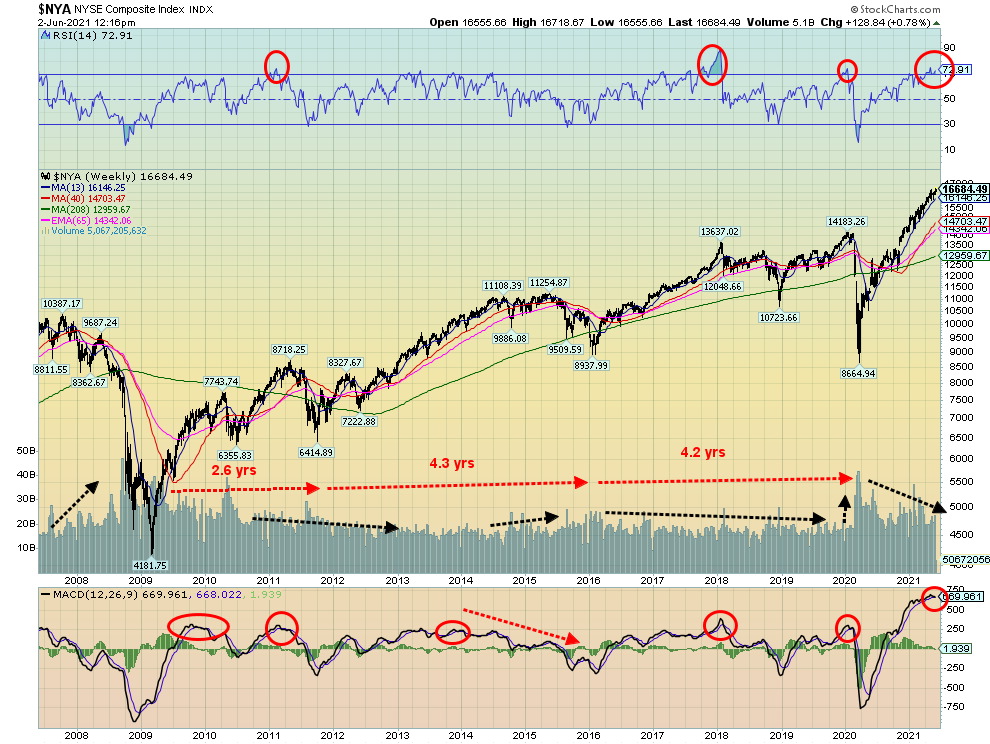
Above is a chart of the NYSE going back to 2007 and showing its sharp rise out of the March 2020 pandemic crash. Volume has tailed off coming out of the crash. The heavy volume periods were surrounding the 2008 financial crash and the 2020 pandemic crash. Everyone will say yes, the market crashed, but then the markets recovered and rose to new highs. Yes, the markets rose to new highs fueled by record low interest rates and massive easing of monetary policy through quantitative easing (QE). Pour trillions of dollars into the financial system and all that money has to go somewhere. Too much money chasing too few goods (stocks). Hence inflation—stock market inflation. Since 2008 U.S. GDP has increased 60% but U.S. Federal debt is up 178%. The Fed’s balance sheet is up 259%, the S&P 500 up over 525% from March 2009, U.S. Federal spending is up 131%, and total debt (government, corporate, and household) is up 73%. It has taken a lot of money to generate an additional dollar of GDP over $2 debt to create $1 GDP.
We have often noted the 4-year cycle in stocks. The chart of the NYSE notes that the 2011 low came 2.6 years after the March 2009 low. This was a difficult one as it seemed too early—the range is usually about 3–5 years. The 2016 low came in nicely at 4.3 years following the 2011 low and the March 2020 low was 4.2 years following the 2016 low. The 2016 low was also the 6.5-year cycle low (range 5–8 years) being 6.9 years from the March 2009 low. The next one is due in 2021–2024 with 2022 likely. While the 4-year cycle and the 6.5-year cycle sometimes line up as they appear to have done in 2016, that does not necessarily always happen.
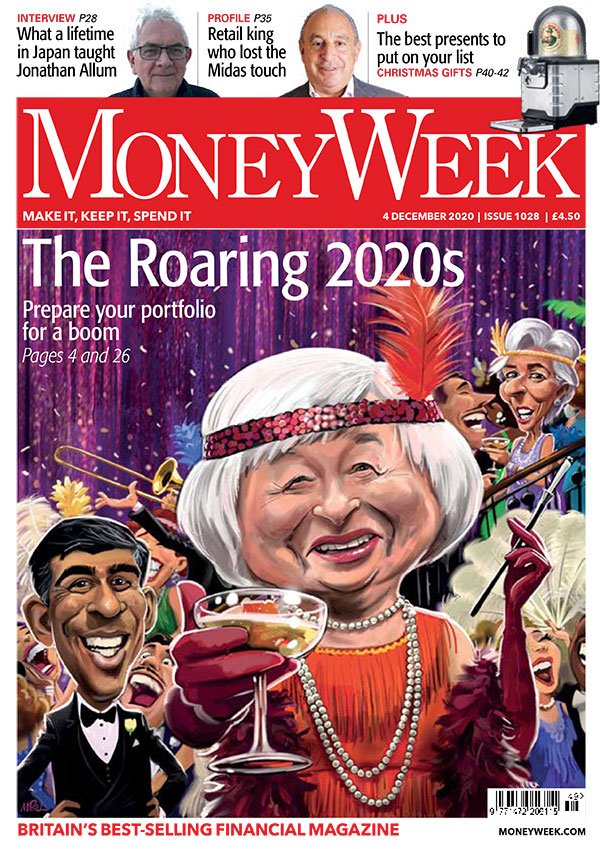
Elliott Wave International (www.elliottwave.com) has a saying that “bull markets tend to end on great news.” In their latest issue June 2021, they note a number of headlines of expectations of a booming economy to come. Recall a few months ago the front cover of the December 2020 issue of MoneyWeek, with Janet Yellen as a flapper? MoneyWeek wasn’t the only one with glowing front covers like that. A couple of titles that Elliott Wave noted were: “The Economy is on the Cusp of a Major Boom and Economists believe it could Last” (CNBC.com April 9, 2021) and “U.S. Economy Barrelling Toward a Boom: and it’s going to be Bigger, Faster and Wider Than You Expect” (Business Insider, April 24, 2021).
But then there are also the negative headlines: “The Market just Issued a MAJOR Warning of What’s to Come” (Phoenix Capital, May 24, 2021), “The Dollar is Going to Collapse” (Peter Schiff on Greg Hunter’s USAWatchDog.com), and Robert Shiller: “Wild West’ mentality is gripping housing, stocks and crypto” (CNBC.com May 23, 2021).
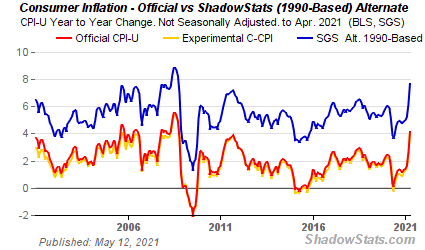
So, which is it? Boom? Or bust? Inflation is becoming an issue, although there is no sustained evidence of it yet. High inflation is now reflective of the huge jump from a year ago April when deflationary forces reigned and prices actually plunged during the pandemic crash of March 2020. But since then, prices have soared, thanks to supply bottlenecks and supply shortages which are slowly being resolved. A U.N. report noted that the Food and Agriculture Organization’s monthly food price index has soared 40% in May from a year ago. Price hikes like that have more of a negative impact in developing countries. A devaluing U.S. dollar also contributes to inflation. Given what is going on with the monetization of debt and more, what they are doing is debasing the U.S. dollar. That makes imports more expensive. The U.S. remains a net importer to the tune of about $975 billion annually.
But again, given numerous supply disruptions, it is probably not a surprise. Will it dissipate going forward? Or turn into hyperinflation, as even respected economist John Williams of Shadow Stats (www.shadowstats.com) has said? Williams believes the Fed has painted itself into a corner and is in danger of losing control. The only way out is inflation or implosion. To prevent an implosion, the Fed (and other central banks) have to maintain their money printing – QE. That the Fed itself is a major purchaser of the bonds means that they are monetizing the debt. Maintaining QE assures that there will be inflation. Whether it shows up as rising prices or rising asset prices is moot. But if price inflation rises past 5%, then we would have a problem and stock markets are sure to go through another 1970s style bear market. But then that would be good for commodities, particularly gold. Investors might want to own some or at least gold’s still cheap sidekick—silver.
Source: www.moneyweek.com
Source: www.shadowstats.com
The Pandemic Rages On!
The pandemic may be raging on but nonetheless it is slowing. Well at least the official numbers show that it is slowing. Average daily cases now at about 431 thousand/day is starting to reach down into the numbers seen in the early months of 2021. Average daily deaths are now under 10,000 again back where it was in the early months of 2021 before the third wave took hold. In the U.S. daily deaths are now under 400 which is about where it was at the outset of the pandemic that got underway over a year ago. Daily cases are about 14,000 again about where it was when the pandemic got underway over a year ago. Canada’s cases are down around 2,000/day less than where it was during the lull between the second and third wave. Daily deaths are just a bit over 30. All of this is very encouraging and might get us opened up soon. Even India has seen its daily cases and deaths drop sharply. Although it says nothing about the potentially thousands even hundreds of thousands or more that have occurred in the country where the cause is something else. Everywhere the number of deaths in a country has been above what would be considered normal meaning it is outside the normal range of expected deaths.
Sunday June 6, 2021 – 13:59 GMT
World
Number of cases: 173,788,224
Number of deaths: 3,737,925
Cases per million: 22,295
Deaths per million: 479.5
U.S.A.
Number of cases: 34,204,374
Number of deaths: 612,203
Cases per million: 102,777
Deaths per million: 1,840
Canada
Number of cases: 1,391,174
Number of deaths: 25,712
Cases per million: 36,563
Deaths per million: 676
Source: www.worldometers.info/coronavirus
Chart of the Week
US Job Numbers
Source: www.shadowstats.com
For the second month in a row the job numbers are a bit of a disappointment. Nonfarm payrolls for May came in at 559,000. That was below the expected 670,000. April was revised upwards to 278,000. The U.S. lost 22,362 thousand jobs back in March/April 2020. They have now recovered 14,784 thousand, leaving them still short 7,578 thousand. The complaint is that there are labour shortages, despite so many unemployed. The other complaint is that the unemployed have too many benefits so they don’t want to work. Some 25 states (all Republican) are cutting unemployment benefits early, impacting some 3.7 million workers. There are fears that in turn will set off a wave of evictions.
While benefits may be playing a role, there is little evidence to support that premise. The reality is much more complex. Women having problems finding affordable child care, job mismatches, skill mismatches, poor retention of previous workers, people going back to school to upgrade their skills, distance and affordability to live near where the jobs are, supply shortages—are all amongst the reasons. Many jobs are not coming back because the companies have closed their doors for good. There remains skepticism that the COVID has not gone away so there are safety concerns from many would-be workers. In the manufacturing sector there remains considerable concern from potential workers that their jobs would be outsourced, which is causing hesitancy in accepting jobs.
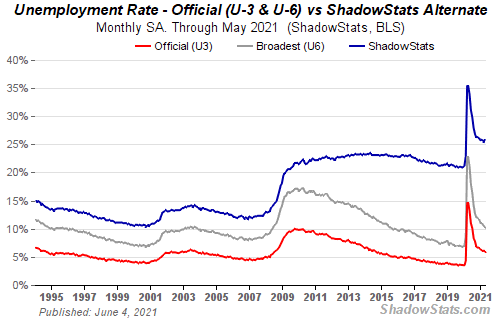
The official unemployment rate (U3) fell to 5.8% in May from 6.1% in April. It was 3.5% in February 2020. As usual, the Bureau of Labour Statistics (BLS) acknowledges that they have understated the unemployed by some 478 thousand in May vs. 558 thousand in April. That would raise the U3 unemployment rate from 5.8% to 6.1%. Fully accounting for the pandemic unemployment of people missing from the labour force would actually add about 6 million to the unemployment ranks and raise the unemployment rate to the 10% range. The labour force participation rate also fell to 61.6% from 61.7%. In February 2020 it was 63.3% and 67.3% in March 2000 at its peak. That translates into fewer people in the labour force and helps lower the unemployment rate because many of the unemployed are not even considered to be a part of the labour force. The employment population ratio was 58.0% in May vs. 57.9% in April. In February 2020 it was 61.1%.
The U6 unemployment rate, which is the U3 rate plus short-term discouraged workers (less than one year) and those marginally employed wanting full-time work, slipped to 10.2% from 10.4% in April. The Shadow Stats (www.shadowstats.com) rate surged in May to 26.0% vs. 25.5% in April as more people were effectively left out of the labour force because they have now been unemployed for over one year. The Shadow Stats rate is U6 plus long-term unemployed discouraged workers who were defined out of the labour force in 1994. What that tells us is there is an army of long-term unemployed out there. Surviving somehow, we suspect.
The total labour force contracted by 53,000 in May from 160,988 thousand in April. Those not in the labour force but discouraged totaled 6,600 thousand in May vs 6,647 thousand in April. Full-time workers were up 223 thousand in May while part-time workers gained 178 thousand jobs. The total unemployed was 9,316 thousand, down 496 thousand in May but the actual number unemployed is 16,593 thousand using the U6 rate. Using the Shadow Stats rate the actual number of unemployed is 41,843 thousand. In February 2020 the total number unemployed was 5,717 thousand. The number of people considered not in the labour force rose to 100,275 thousand in May from 100,115 thousand in April. Of that, 55.5 million are retirees and 9.6 million are disabled. In the U.S., 36.1 million are considered to be living in poverty—10.8% of the population. There are 18.6 million millionaires of which 660 are billionaires.
The report has to be viewed as a bit of a disappointment. Progress is being made, but the U.S. has recovered only 66% of the jobs lost at best. This is slow progress and is actually behind Canada. As a result of the report the U.S. dollar fell, bond yields fell, and the stock market rose (anticipating more stimulus, we suspect). This report is not likely to change the Fed and the easy monetary conditions should continue to prevail. The Fed is not going to knee jerk react to one report. They’ll want to see a strong burst of hiring before it even contemplates changing its monetary stance. As supply constraints ease up, that should help temper the rise in inflation. As one pundit quipped, “you can’t just flip a switch and turn the economy back on.” “Recovery is messy and it’s going to take more time than anyone would like.” The lower-than-expected numbers in the report might help the White House administrations job-creation bill.
Overall, this report is not particularly good. Recovery is going to take time. The U.S. continues to be on pace for an L recovery not a V. That should also help temper inflationary pressures.
Canada Job Numbers
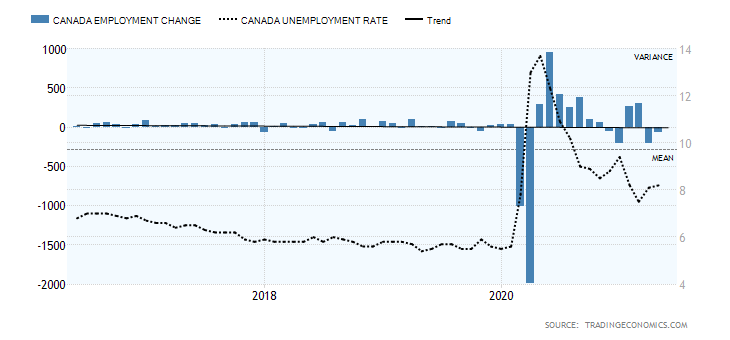
Source: www.tradingeconomics.com, www.statcan.gc.ca
In many provinces, health restrictions were tightened in April as a result of the third wave that also spread into May. The result was that the number of jobs fell for the second month in a row. Canada lost 68,000 jobs in May. The market had only expected to lose 20,000 jobs. Despite the loss of jobs Canada remains in a relatively good position. Canada lost 3,004.5 thousand jobs last March/April 2020 but has recovered 2,449.8 thousand of them or 81.5%. That’s well above the 66% recovery rate seen in the U.S. Full-time employment fell 13,800 jobs while part-time employment was down 54,200 jobs.
There were fewer people in the labour force working or looking for work as the labour force participation rate fell to 64.2% vs. 64.9% in April. It is the lowest rate since last August. As a result, the unemployment rate jumped to 8.2% from 8.1% in April. That number was largely in line with expectations. The unemployment rate, which is calculated much like the U.S. calculation, was 7.1%. Again, a reminder of Canada’s higher labour force participation rate. The labour force participation rate for young people 15–24 and women both fell last month, reflecting fewer in the labour market. The R8 unemployment rate, which includes discouraged workers and involuntary part-time workers, fell to 11.3% from 11.7%.
The number of people employed was 18,559 thousand, down 0.4% in May. Long-term unemployment remains a problem as there were 478 thousand unemployed 27 weeks or longer. Before the pandemic that number was only 299 thousand. With employment down it was no surprise to discover that retail trade employment fell by 29 thousand. That number is over 140 thousand, below pre-pandemic numbers. Employment in accommodation and food services was little changed in May but remains 364 thousand below its pre-pandemic levels. Other areas particularly hard-hit were barber shops and hair salons, many of them potentially closing their doors for good. Of the provinces, Ontario suffered the most, losing 32 thousand jobs in May. Canada’s labour force is 20,211.6 thousand of which 15,252.7 thousand are employed full-time and 3,306.5 thousand or 16.4% are considered part-time. There are 1,652.3 thousand unemployed. However, using the R8 number the number of unemployed is 2,081.8 thousand. Some 5.1 million workers are still working from home.
If things open up further into June, we would expect to see the jobs picture brighten a little and maybe even bounce back quite strongly. And more people might be called back to the office as well, lowering the number working from home.
Despite the job numbers, the Canadian dollar rose a small 0.1% while bond yields slipped. The TSX Composite rose. Maybe the number wasn’t as rosy as many expected or wanted, but the market reaction appears to be positive.
The rest of this page is blank
MARKETS AND TRENDS
|
|
|
|
% Gains (Losses) Trends
|
|||||
|
|
Close Dec 31/20 |
Close Jun 4/21 |
Week |
YTD |
Daily (Short Term) |
Weekly (Intermediate) |
Monthly (Long Term) |
|
|
Stock Market Indices |
|
|
|
|
|
|
|
|
|
S&P 500 |
3,756.07 |
4,229.89 |
0.6% |
12.6% |
up |
up |
up |
|
|
Dow Jones Industrials |
30,606.48 |
34,756.39 |
0.7% |
13.6% |
up |
up |
up |
|
|
Dow Jones Transports |
12,506.93 |
15,467.47 |
(1.8)% |
23.7% |
neutral |
up |
up |
|
|
NASDAQ |
12,888.28 |
13,814.49 |
0.5% |
7.2% |
neutral |
up |
up |
|
|
S&P/TSX Composite |
17,433.36 |
20,029.19 (new highs) |
0.9% |
14.9% |
up |
up |
up |
|
|
S&P/TSX Venture (CDNX) |
875.36 |
978.01 |
1.2% |
11.7% |
up |
up |
up |
|
|
S&P 600 |
1,118.93 |
1,383.80 |
0.9% |
23.7% |
up |
up |
up |
|
|
MSCI World Index |
2,140.71 |
2,358.98 (new highs) |
0.8% |
10.2% |
up |
up |
up |
|
|
NYSE Bitcoin Index |
28,775.36 |
36,685.18 |
(0.4)% |
27.5% |
down |
neutral |
up |
|
|
|
|
|
|
|
|
|
|
|
|
Gold Mining Stock Indices |
|
|
|
|
|
|
|
|
|
Gold Bugs Index (HUI) |
299.64 |
313.18 |
(1.8)% |
4.5% |
up |
up |
up |
|
|
TSX Gold Index (TGD) |
315.29 |
327.33 |
(1.5)% |
3.8% |
up |
neutral |
up |
|
|
|
|
|
|
|
|
|
|
|
|
Fixed Income Yields/Spreads |
|
|
|
|
|
|
|
|
|
U.S. 10-Year Treasury Bond yield |
0.91 |
1.56% |
(1.3)% |
71.4% |
|
|
|
|
|
Cdn. 10-Year Bond CGB yield |
0.68 |
1.46% |
(2.7)% |
114.7% |
|
|
|
|
|
Recession Watch Spreads |
|
|
|
|
|
|
|
|
|
U.S. 2-year 10-year Treasury spread |
0.79 |
1.41% |
(2.1)% |
78.5% |
|
|
|
|
|
Cdn 2-year 10-year CGB spread |
0.48 |
1.15% |
(1.7)% |
139.6% |
|
|
|
|
|
|
|
|
|
|
|
|
|
|
|
Currencies |
|
|
|
|
|
|
|
|
|
US$ Index |
89.89 |
90.13 |
0.2% |
0.3% |
down |
down |
down |
|
|
Canadian $ |
0.7830 |
0.8282 (new highs) |
0.1% |
5.7% |
up |
up |
up |
|
|
Euro |
122.39 |
121.71 |
(0.2)% |
(0.6)% |
up |
up |
up |
|
|
Swiss Franc |
113.14 |
111.23 |
0.1% |
(1.7)% |
up |
up (weak) |
up |
|
|
British Pound |
136.72 |
141.65 |
(0.2)% |
3.6% |
up |
up |
up |
|
|
Japanese Yen |
96.87 |
91.30 |
0.3% |
(5.8)% |
down |
down |
down |
|
|
|
|
|
|
|
|
|
|
|
|
Precious Metals |
|
|
|
|
|
|
|
|
|
Gold |
1,895.10 |
1,892.00 |
(0.7)% |
(0.2)% |
up |
up |
up |
|
|
Silver |
26.41 |
27.90 |
(0.4)% |
5.6% |
up |
up |
up |
|
|
Platinum |
1,079.20 |
1,164.40 |
(1.5)% |
7.9% |
down |
up |
up |
|
|
|
|
|
|
|
|
|
|
|
|
Base Metals |
|
|
|
|
|
|
|
|
|
Palladium |
2,453.80 |
2,842.20 |
0.4% |
15.8% |
neutral |
up |
up |
|
|
Copper |
3.52 |
4.53 |
(3.2)% |
28.7% |
neutral |
up |
up |
|
|
|
|
|
|
|
|
|
|
|
|
Energy |
|
|
|
|
|
|
|
|
|
WTI Oil |
48.52 |
69.62 (new highs) |
5.0% |
43.5% |
up |
up |
up |
|
|
Natural Gas |
2.54 |
3.10 |
3.7% |
22.1% |
up |
up |
up |
|
Source: www.stockcharts.com, David Chapman
Note: For an explanation of the trends, see the glossary at the end of this article.
New highs/lows refer to new 52-week highs/lows and in some cases all-time highs.
Source: www.stockcharts.com
In a potentially historic deal, the G7 nations have decided to revamp corporate taxes so that it ends the so-called race to the bottom of corporate taxes and adopts a minimum (15%) global tax. More details can be found here: https://www.bloomberg.com/news/articles/2021-06-05/g-7-reaches-historic-deal-on-minimum-global-corporate-tax-rate?srnd=premium-canada&sref=5lk0w2FC.
Stock markets approached their all-time highs this past week but failed to make any new ones. The S&P 500 gained 0.6% on the week, the Dow Jones Industrials (DJI) was up 0.7, the Dow Jones Transportations (DJT) faltered and fell 1.8%, while the NASDAQ was up 0.5%. That the DJT faltered as the others gained was a divergence. The small cap S&P 600 gained 0.9%. In Canada, the TSX was up 0.9% to new all-time highs while the TSX Venture Exchange (CDNX) gained 1.2%.
In the EU, the London FTSE was up 0.9% and the Paris CAC 40 hit new all-time highs, up 0.5% as did the German DAX, gaining 1.1%. In Asia, China’s Shanghai Index (SSEC) fell 0.3% while the Tokyo Nikkei Dow (TKN) was down 0.7%. The MSCI World Index hit new all-time highs gaining 0.8% on the week. As the Western world opens up the emerging economies should benefit.
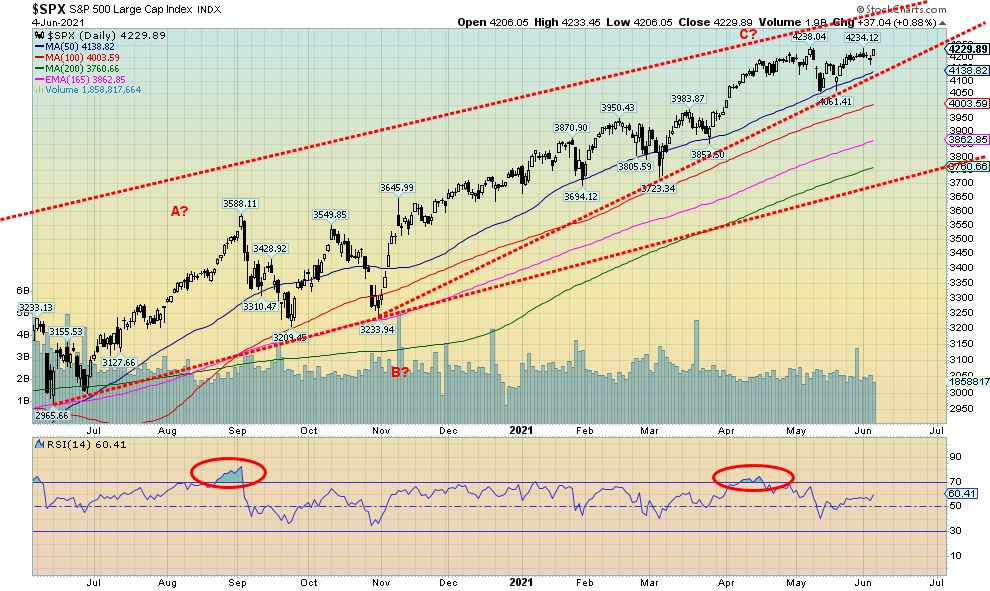
The S&P 500 and the major U.S. indices continue to exhibit signs of a potential top. If that’s correct, it should only be a temporary top before another rally takes us once again to new all-time highs. The first sign of trouble would be a break under 4,170. Confirmation of a breakdown would come under 4,050. That area might also be the neckline of a possible forming double top. Naturally, any double top is not confirmed and only comes into to play if the S&P 500 were to fail to make new all-time highs in the next week or so. New highs this coming week cannot be ruled out. Nevertheless, failure to make new highs raises the potential for the double top scenario and the break under 4,050 could set off further declines, targeting potentially down to between 3,800 and 3,900.
Our indicators continue to reside in nosebleed territory. Advance/decline lines are still rising as is cumulative up-down volume favouring the bulls and new highs–new lows, all suggesting that the advance should continue. The number of stocks trading above their 200-day MA continues to be in what we call nosebleed territory. Bullish percent indices are consistently over 80%. The put/call ratio still heavily favours calls. The market figures it can’t lose. The VIX Volatility Indicator continues to move lower.
We can’t say precisely when the market will make its top and actually break. Hence, our preference is to await a sign. The first sign would be new lows under 4,167, the June 3 low. Confirmation would come under 4,050. New highs keep the fantasy alive. Still, even if we correct down, we are not looking for much more than, say, 10% at this time.
,
Source: www.stockcharts.com
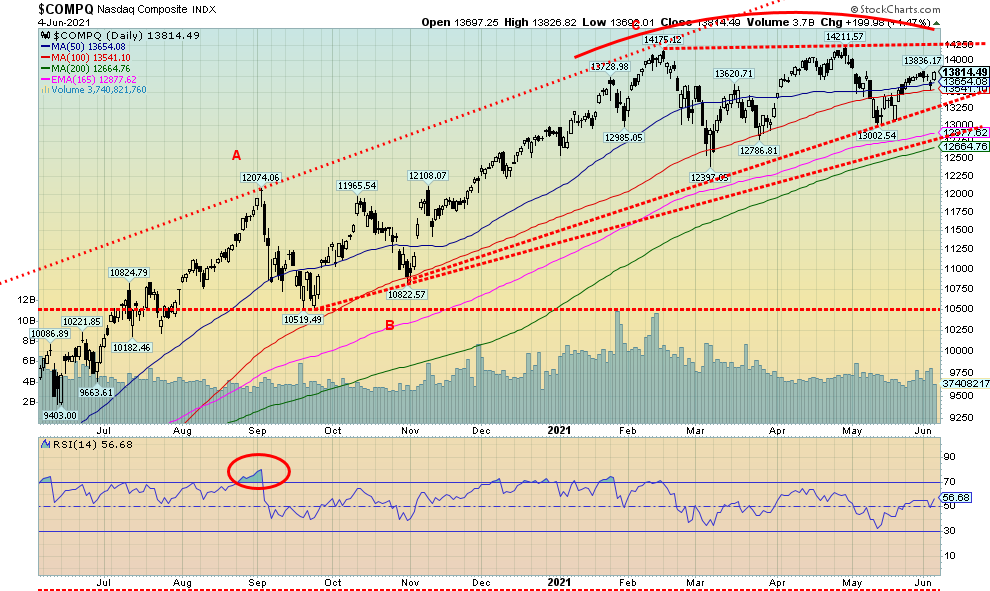
The NASDAQ continues to trace out what could be a possible top. Unlike the other major U.S. indices, the NASDAQ has failed repeatedly of late to make new all-time highs. This past week the NASDAQ did gain 0.5% but remains short of its all-time high seen in April. The NASDAQ is also making what could be a double top with the high at 14,175 in February and the high of 14,211 in April. The neckline would currently be around 13,250 and a solid break under that level could target the NASDAQ to fall to 11,450. The high-tech stocks that make up the NASDAQ continue to falter although this past week was mixed. Facebook gained 0.5% (and banned Donald Trump until 2023), Apple was up 1.0%, Amazon lost 0.5%, Netflix dropped 1.6%, and Google did make all-time highs up 1.7%. Tesla dropped a sharp 4.2% while Twitter gained 1.7%. The ultimate value stock Berkshire Hathaway was up 0.7%.
We continue to see little that’s positive in the chart of the NASDAQ and the next good move should be down. The question is how much. If the double top is fulfilled, then the decline could be almost 20% from the April high. A move above 14,000 would be positive and could suggest new highs ahead.
Source: www.stockcharts.com
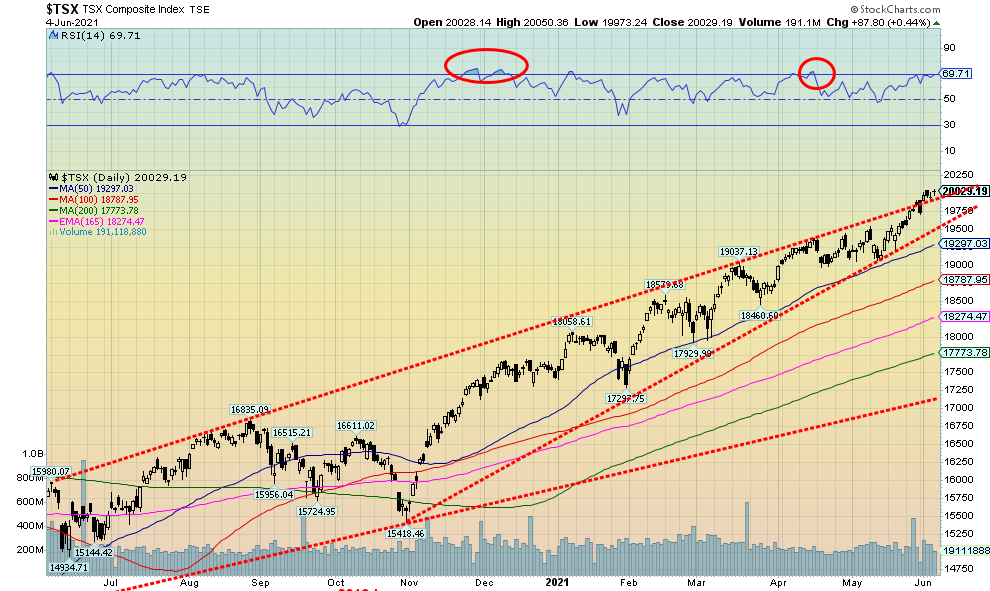
Pop out the champagne as the TSX Composite hit 20,000 this past week. A new record. The TSX also appears to be breaking to the upside out of the channel of what we thought was an ascending wedge triangle. We are not yet sure what to make of it. An overthrow? With an RSI hovering around 70 the TSX is extended, but it doesn’t necessarily mean a top is in.
This past week the TSX Composite gained 0.9% to new all-time highs. The junior TSX Venture Exchange (CDNX) was also up, gaining 1.2%. Despite the all-time high, five of the 14 sub-indices actually fell this past week. The leader was Golds (TGD), down 1.5%. Other losers were Consumer Staples (TCS), down 0.6% despite making 52-week highs, Health Care (THC) -0.4%, Industrials (TIN) -0.4%, and Materials (TMT) -0.5%. The big gainer was Energy (TEN), up 8.9% and making fresh 52-week highs. Others making new highs were Financials (TFS) +0.5%, Income Trusts (TCM) +1.0%, and Telecommunications (TTS) +1.3%. The two most heavily weighted sub-indices are Financials and Energy so it is no surprise that the TSX itself made new all-time highs.
The TSX Composite is currently 3.8% above the 50-day MA. In February 2020 before the March 2020 crash the TSX was only 3.3% above the 50-day MA. It has been higher as in 2007 at the top the TSX was 4.2% above the 50-day MA. So, it is not necessarily suggesting a top but it is suggesting caution as usually that spread doesn’t stay there for long. The first sign of trouble would be a decline under 19,700. Confirmation of at least a temporary top would come under 19,300. As with the U.S. indices we’d be exercising caution here, given the extended nature of the index.
Source: www.stockcharts.com
We continue to see nothing here that would suggest the cryptos are about to recover and soar to new highs. The risks remain to the downside. After trying to “pop” earlier in the week, cryptos were fading by the end of the week and appear poised to fall again into this coming week. Targets remain for Bitcoin (BTC) down to at least 25,000. Dogecoin breaks down under 25 cents. The DJI and BTC often follow each other with lags. So BTC falling does not bode well for the DJI either. Eventually it catches up.
U.S. 10-year Treasury Bond/Canadian 10-year Government Bond (CGB)
Source: www.tradingeconomics.com, www.home.treasury.gov, www.bankofcanada.ca
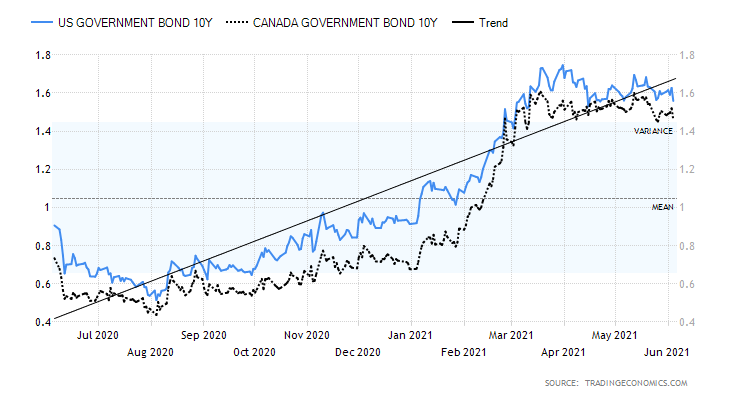
With the weaker than expected U.S. job numbers on Friday, bond yields slipped. The U.S. 10-year treasury note fell to 1.56% this past week, down from 1.58% the previous week. The most recent high was seen at 1.74%. The Canadian 10-year Government of Canada bond (CGB) dropped to 1.46% from 1.50. All this came despite taper talk and some stronger economic numbers earlier in the week. The ISM Manufacturing Index came in at 61.2, above the expected 60.9. The Dallas Fed Manufacturing Index was at 34.9 vs. the expected 32. Earlier, the Chicago PMI came in at 75.2 for May, the highest level seen since the 1970s. ADP employment was 978 thousand well above the expected 650 thousand. That spurred thoughts that Friday’s nonfarm payrolls would also beat expectations (they didn’t). The weekly initial claims slipped under 400,000 for the first time in over a year as 385 thousand filed last week vs. 405 thousand the previous week and a forecast of 400 thousand.
It is noteworthy that bond yields have been sliding, despite some stronger than expected economic numbers. Bonds tend to lead the market and what the bond market appears to be telling us is that the high expectations of the U.S. rebound are probably not going materialize. Possibly Friday’s job numbers were the first good sign. Still, we need to see the 10-year break under 1.50% and better under 1.40% to suggest to us that we are poised to fall further towards 1.20% and 1.00%. We are not 100% convinced yet that the recent rise in rates is over, but with bond yields falling in the face of good numbers it is a possible tell-tale sign.
If the 10-year can hold above 1.50% then odds favour the higher rate scenario and then this pause is nothing more than a consolidation/corrective period.
Source: www.stockcharts.com
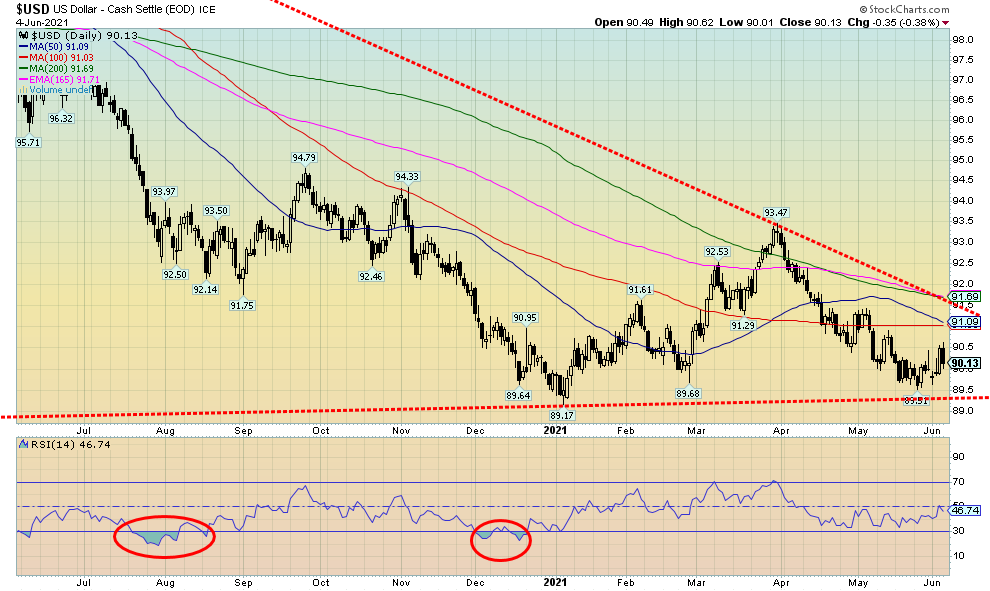
The US$ Index surged on Thursday, spurred on by thoughts of tapering and possible higher interest rates, but floundered on Friday following the release of the May job numbers which were weaker than expected. On the week the US$ Index rose a small 0.2%. Movements in other currencies were muted as well. The euro fell 0.2%, the Swiss franc was up a small 0.1%, the pound sterling was off 0.2%, while the Japanese yen gained 0.3%. The Canadian dollar made fresh 52-week highs at 83.28 and closed the week up 0.1%.
We have to view Thursday’s and Friday’s action for the US$ Index as somewhat bearish as the strong up day was immediately followed by a down day. Some were touting Thursday’s up move as a breakout but we fail to see that one as we remain below all the key MAs of 50, 100, and 200. The trend is down and we don’t appear to have finished this downtrend. What remains is a firm break of the recent low of 89.51 which should also mean a move below the January low of 89.17. Once new lows are seen, potential could be down to 85/86 with minimum targets of 88.
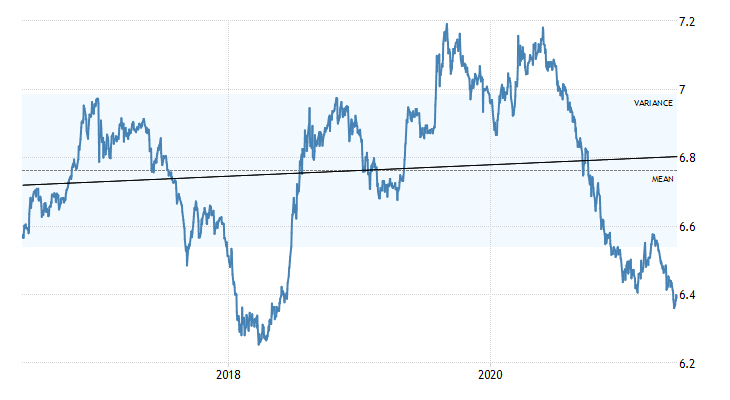
We have noted that Russia intends on dumping all of its U.S. dollars from funds so as to lessen their vulnerability to U.S. sanctions. As well, China is sitting on billions of U.S. dollars. China’s foreign exchange reserves hold some $3.2 trillion of U.S. dollar denominated securities. That’s the largest holding of U.S. dollars in the world for reserves. As well, Chinese corporations are sitting on billions of U.S. dollar holdings. The Chinese yuan has been strengthening against the U.S. dollar. Today US$1 buys 6.40 yuan but a year ago US$1 bought 7.08 yuan. So, China would be loath to sell U.S securities for yuan as that would strengthen the yuan even further. Something China is reluctant to do.
A chart of the U.S. dollar to Chinese yuan is on the next page. Not surprisingly, it pretty much mirrors the performance of the US$ Index as well.
U.S. Dollar to Chinese Yuan 2016–2021
Source: www.tradingeconomics.com
Source: www.stockcharts.com
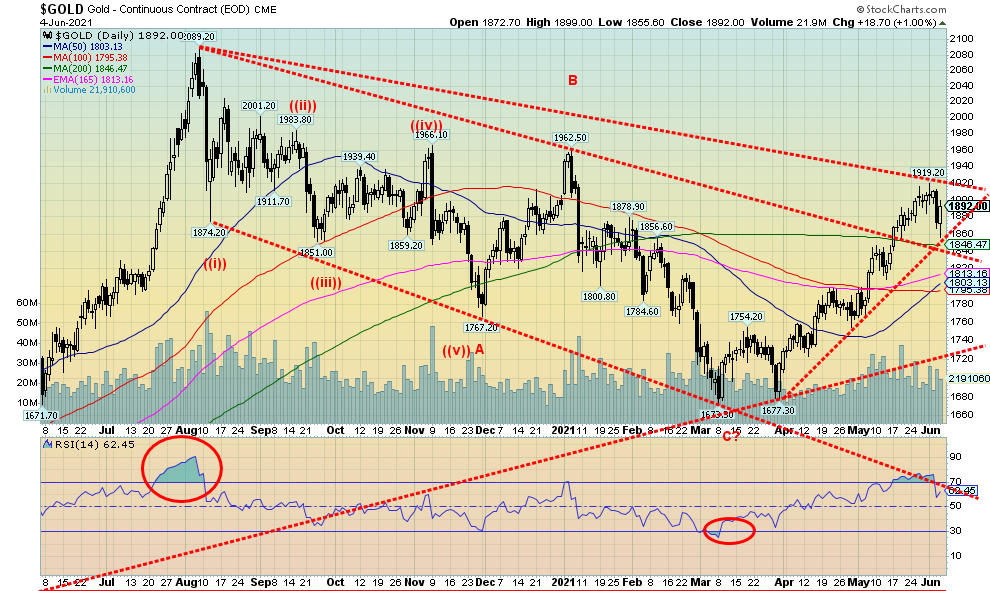
Gold hit a high this past week for the current move at $1,919, then reversed and was hit hard on Thursday before rebounding on Friday following the weaker than expected job numbers. A taper tantrum on Thursday killed the current rally and gold suffered its first weekly setback in the past five weeks. It was the largest weekly decline since March. Gold fell 0.7% this past week, silver was down 0.4%, and platinum dropped 1.5%. Of the near precious metals, palladium was up a modest 0.4% but copper suffered down 3.2%. The gold stocks fell with gold and silver as the Gold Bugs Index (HUI) dropped 1.8% and the TSX Gold Index (TGD) was off 1.5%. The 200-day is currently near $1,846 while the rising 50-day is currently at $1,803.
Gold came down nicely, testing an uptrend line near $1,860 (low on the week was $1,855). This now highlights $1,860 as support and a break under that level would be negative and pull gold down towards more significant support near $1,800. A break under $1,800 would be negative and signal that a more significant correction was underway. On a positive note, we see that the 50-day MA has crossed over the 100-day MA. This type of cross, known variously as a golden cross, suggests that a more significant uptrend could be developing. However, it would be more important if the 50-day crosses above the 200-day MA.
Friday’s rebound as a result of the weaker than expected nonfarm payrolls left a bullish candle on the charts, suggesting that Thursday’s big down day might be temporary. However, follow-through this coming week now becomes important. Once over $1,920, gold would then move to next resistance at $1,950/$1,960. Above $1,960 sets up the potential to rise to $2,000. Over $2,000 and odds increase that new highs above the August 2020 high of $2,089 are likely. So, we can’t underestimate that this coming week might be pivotal. Go up and the rally should continue. Fail and fall, and then the odds increase that we may have topped for this particular move. Gold would then exhibit weakness into at least July before any rally might develop once again.
We note that Basel 3 is now in force and banks are allowed to move gold holdings to Tier 1 assets, allowing physical gold (not paper gold) to be considered 100% value for reserve purposes. Previously, it was only 50%. Paper gold doesn’t count so if banks want to increase their reserves, they might have to convert their paper gold to physical gold or risk becoming undercapitalized. The full implementation of Basel 3 comes into effect on January 1, 2022. Banks have been exiting the paper gold market. Their exit could speed up the demise of the paper gold market, ending an ability for institutions to heavily short gold via the paper market. Gold is up some 13% since the low in March at $1,673. More Basel 3 could help gold prices rise further.
Source: www.cotpricecharts.com
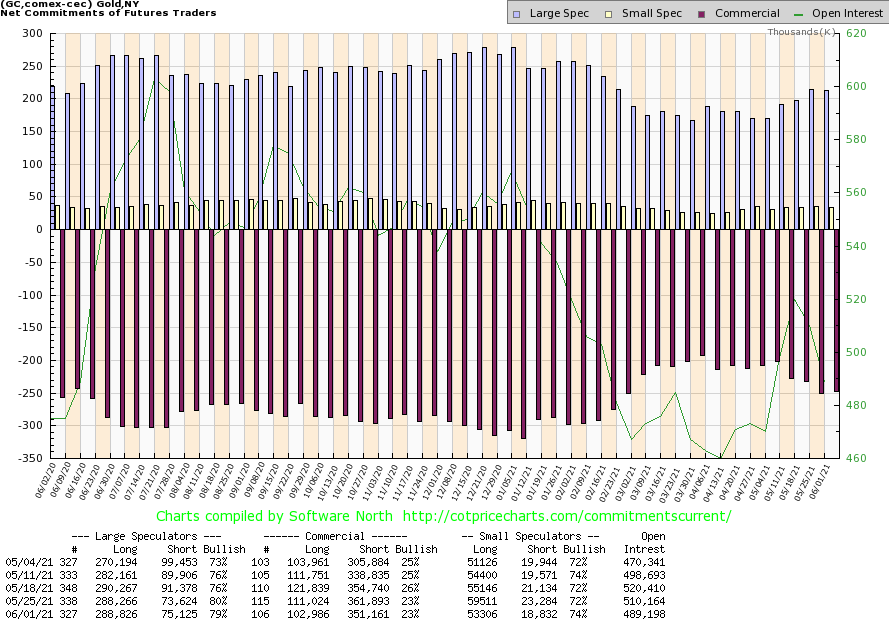
The commercial COT for gold (bullion companies and banks) was unchanged this past week at 23%. As such, the commercial COT remains somewhat bearish. Long open interest fell around 8,000 contracts but short open interest also fell down about 11,000 contracts. Overall open interest fell roughly 21,000 contracts on a week gold was down. That too was somewhat bearish. The large speculators COT (hedge funds, managed futures, etc.) also slipped to 79% from 80% as their short open interest rose almost 2,000 contracts while long open interest was relatively flat. Overall, the gold COT remains somewhat bearish. Right now, just rising to 30% for the commercial COT would be considered bullish.
Source: www.stockcharts.com
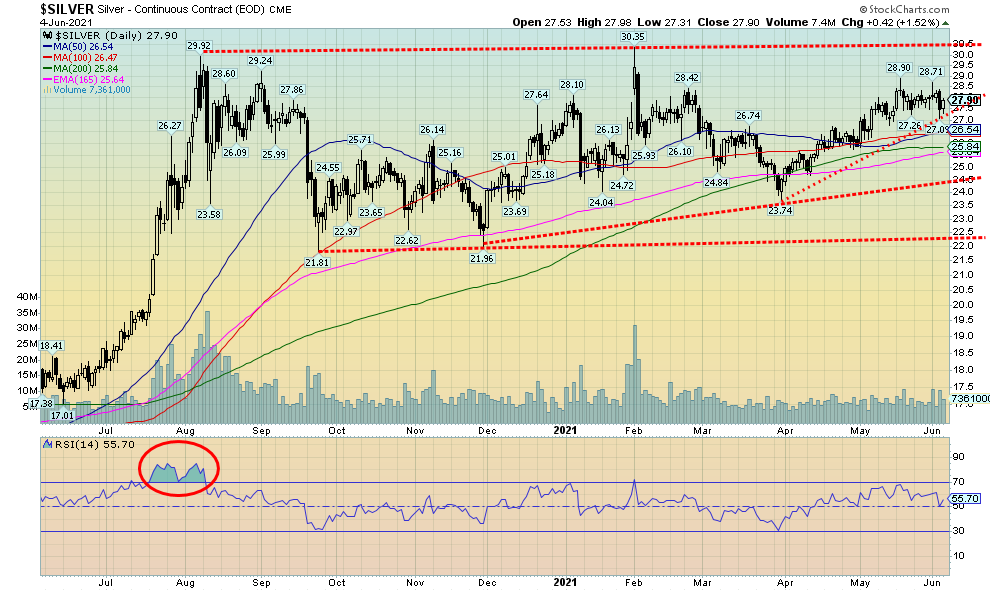
Silver prices waffled this past week as they fell a small 0.4%. The damage was done on Thursday as silver fell 2.6%. Following Friday’s job numbers, silver rebounded, gaining 1.5% to help cushion the fall. Silver continues to make what we believe to be a rising or ascending triangle, given the recent series of higher lows. However, this particular pattern is not perfect by any stretch and we could just as easily see a decline. This week’s decline took us to support near $27. Any breakdown now under $27 would be negative. That would most likely target us down to $26 and even down to $25. Major support is now seen at $24 and under that level we could see the 2020 lows near $22. We have what appears to be a small double top on the charts with the high at $28.90 and a secondary one at $28.71. Again, this emphasizes the major support now forming near $27 as that becomes the neckline of the possible double top. The breakdown under $27 would then target down to between $25 to $25.50. Only new highs above $28.70 and $28.90 could end discussions of a breakdown. Once above $28.90, the odds increase that silver could then take out that early February high of $30.35. Above that, targets could be up to $39/$40. We are at a bit of a crossroads here for silver. Either we move forward this coming week or we fail and break to the downside.
Source: www.cotpricecharts.com
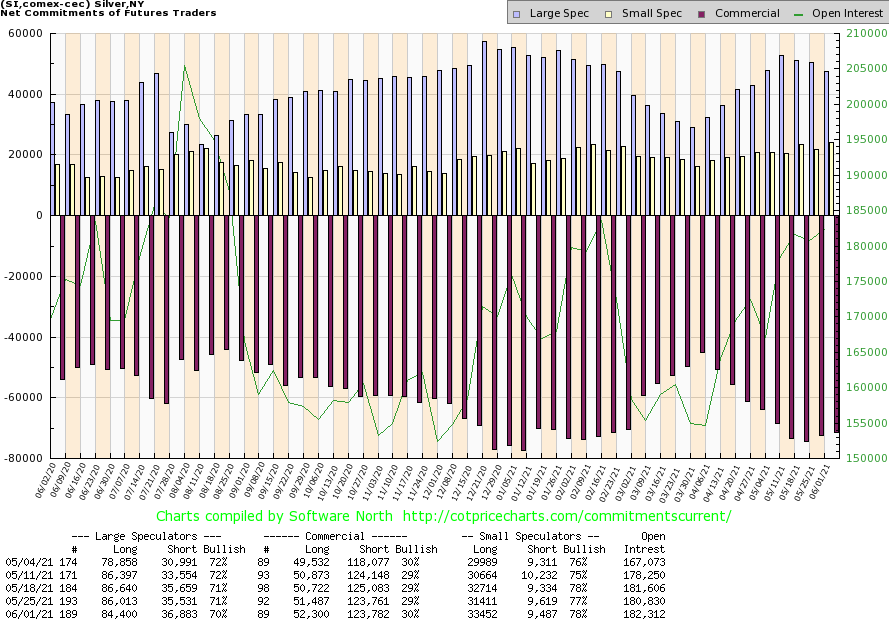
If we want to be optimistic, then we should applaud the fact that the silver commercial COT rose to 30% this past week from 29%. The large speculators COT actually slipped to 70% from 71%. For the commercial COT, long open interest was up roughly 1,000 contracts while short open interest held steady. For the large speculators, their long open interest fell almost 2,000 contracts while short open interest rose over 1,000 contracts. Overall, open interest rose roughly 1,500 contracts on the week. We are with the commercials and applaud the rise in the commercial COT, suggesting that the silver rally should remain intact.
Source: www.stockcharts.com
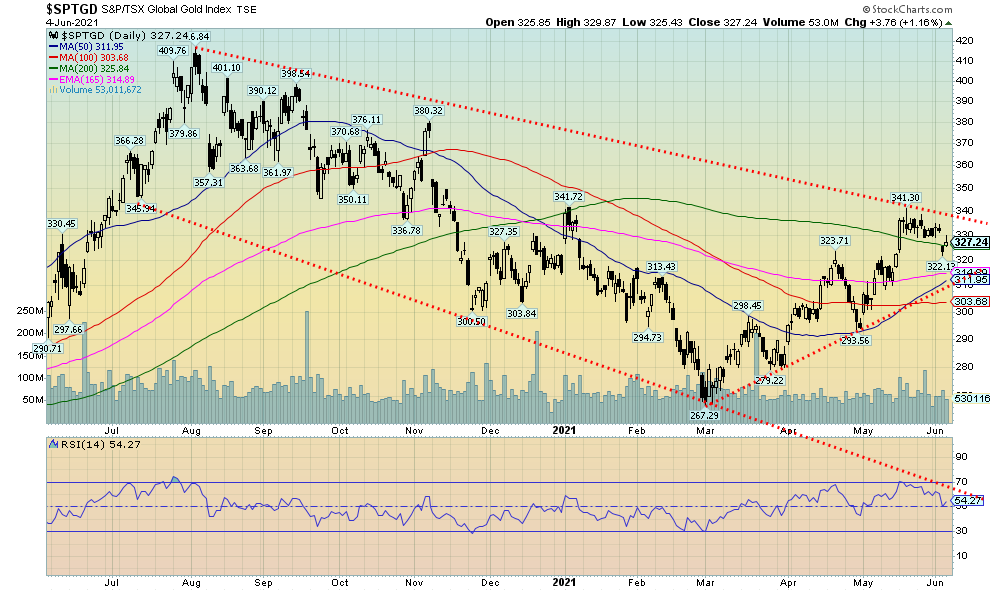
With both gold and silver correcting down this past week the gold stocks did not escape the pullback. The TSX Gold Index (TGD) fell this past week down 1.5% while the Gold Bugs Index (HUI) dropped 1.8%. This is the second consecutive weekly decline. Overall, however, the decline has been small as the TGD is off 4.1% from its recent high. The TGD has good support down to 312, but a break under that level would most likely signal that the rally is over for the time being. On a positive note, we see that the 50-day MA is crossing to the upside over the 100-day MA. That’s a positive sign that suggests to us the rally should continue once we are past this correction. A 4% drop is nothing, considering the TGD already experienced two pullbacks on its way to the recent high. The first drop was 6.4% and the second one was for 9.3%. Sharp pullbacks for the gold stocks in a rally are not unusual because it is such a small market. We could easily test back to our support line near 312 before resuming the up trend. New highs above 341 would confirm the resumption of the rally and could target next up to 360 and 380 resistance.
Source: www.stockcharts.com
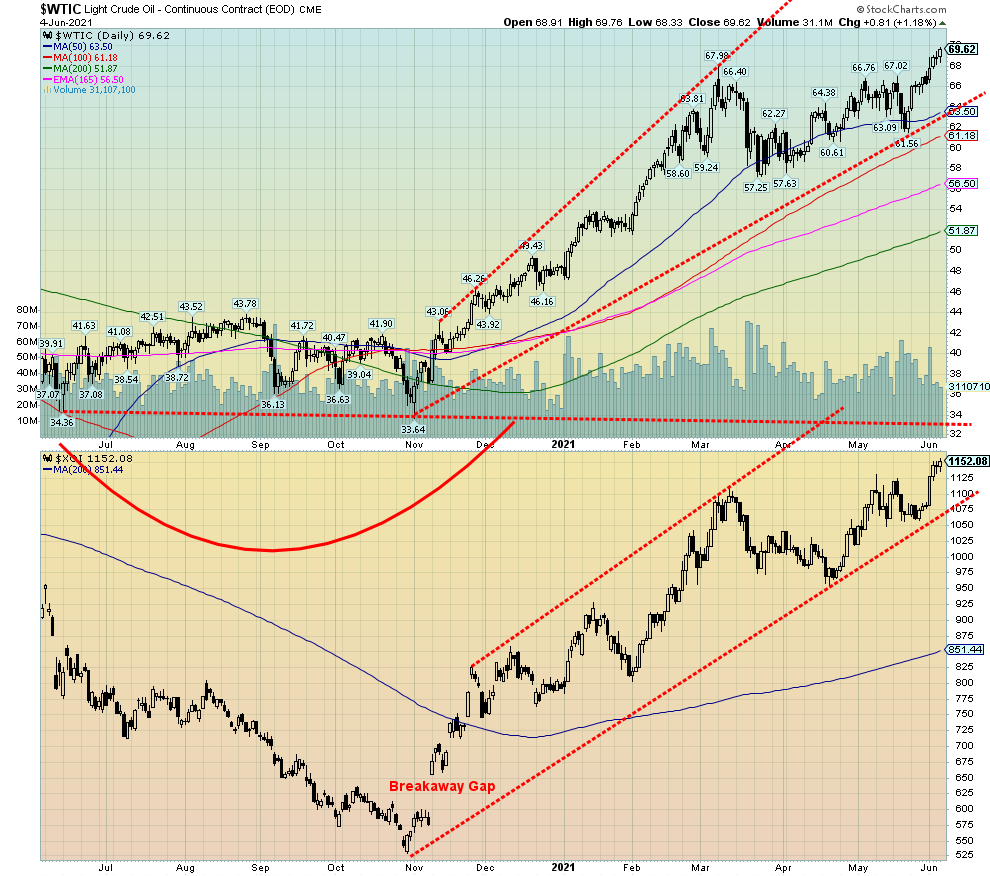
WTI oil broke out this past week to fresh 52-week highs. The catalyst was threefold: OPEC continuing to drain global inventories, the Western world getting vaccinated which could put upward pressure on demand, and no imminent deal between the U.S. and Iran. On the latter, Iran has been surreptitiously selling to China as both work their way around U.S. sanctions.
As a result, any thoughts of a drop in oil prices at this time have been laid to rest. The odds now favour higher prices with the potential to reach into the high $70s and possibly even to $80. A drop that takes us back under $67 would cool that thought and a break under $63 would confirm that a top is most likely in. WTI oil gained almost 5% this past week. Natural gas (NG) was also up, gaining 3.7%. The energy stocks enjoyed the jump in both oil and gas prices as both the ARCO Oil & Gas Index (XOI) and the TSX Energy Index (TEN) soared to new 52-week highs. The XOI was up 6.4% while the TEN jumped 8.9%. All are continuing in their funnel bull channels.
As noted, WTI oil breaks down under $63 and that level is rising sharply. The XOI breaks down under 1,075 while the TEN (not shown) breaks down under 120 and confirms a breakdown under 110. Long-term support for the TEN is down around 70. Daily RSIs are over 70 for the indices and WTI oil. That is a sign of being overbought but does not necessarily signal a top. A top is not determined until they break under key points.
Copyright David Chapman, 2021
|
Charts and commentary by David Chapman Chief Strategist, Enriched Investing Inc. Phone: 416-523-5454 Email: david@davidchapman.com dchapman@enrichedinvesting.com Twitter: @Davcha12 June 7, 2021 |
|
GLOSSARY Trends Daily – Short-term trend (For swing traders) Weekly – Intermediate-term trend (For long-term trend followers) Monthly – Long-term secular trend (For long-term trend followers) Up – The trend is up. Down – The trend is down Neutral – Indicators are mostly neutral. A trend change might be in the offing. Weak – The trend is still up or down but it is weakening. It is also a sign that the trend might change. Topping – Indicators are suggesting that while the trend remains up there are considerable signs that suggest that the market is topping. Bottoming – Indicators are suggesting that while the trend is down there are considerable signs that suggest that the market is bottoming.
|
David Chapman is not a registered advisory service and is not an exempt market dealer (EMD) nor a licensed financial advisor. We do not and cannot give individualised market advice. David Chapman has worked in the financial industry for over 40 years including large financial corporations, banks, and investment dealers. The information in this newsletter is intended only for informational and educational purposes. It should not be considered a solicitation of an offer or sale of any security. Every effort is made to provide accurate and complete information. However, we cannot guarantee that there will be no errors. We make no claims, promises or guarantees about the accuracy, completeness, or adequacy of the contents of this commentary and expressly disclaim liability for errors and omissions in the contents of this commentary. David Chapman will always use his best efforts to ensure the accuracy and timeliness of all information. The reader assumes all risk when trading in securities and David Chapman advises consulting a licensed professional financial advisor before proceeding with any trade or idea presented in this newsletter. David Chapman may own shares in companies mentioned in this newsletter. We share our ideas and opinions for informational and educational purposes only and expect the reader to perform due diligence before considering a position in any security. That includes consulting with your own licensed professional financial advisor.
About the author


Website: https://www.enrichedinvesting.com
Disclaimer: David Chapman is not a registered advisory service and is not an exempt market dealer (EMD) nor a licensed financial advisor. We do not and cannot give individualised market advice. David Chapman has worked in the financial industry for over 40 years including large financial corporations, banks, and investment dealers. The information in this newsletter is intended only for informational and educational purposes. It should not be considered a solicitation of an offer or sale of any security. The reader assumes all risk when trading in securities and David Chapman advises consulting a licensed professional financial advisor before proceeding with any trade or idea presented in this newsletter. David Chapman may own shares in companies mentioned in this newsletter. We share our ideas and opinions for informational and educational purposes only and expect the reader to perform due diligence before considering a position in any security. That includes consulting with your own licensed professional financial advisor.