
It had to happen – the PM sector was so incredibly overbought that a heavy correction was inevitable. We saw this coming which was why a warning to lighten up on silver stocks was issued on Tuesday. Even so, the drop this morning is of stunning magnitude, with gold down a collosal $367 at the time of writing and silver down a massive $18.
The market gave subtle signals all week that such a drop was looming as we will now proceed to see on the charts.
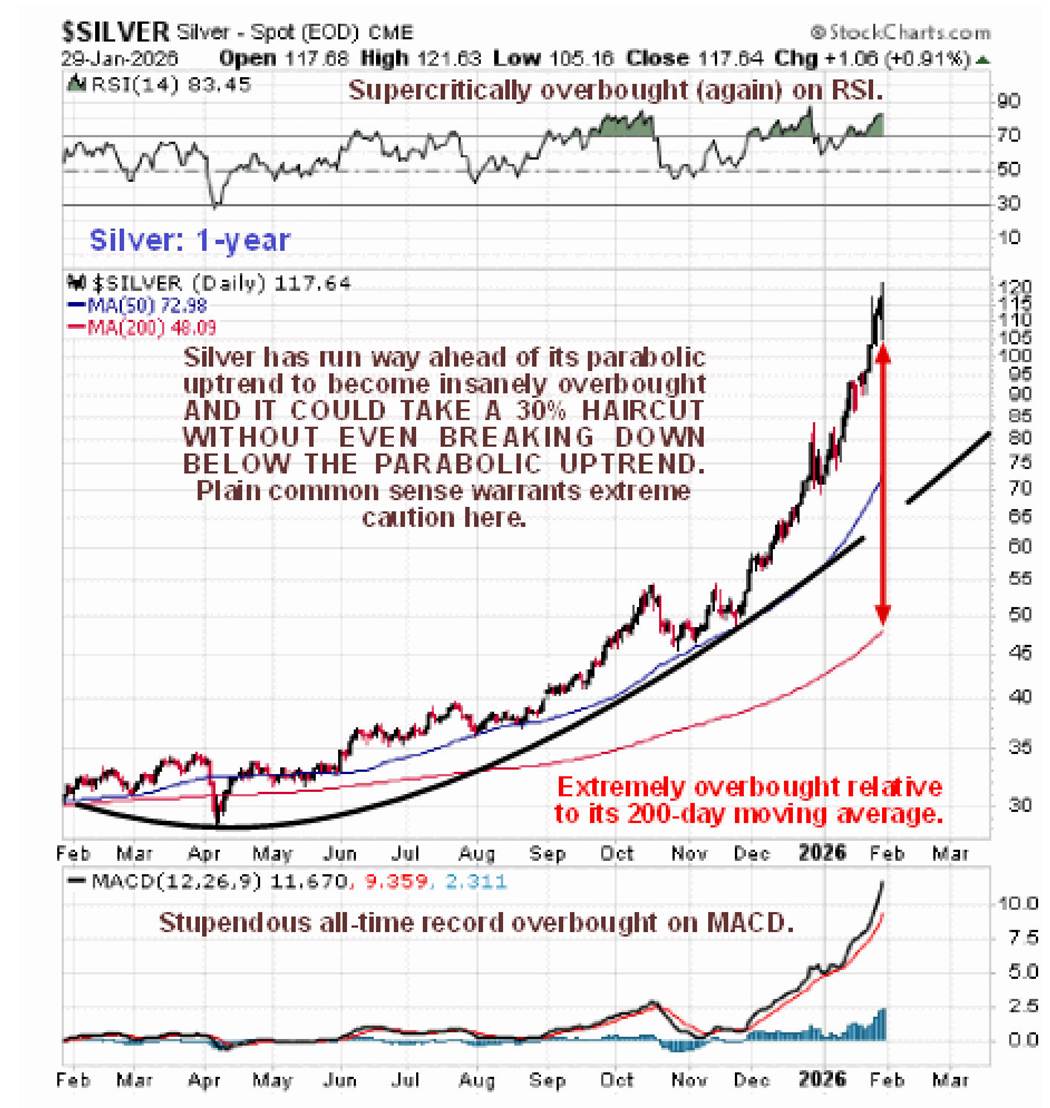
On silver’s 1-year chart we can see that it had run way ahead of its parabolic uptrend to becoming insanely overbought. This is a very useful chart for it enables us to see that it could take about a 30% haircut without breaching its parabolic uptrend. This chart also gives us a target for the correction which is the parabolic uptrend itself, currently at about $65 and rising with the severity of the drop this morning indiicating a higher probability that it will get there, albeit that by the time it does it will be at a higher level, perhaps at about $70 - $75.
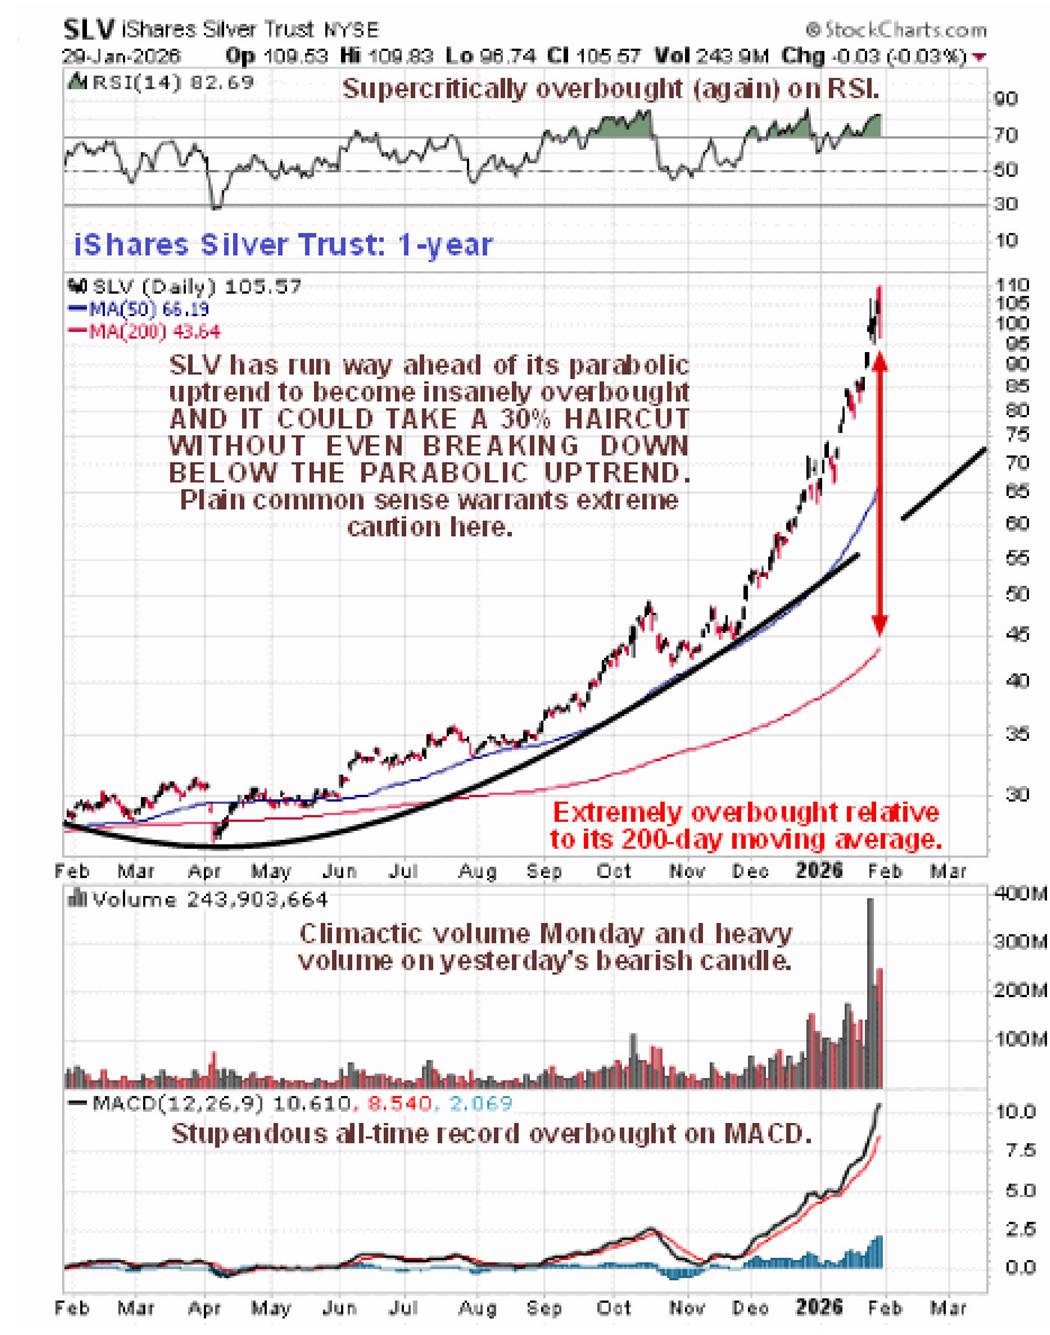
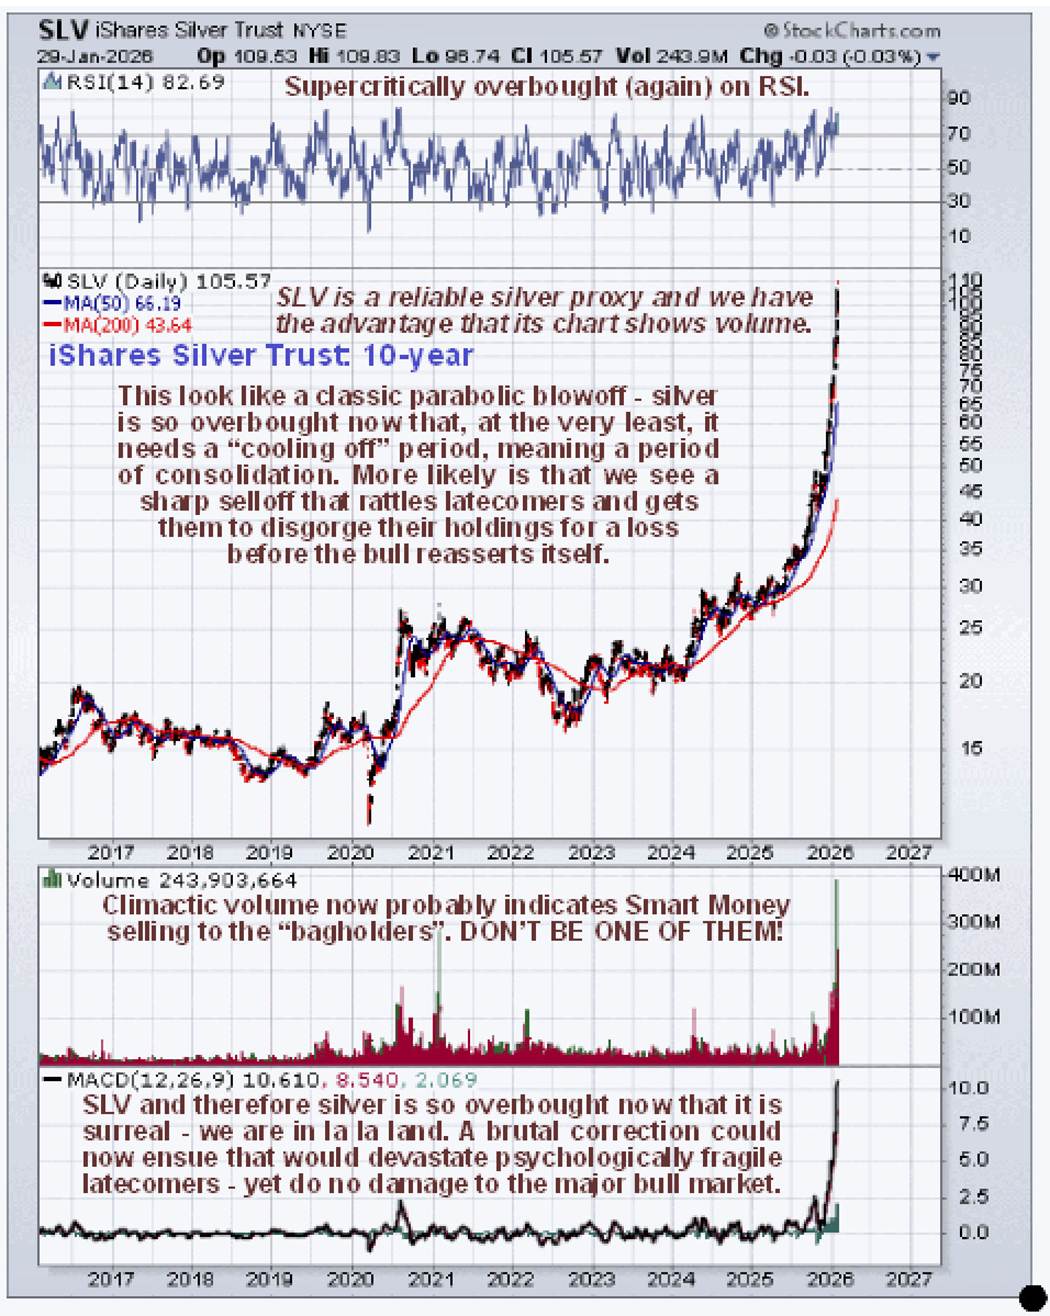
The chart for silver proxy SLV, also for 1-year, is useful as it shows volume and thus enables us to see the climactic top volume last Monday which was a reason for the warning being issued on Tuesday. …
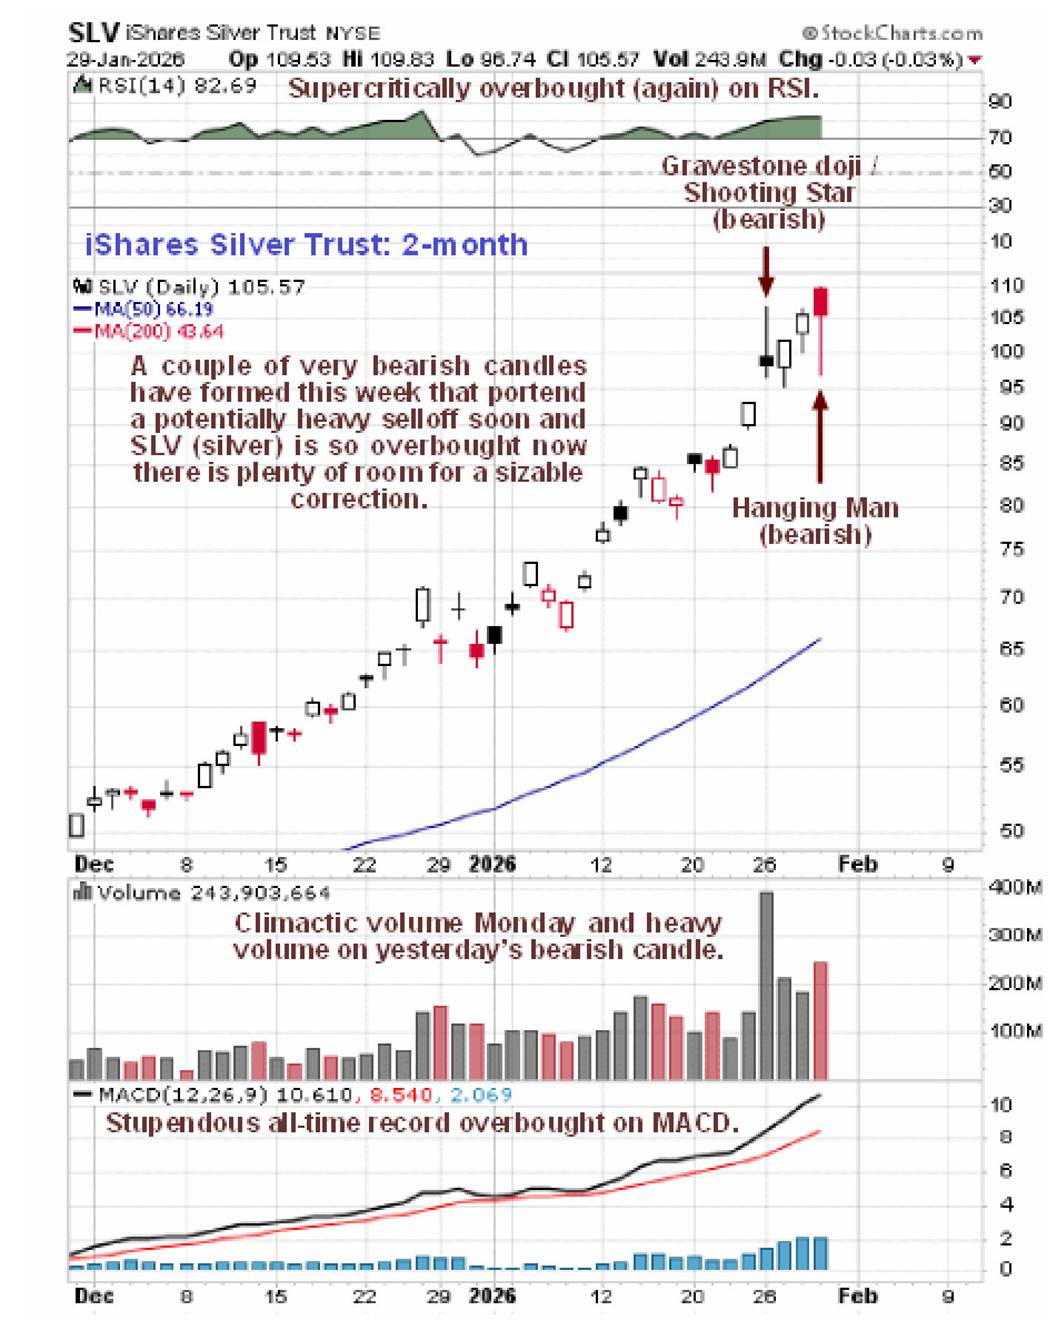
We’ll now look at the action this week in detail on a 2-month chart for SLV because it enables us to see the subtle warnngs that the market was flashing that it was in the process of topping out. The most important warning it gave was the prominent very bearish “Gravestone Doji / Shooting Star” candle that formed on high volume on Monday where the open and close price are close together near to the day’s low with a quite large daily range. This shows that the bulls have “dropped the ball” and bears are taking control. It then very deceptively made a new intraday high yesterday before ending with a very bearish “hanging man” candle – another severe warning.
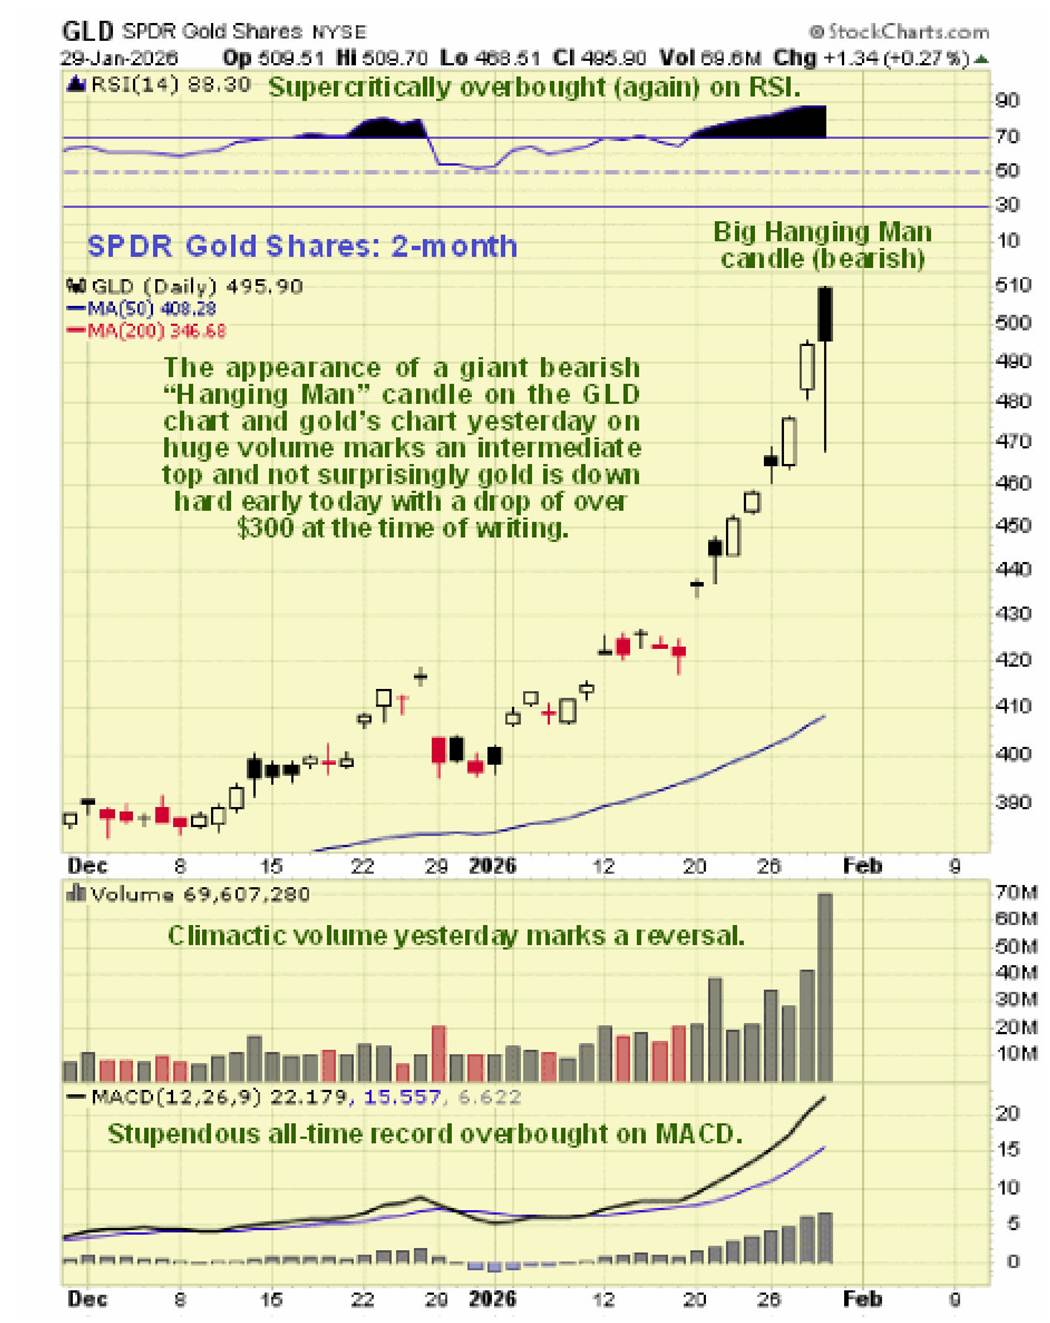
Meanwhile, gold proxy GLD put in a gigantic wide range “Hanging Man” candle yesterday on huge volume as we can see on its 2-month chart below, thus confirming the solidifying bearish picture emerging in silver. Hence the crushing drop in gold this morning after its near vertical runup this month.
Lastly, in looking at the 10-year chart for SLV we must ask ourselves just how much more overbought we could expect it (and therefore silver) to get? – it was so overbought it was surreal. Small wonder then that a brutal correction has started. Bear in mind that these charts were made last night and so the commentary on this chart is already a little out of date given what has happened overnight.
After the severity of this morning’s drop we are likely to see some sort of bounce which may be used to lighten positions as this correction probably has some way to run - as mentioned above a likely target for silver and SLV is the parabola boundaries on their respective 1-year charts. Silver, which astrologically is ruled by the moon, often makes intermediate trend changes around new and full moons and we have a full moon this Sunday. This is not hokus-pokus, it is a matter of statistical fact, and a similar correlation exists between cocoa prices and the cycles of Venus.
End of update.
About the author
