
I’m sure it’s no surprise to anyone that the Magnificent 7, which led the huge rally in recent months to record highs, would be the stocks that take the rally down. Techs led the slide today, plunging the Dow more than 500 points intraday to finally close down 405 points with the Nasdaq down 267.
It’s a simple rule of math: The bigger they are, the harder they fall. That is always the peril of a market supported by only a few gargantuan leaders when the rest of the stocks are largely flat or falling. Tesla’s been sliding all year. So has Apple. Microsoft and Alphabet have been struggling over the past month, but Amazon and Nvidia carried them all. Today, Apple plunged over troubles in China and pulled all the other leaders down with it, except Nvidia. If the few high-performing stocks fall, the indices crash due to there being no other internal supports, and huge leaders can create such an undertow that they suck all other stocks down even lower with them. No one wants to be swimming near the Titanic when the great beast finally slips beneath the water’s surface.
What may have been a surprise is how the fall of stocks in the last couple of days as the momentum rally in AI sputtered would pour so much money into safe havens, driving gold to new record heights two days in a row now and taking bond yields down (prices up). It also helped Bitcoin catch a huge bid. All combined, that does have the feel of a big flight to safety that could presage worse for stocks.
That said, many investors were expecting a correction in stocks after such a long rally, so there is nothing necessarily perilous about yesterday’s trembling little dip and today’s plunge. However, with tops looking strikingly like the big top before the dot-com plunge, the situation looks potentially frightening.
In the following video, Adam Taggart’s guest, Gordon Long, presents a graph (at about the 8-minute mark) that shows how precariously close the present market looks to two serious periods of decadal stock declines in the past:
That graph look like this:
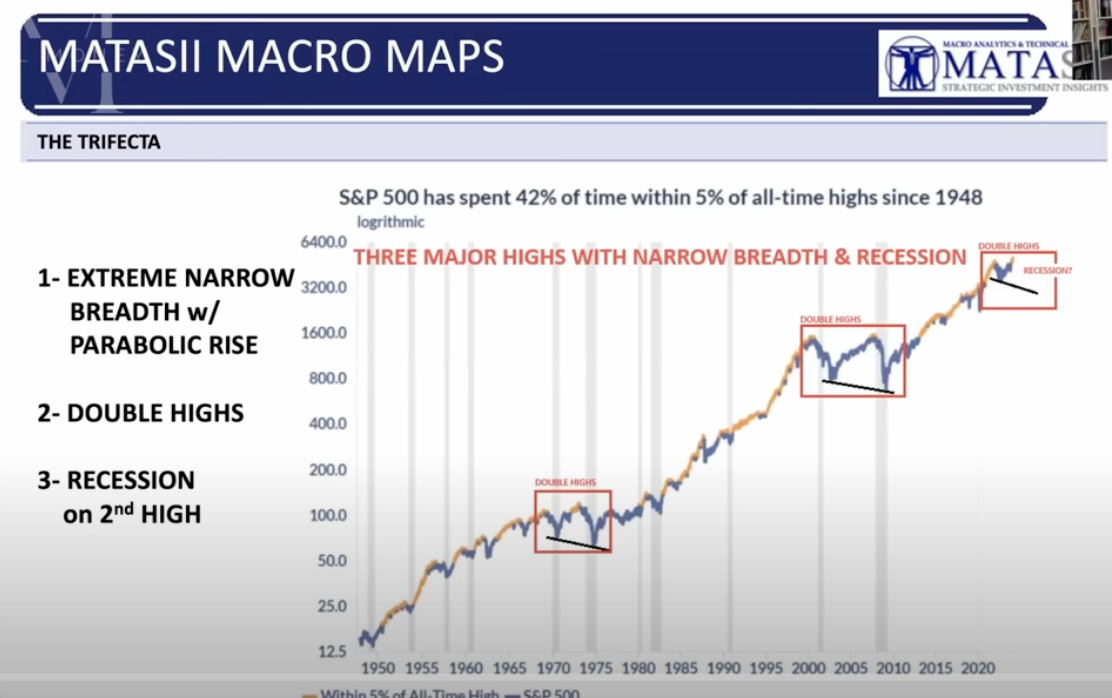
Long’s explanation is interesting and more detailed than I’ll give here, but the first two boxes show multi-decade failures with two major tops that had narrow market breadth like the present and huge recessions. If the pattern were to hold, we are right now at the cusp of the second major break that would likely come in this cycle. (The chart is logarithmic, so the scale for the present setup looks very small, but it indicates a fall in the S&P to around 3200.)
Who knows if history is prologue, but the first rise and crash in Long’s third box was the rise into a crash that happened in 2022, which I have always believed was the first of two that we’d see with the second being larger for the simple reason that I never believed the crash we saw in 2022 was large enough to get all the exuberant speculation back out of the market. (I did not, however, expect the market to make a new high before taking the second long plunge, though I did expect an enormous bear-market rally.) Long says that a level around 3200 would be the first resting point in the upcoming bust, but that he’d expect a second plunge to come along after a bear rally—as happened in the dot-com bust—that would take us to an even lower point.
I personally believe it will take a big event to rip the momentum out of this market, such as a much bigger spike in inflation than we’ve seen that makes it clear to everyone that the Fed has a lot of work ahead of it still or another banking bust like we saw last spring. It’s bound to take a jolt, but once the momentum turns down, a lot will get pulled down with the sinking ship. That, of course, could happen this month as CRE troubles keep building and bank safety programs and reserve cash set-asides (reverse repo loans with the Fed) run out in March.
About the author


David Haggith is the publisher/editor-in-chief of The Daily Doom.
Economic, Social and Political News of Our Troubled Times -- a non-partisan daily collection of the most consequential stories about our complex times from multiple sources around the world plus daily editorials like the one you read here.
Liked it? Take a second to support David Haggith by subscribing on Substack!