WILL BULLISH TECHNICAL and MOMENTUM CONTINUE TILL FOMC?
FOMO or Fear of Missing Out has started in gold, silver, and copper. More and more retail traders are now investing or will buy on dips. Risk appetite has risen. US dollar Index is on the verge of a technical breakdown. All in all, a very good chance for a big rally in gold, silver, and copper.
Base metals rally is purely a speculative play. Silver if it rises this week will test $26.00. Gold will break $1900 if it trades over $1810.
I believe that the US dollar Index has formed a long term top this year. Bond yields have formed a long term top this year. My only risk to my view is another sustained rise in the US dollar index.
Profit taking or a sharp price correction between 9th December to 15th December (between PPI, CPI, and the next trading day after FOMC). If gold and silver continue to rise after FOMC, then the year will end over $2000 and $27.00. All the moment, all price fall (if any) up to 1690 and $20.20 should be used to invest for the short term.
Asian currencies like Usd/inr, usd/idr, usd/php etc will all gain against the US dollar.
|
CME FUTURES |
CLOSING PRICE ON 2/12/22 |
DAILY MOVING AVERAGES |
|||||
|
50 |
100 |
200 |
300 |
400 |
600 |
||
|
GOLD |
$1,809.60 |
$1,701.64 |
$1,721.17 |
$1,801.34 |
$1,802.30 |
$1,805.32 |
$1,822.34 |
|
SILVER |
$2,325.00 |
$2,020.33 |
$1,971.95 |
$2,139.18 |
$2,201.65 |
$2,290.53 |
$2,380.25 |
|
COPPER |
$385.05 |
$354.04 |
$352.84 |
$393.48 |
$409.09 |
$416.42 |
$394.04 |
|
CRUDE OIL |
$79.98 |
$84.78 |
$87.87 |
$97.34 |
$91.57 |
$86.09 |
$73.83 |
# gold, copper and silver will break past six hundred day moving average if they rise this week.
## crude oil is bullish as long as it trades over six hundred day moving average.
### Gold and Silver traders have to keep a close watch at four hundred day moving average as well.
COMEX GOLD FEBRUARY 2023 (current market price : $1821.20)
- 100 week moving average: $1802.90
- Technical resistances are: $1824.60, $1842.80 and $1850.30.
- Trend, momentum, and technical are all bullish for gold. BUT it needs to break and trade over $1824.60-$1850.30 zone to rise to $1910.70 and $1960.90.
- Crash or sell off will be there if gold does not break each of the key resistance between $1824.60-$1850.30.
- RIGHT NOW GOLD IS BULLISH AS LONG as it trades over $1769.20 with $1890.40 and more as price target.
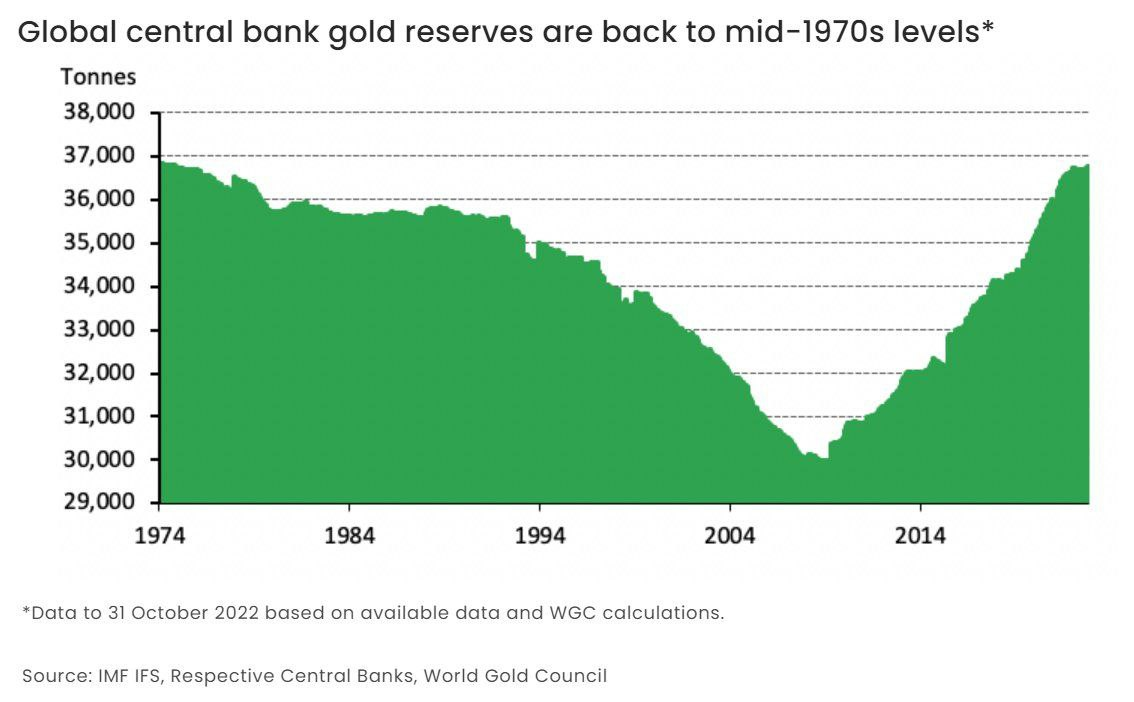
Central banks are not donkey if they are constantly increasing their gold reserves. Till 2007, European central banks were selling gold through CBGA (central bank gold sale agreement). Now almost every central bank is buying gold. It is reverse of CBGA. As long as central banks continue to increase gold reserves, all major price fall should be used to invest. I will also suggest to increase portfolio allocation to gold.
TRADERS, if gold, silver, and copper rise without any correction till FOMC, then go short with a trailing stop loss over December highs.
Recession or less recession or mild slowdown will be market moving factor till end January. Over hype and over pessimism will switch on or switch off very frequently. Long term bullish trend will not change. Weekly trend and fortnightly trend will be affected by extreme attitude of retail traders.
About the author