In real (inflation-adjusted) dollars, both gold and silver peaked in 1980. We'll look at charts for the two metals and discuss their applicability to current price expectations. Silver first...
SILVER
The first chart (source) for silver is a history for the past century based on average monthly closing prices...
Silver Prices - 100 Year Historical Chart
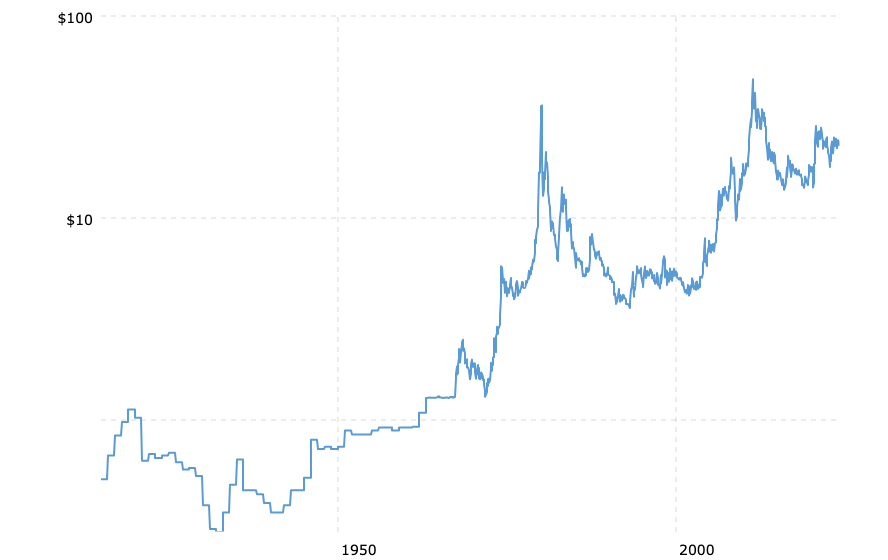
The ascending trend line dating back to the mid-1930s might seem appealing; especially for a patient long-term investor. But, as we know when looking at longer-term charts, or making projections for any number of things, such as investments (stocks, real estate, etc.), sales, cost of doing business, retirement planning, etc., we need to account for the effects of inflation. In this case, we are specifically interested in the effects of inflation on the silver price over the past century. In other words, how much of silver's price increase from $.28 in 1932 to $23.00 currently is represented by "real" profits and how much of that increase is simply due to "the effects of inflation."
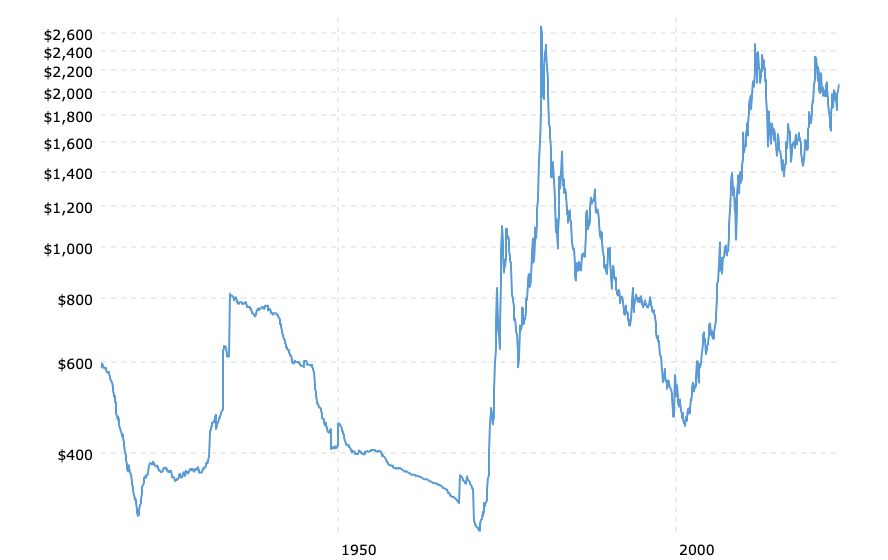
Below is a second chart. The price history is the same as that in the first chart except that the prices have been adjusted for the effects of inflation...
Silver Prices (inflation-adjusted) - 100 Year Historical Chart
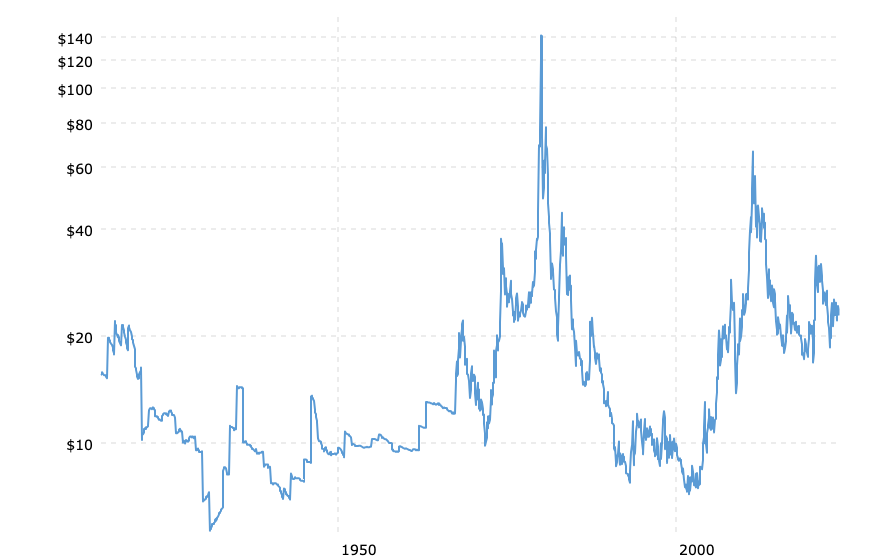
The ascending trend line from the first chart is nearly non-existent and the volatility is more extreme. In support of what we said earlier, it is clear that the price of silver peaked in 1980; and, each succeeding peak is consequentially lower than the preceding one.
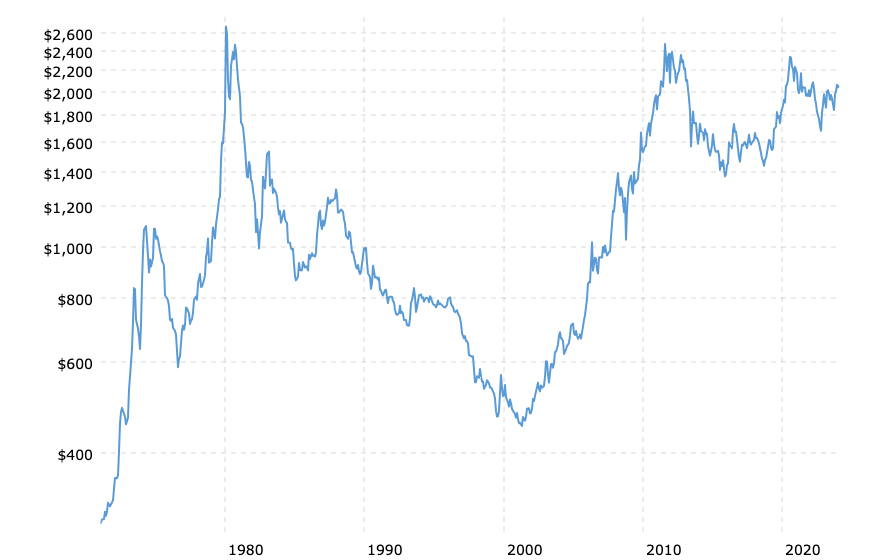
Here is one more chart for silver which should help clarify how poorly the silver price has performed historically...
Silver Prices (inflation-adjusted) 1971-2024
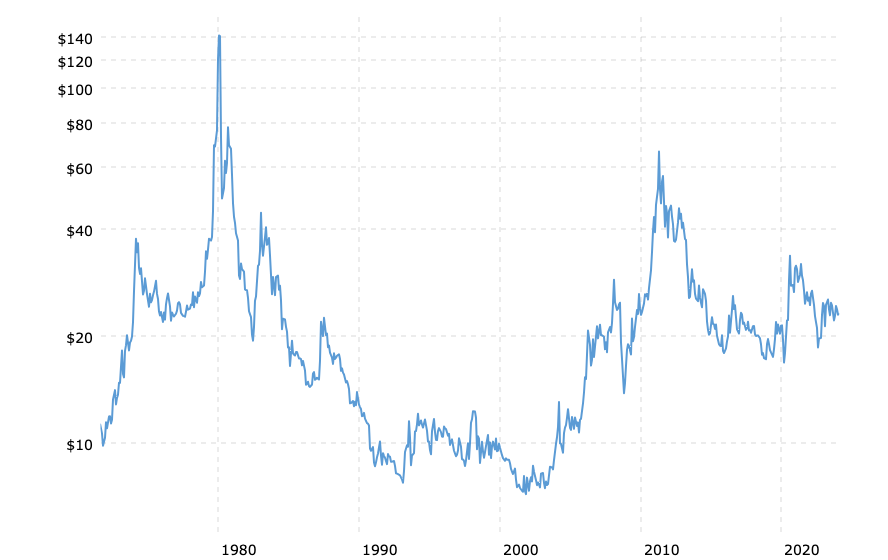
In October 1971, the price of silver was $1.31. From there it rose to a high of $5.78 in February 1974. In today's inflation-adjusted dollars, the February 1974 price of $5.78 is now $37.59. That means that the current silver price of close to $23.00 oz. is cheaper by thirty-nine percent than in it was in February 1974. Another way to say it is that the current silver price of $23.00 is the equivalent of $3.52 in constant dollars basis 1974. Keep in mind that this was eight years before the all-time price peak for silver in 1980.
In January 1980, the average monthly closing price for silver was $36.00 oz. It is pretty easy to see that today's silver price of $23.00 is considerably lower than its January 1980 peak of $36.00. Imagine that you bought a stock at 36 and it dropped to 23; you would have a loss of thirty-six percent. You wouldn't be happy, especially in light of the fact that you had held that stock for forty-four years. The long holding period makes the loss much worse because in constant dollars, the real loss is eighty-three percent (down from the inflation-adjusted high of $140 oz. in January 1980).
GOLD
As with silver, our first chart (source) for gold is a century-long price history...
Gold Prices - 100 Year Historical Chart
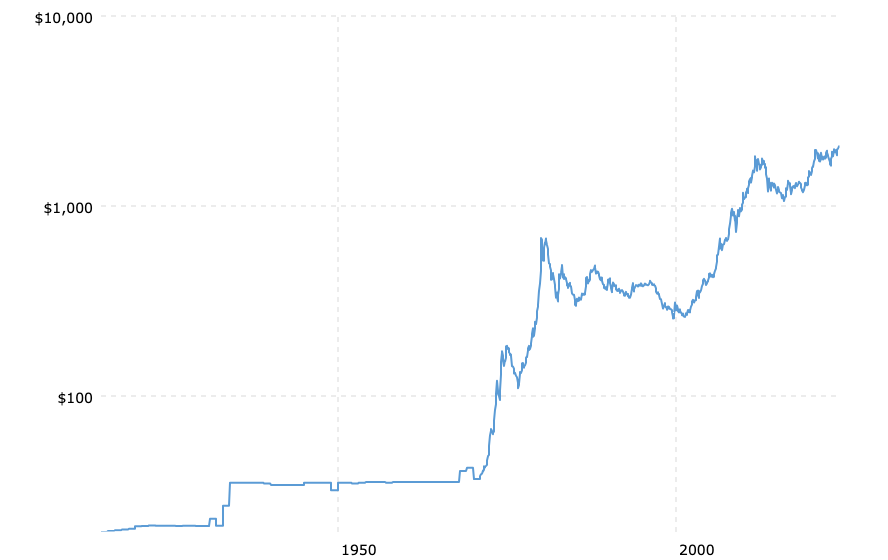
As can be seen, there is a similar ascending uptrend for gold, as was the case for silver. Gold, however, has gone on to mark new, higher prices since its previous peaks, which was not the case with silver. We, know, however, that this can change when the effects of inflation are factored in.
The second gold chart follows...
Gold Prices (inflation-adjusted) - 100 Year Historical Chart
As with silver, the effects of inflation give us additional information that helps us see more clearly what has happened to the gold price over the past one hundred years. The successive price peaks in gold, rather than declining in dramatic fashion as we saw with silver, return to the previous point, albeit not quite as high.
The price comparisons for gold are much better than what we found with silver, as well. Gold's recent high of $2060 oz., while still more than twenty percent lower than its 1980 inflation-adjusted peak of $2670 ($677), is far and away better than silver which currently is eighty-three percent lower than its 1980 price peak.
Gold better price performance is amplified on the chart below...
Gold Prices (inflation-adjusted) 1971-2024
COMMENTS
Silver: The hype associated with silver price projections and predictions is unjustified. Using previous price history to support those predictions without allowing for the effects of inflation presents a distorted picture and leads to unrealistic expectations. Silver is an industrial metal. Its role as money is secondary to its use in industry. That has always been the case and will remain so.
The argument about silver being a hedge against inflation is a joke. What protection against inflation has silver provided when it is cheaper by eighty-three percent than in was four decades ago?
There is a perfectly justifiable reason to own silver coins as "emergency" money against the threat of financial system collapse. However, expecting to get rich by investing in silver is a pipe dream. You might do very well in the short term if you are a trader and your timing is impeccable. But those occasions are infrequent and short-lived.
Gold: As far as gold is concerned, it is real money and a long-term store of value. Its primary value is in its use as money. It is THE standard by which all other monies are measured and compared. Nevertheless, expectations for huge increases in its price are unrealistic.
The only reason the price of gold increases over time is to reflect the effects of inflation that have already occurred. The "effects of inflation" show up as a loss of purchasing power in the U.S. dollar. This is true no matter which currency gold is priced in. (buy/sell gold priced in pounds at Auronum)
Over the past century, the U.S. dollar has lost ninety-nine percent of its purchasing power. The cost for the goods and services we buy and use has increased one-hundred fold. So, too, has the gold price increased by that same multiple ($20.67 x 100 = $2067). As long as the dollar continues to lose purchasing power, the price of gold will continue to move higher over time. Historically, that can come after long delays; and only in hindsight.
Since gold is fully-priced currently with respect to the dollar's loss of purchasing power, it can only move significantly higher after further loss of U.S. dollar purchasing power.
Over the decades and centuries, the purchasing power of gold remains stable. Its higher price reflects deterioration in an inferior form of money, i.e., fiat currency. Owning gold is for capital preservation. Expectations for a much higher gold price resulting from geopolitical issues, social unrest, wars, changes in interest rates, a weak economy, etc., are unrealistic and unsupported historically.
Those who expect to make 'a ton of money when gold goes to the moon' may be right, but the money would be worthless by that time. Under conditions like those, gold will retain its value/purchasing power.
Expectations for a much higher gold price resulting from geopolitical issues, social unrest, wars, changes in interest rates, a weak economy, etc., are unrealistic and unsupported fundamentally and historically.
CONCLUSION
There are good reasons to own both gold and silver. Both are better alternatives than the U.S. dollar; however, neither should be viewed as investment alternatives. Owing some silver coins has merit, but gold is the preferred choice for sound money and capital preservation, especially over long periods of time. (Also see Viewing Gold In Its Proper Context)
About the author

Analyst, Author, and Owner of Kelsey's Gold Facts
Kelsey Williams has more than forty years experience in the financial services industry, including fourteen years as a full-service financial planner. His website, Kelsey's Gold Facts, contains self-authored articles written for the purpose of educating and informing others about gold within a historical context. In addition to gold, he writes about inflation and the Federal Reserve.
Kelsey is the author of two books: INFLATION, WHAT IT IS, WHAT IT ISN'T, AND WHO'S RESPONSIBLE FOR IT and ALL HAIL THE FED!
Kelsey Williams is available for private consultations, public speaking, and interviews at kwilliams@kelseywilliamsgold.com