
- The Chinese Spring Festival (Chinese New Year) holiday is underway, and it’s typically associated with softness in the fiat price of gold.
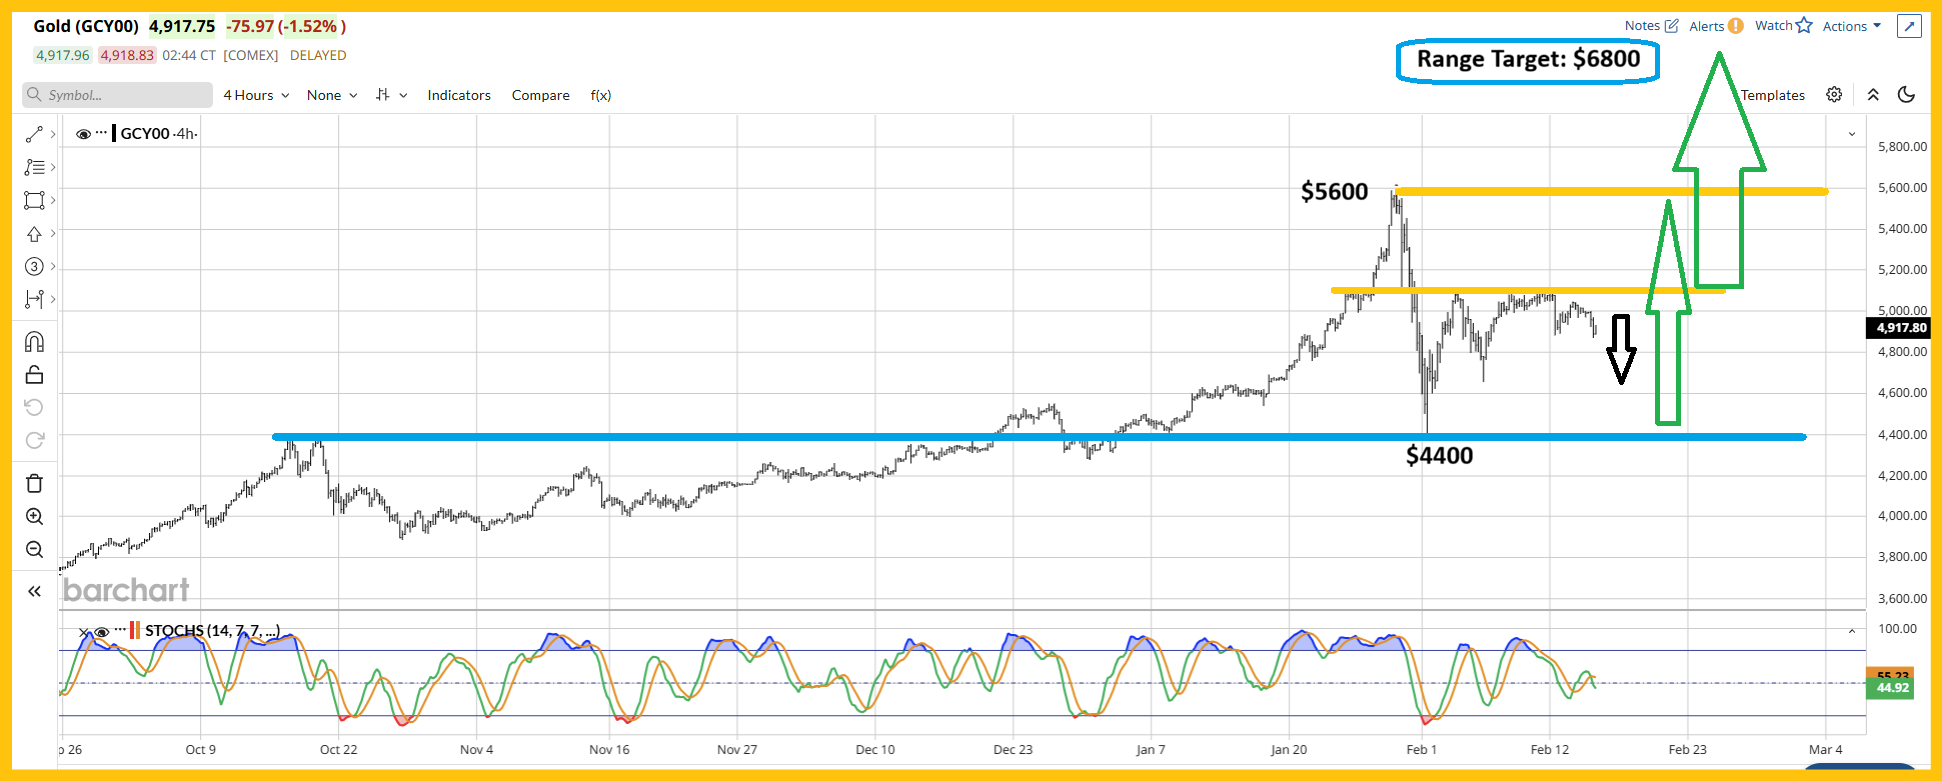
- Please click here now. Click to enlarge. A range trade between $4400 and $5600 is forming, and the longer that gold trades in this range…
- The more likely an upside breakout and rally to $6800 becomes.
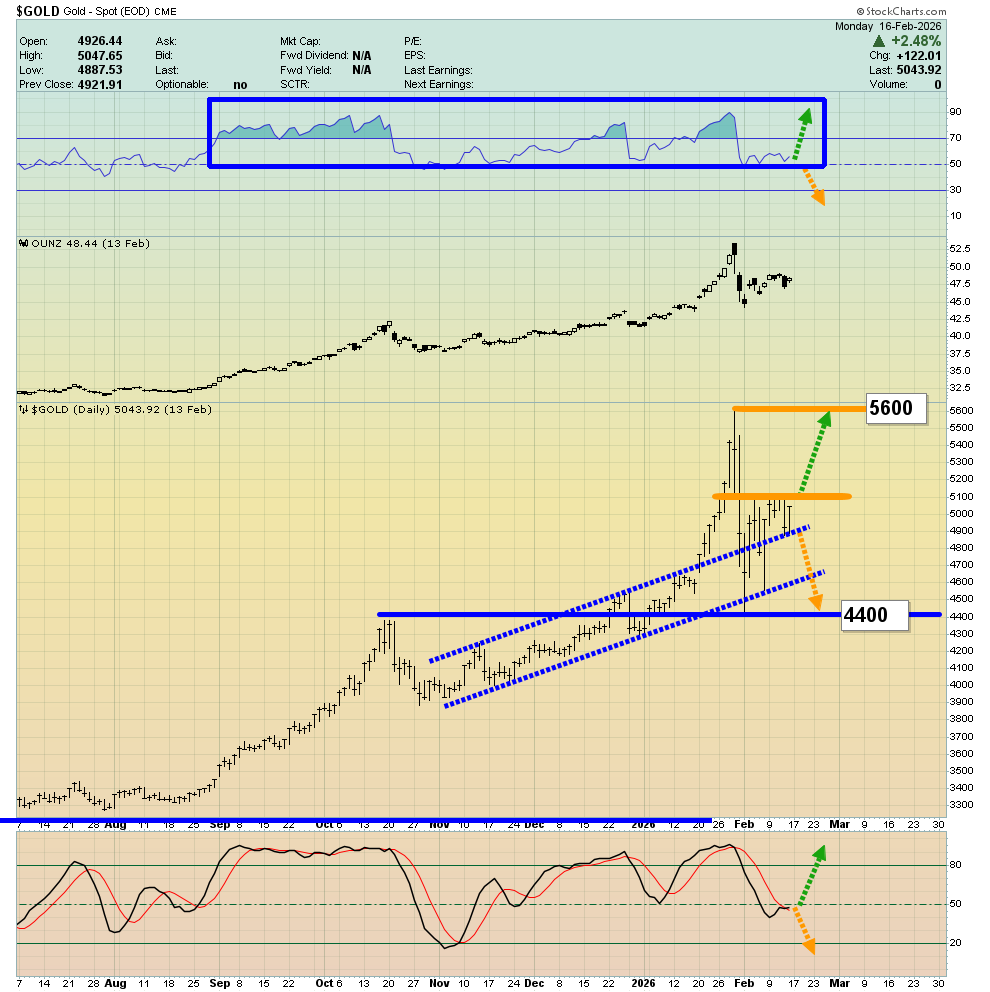
- For another look at the price action, please click here now. Click to enlarge. Note the channel marked with dotted blue trendlines.
- Gold has burst above that channel and appears to be consolidating the breakout now.
- The general price softness in the metals markets is likely to persist until the Chinese holiday ends, and it’s a great time for excited Western gold bugs to add to their gold, silver, and mining stock positions.
- Please click here now. I’ve described an emerging “gold bull era” that is focused on the economic rise of China and India... a rise so big that it will eclipse the currently-dominant fear trade of the West.
- This era will also feature hundreds of millions of robots doing the work that over-taxed and inflation-decimated humans (in both the West and the East) are struggling to do now.
- Thanks to the robots, universal basic income will become universal big income, and the gold-oriented citizens of Asia will buy much more gold than they’re already eagerly buying now.
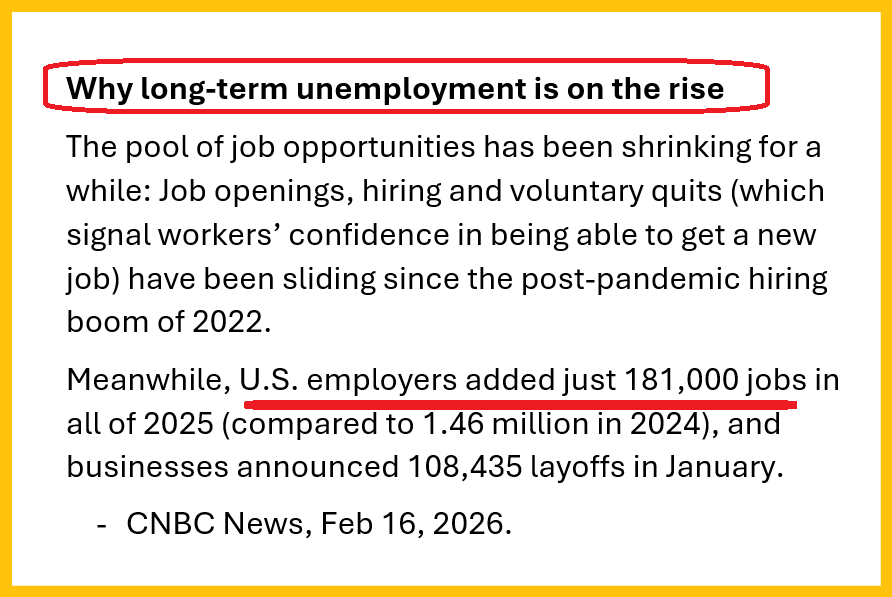
- Please click here now. In the West, the situation is dicey. Job growth in 2025 was negligible. The latest ADP report showed only about 22,000 jobs were added in January.
- In contrast, the government report (the Orwell report?) showed a gain of 130,000. Either that report has more errors than Swiss cheese has holes, or the government hired about 110,000 pencil pushers that can’t be paid with anything except more outrageous debt. The bottom fear trade line:
- Unless the US government starts counting robots in its employment reports, this situation will go from bad to worse… and then to horrific. Got gold?
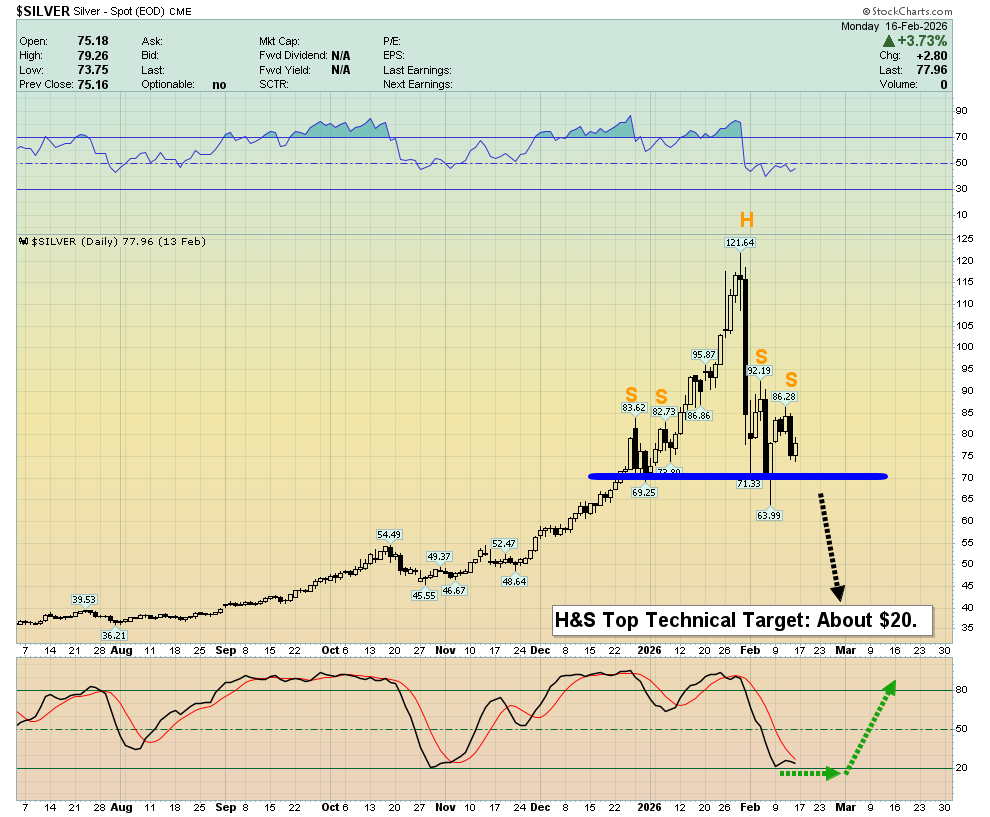
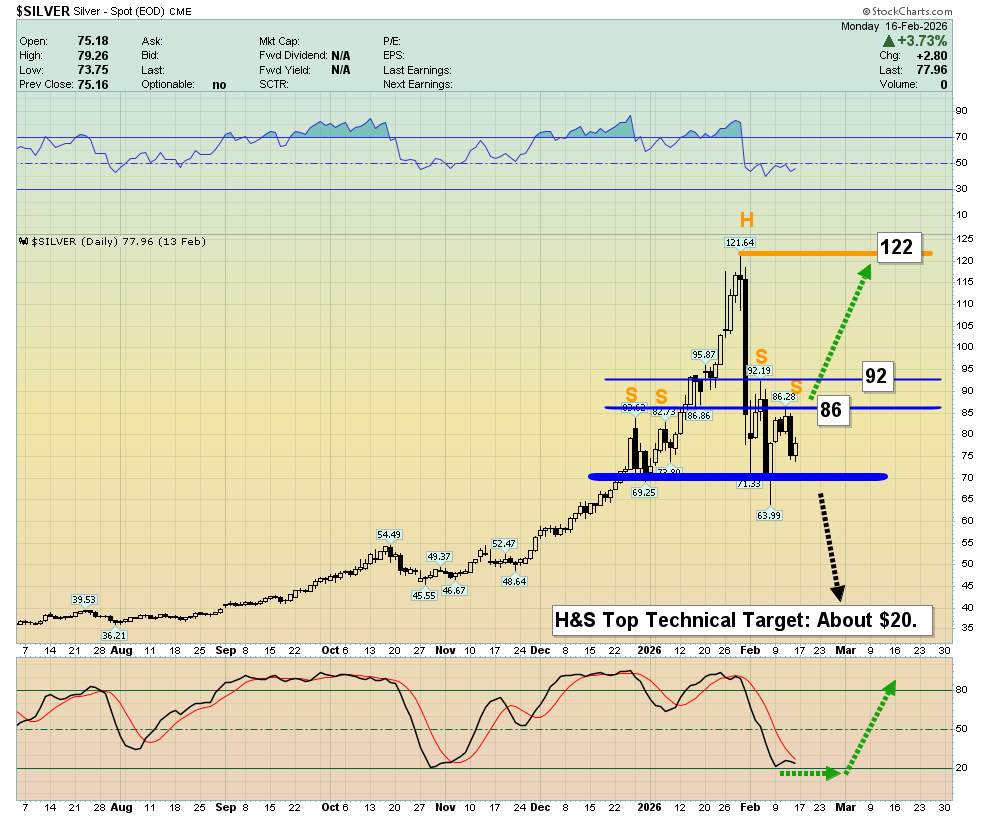
- What about silver? Please click here now. Click to enlarge. The H&S top in play is a technical chart pattern that targets the $20 zone. What could void it?
- Well, please click here now. Click to enlarge. A move to $87 would see silver back above three of the shoulders. A further surge to $93 would complete the destruction of the pattern and financially annihilate most leveraged bears.
- To be a pure silver bug (an investor who is 100% invested in silver or close to it) requires great intestinal fortitude. For the average investor who has recently become interested in this spectacular metal, lots of dry fiat powder to buy at a surprise is highly recommended.
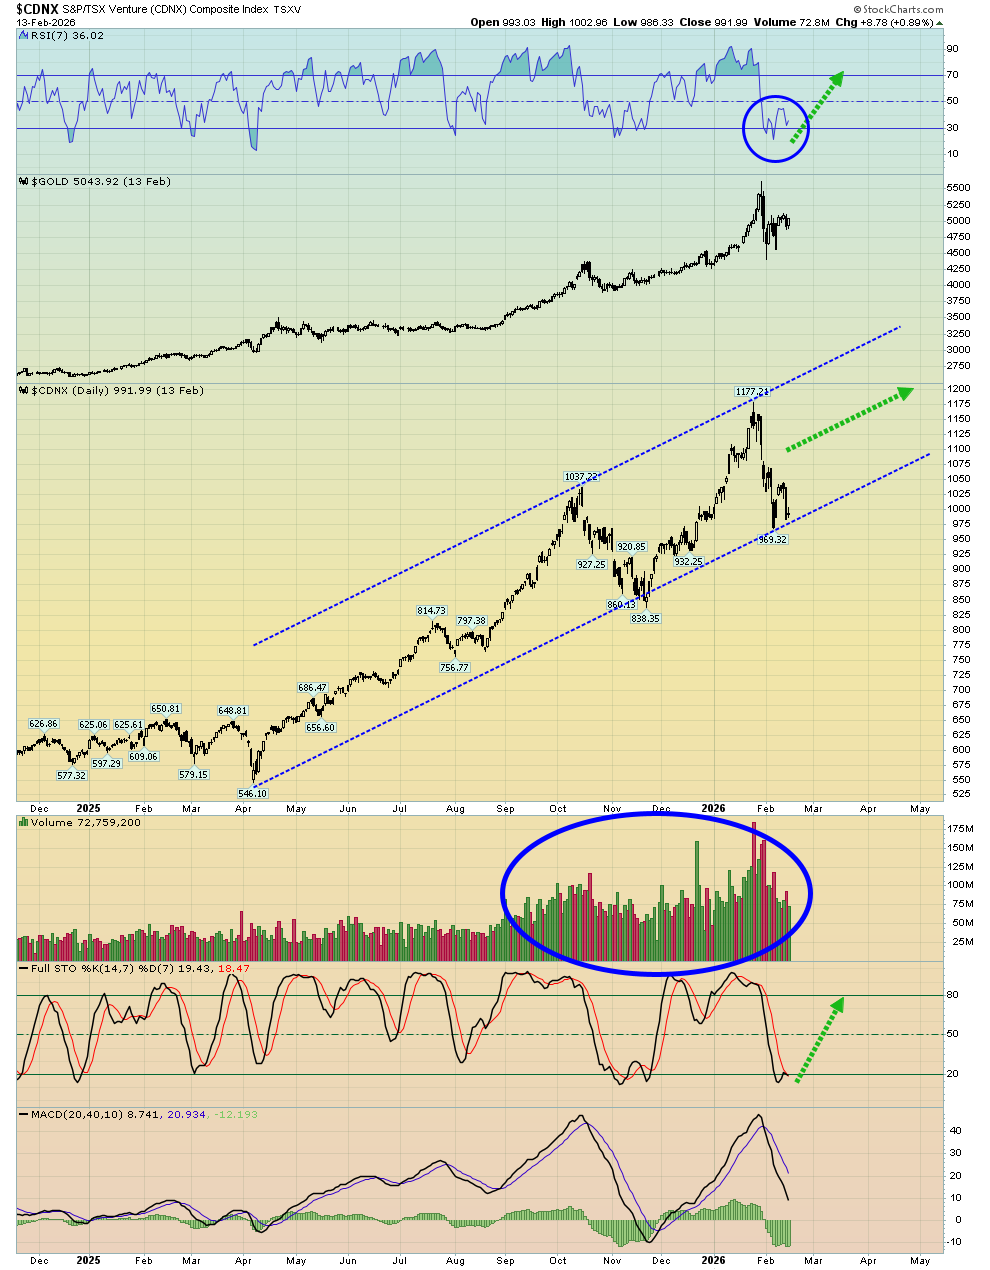
- What about the miners? Please click here now. Click to enlarge this CDNX daily chart. The RSI and Stochastics oscillators are positive, but the key 20,40,10 series MACD indicator is acting like a wet noodle. If that were to firm up, the junior mining stocks' uptrending action should resume.
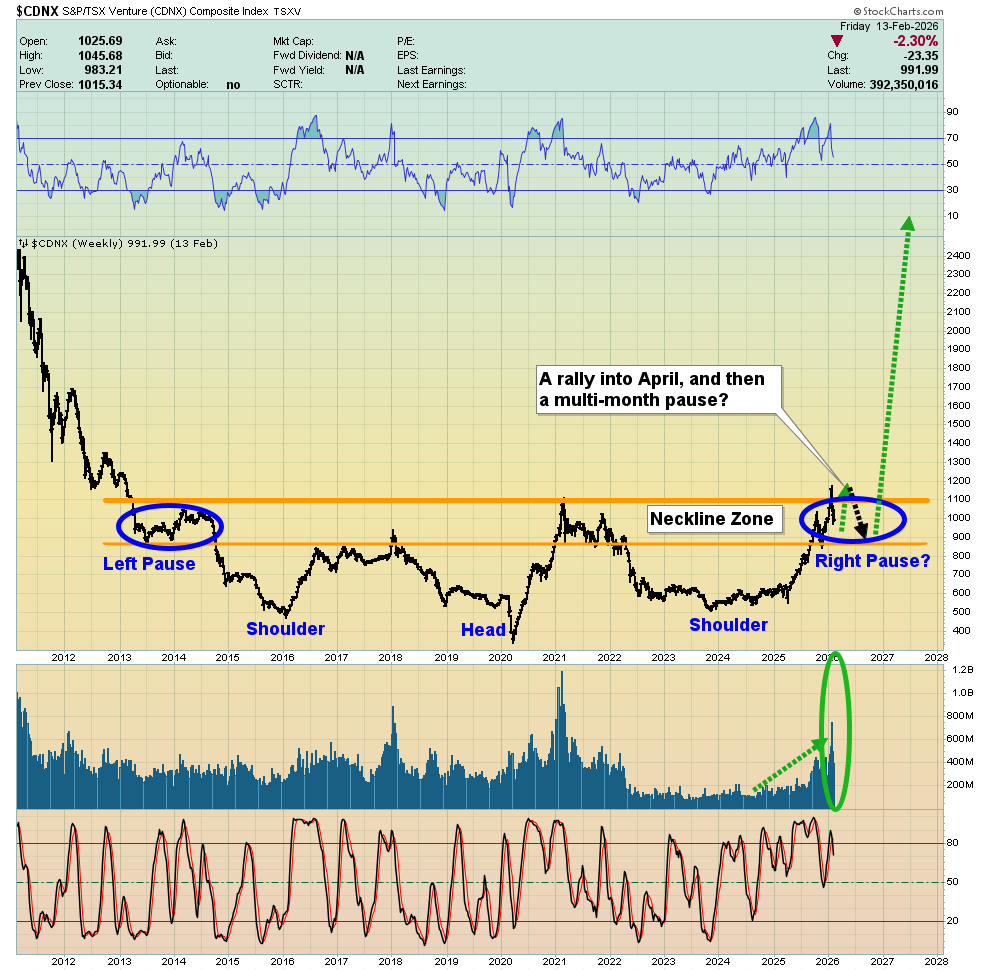
- Please click here now. Click to enlarge this stunning CDNX weekly chart. The base pattern is glorious, and it’s likely pointing to higher prices for intermediate and senior miners too.
- The most likely scenario now is a short-term pause as Chinese citizens (and robots) celebrate the New Year, and then there should be a nice surge into April for the miners. From there, a seasonal range trade into the summer is likely, followed by a massive “real deal” breakout above the 1177 highs.
- In the interim, many individual miners are likely to “front run” the CDNX and rally to new highs. Clearly, junior mine stock investing isn’t for everyone, especially with size, but as this gargantuan gold bull era rollout continues, these miners look set to outperform everything!
- Please click here now. Click to enlarge this long-term GDX versus gold chart. Gold stocks are clearly the most undervalued sector in the history of markets and…
- The good news is that this situation may only be a few months away from the only great reset that really matters… the great reset of general gold stock valuation versus gold!
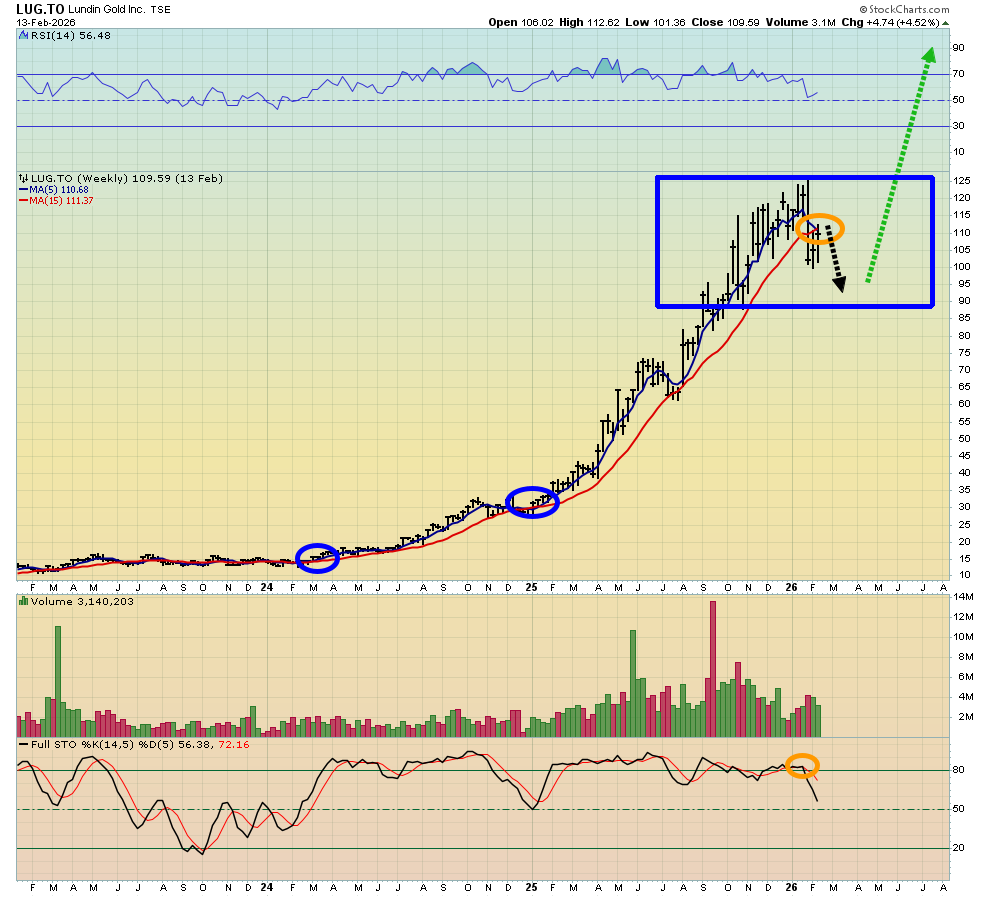
- Please click here now. Click to enlarge this exciting weekly Lundin Gold chart. Most gold producers sport AISCs (all-in sustaining costs) in the sub $2000/oz area, and silver producers are at about $20.
- Lundin’s AISC is closer to $1000, but even the leanest gold miners need a technical pause from time to time. Note the action of the key 5,15 series moving averages. Dips in the miners (both juniors and seniors) can be bought with confidence; gold is consolidating its fundamental breakout against all that government stands for… which isn’t much at all.
- It may not be long before the fiat price of gold surpasses that of bitcoin (which is really just a market tool that can be used to get more gold), and it’s only a matter of time before billions of Chinese citizens (and some savvy Westerners) begin adorning not only themselves, but their robots… with lots of gold!
Thanks!
Cheers
St
About the author
