
- In war, the best soldiers prepare for surprise.
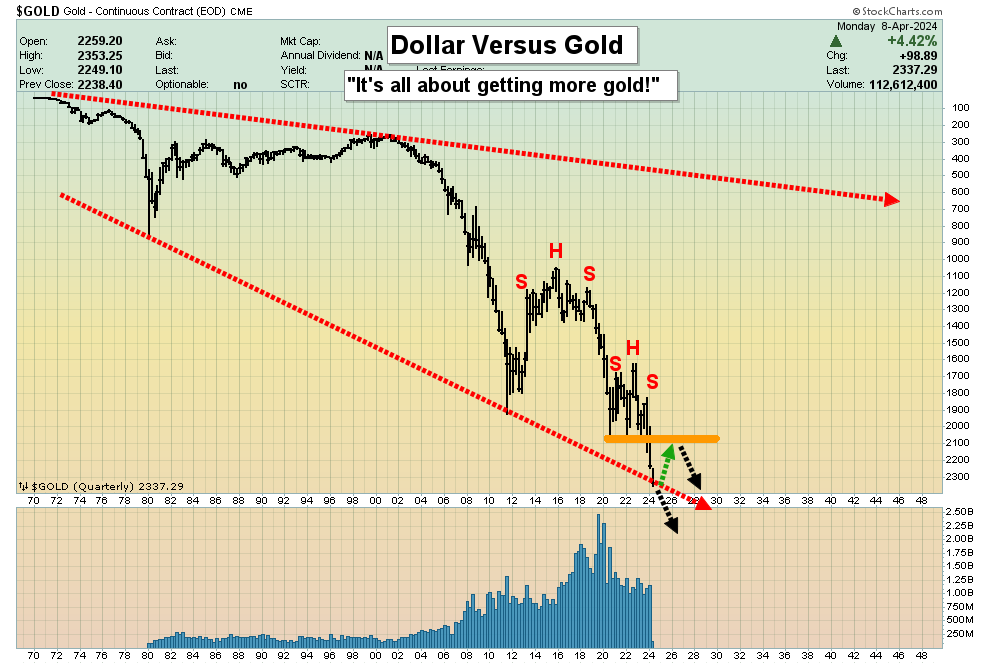
- Please click here now. Click to enlarge this dollar versus gold chart.
- Twin H&S top meltdowns are in play. Most mainstream analysts and investors in the West were surprised by the violence of the latest collapse of their beloved fiat.
- In the East, the big gold bug focus isn’t on predicting the price like it is in the West. The awesome focus is on…
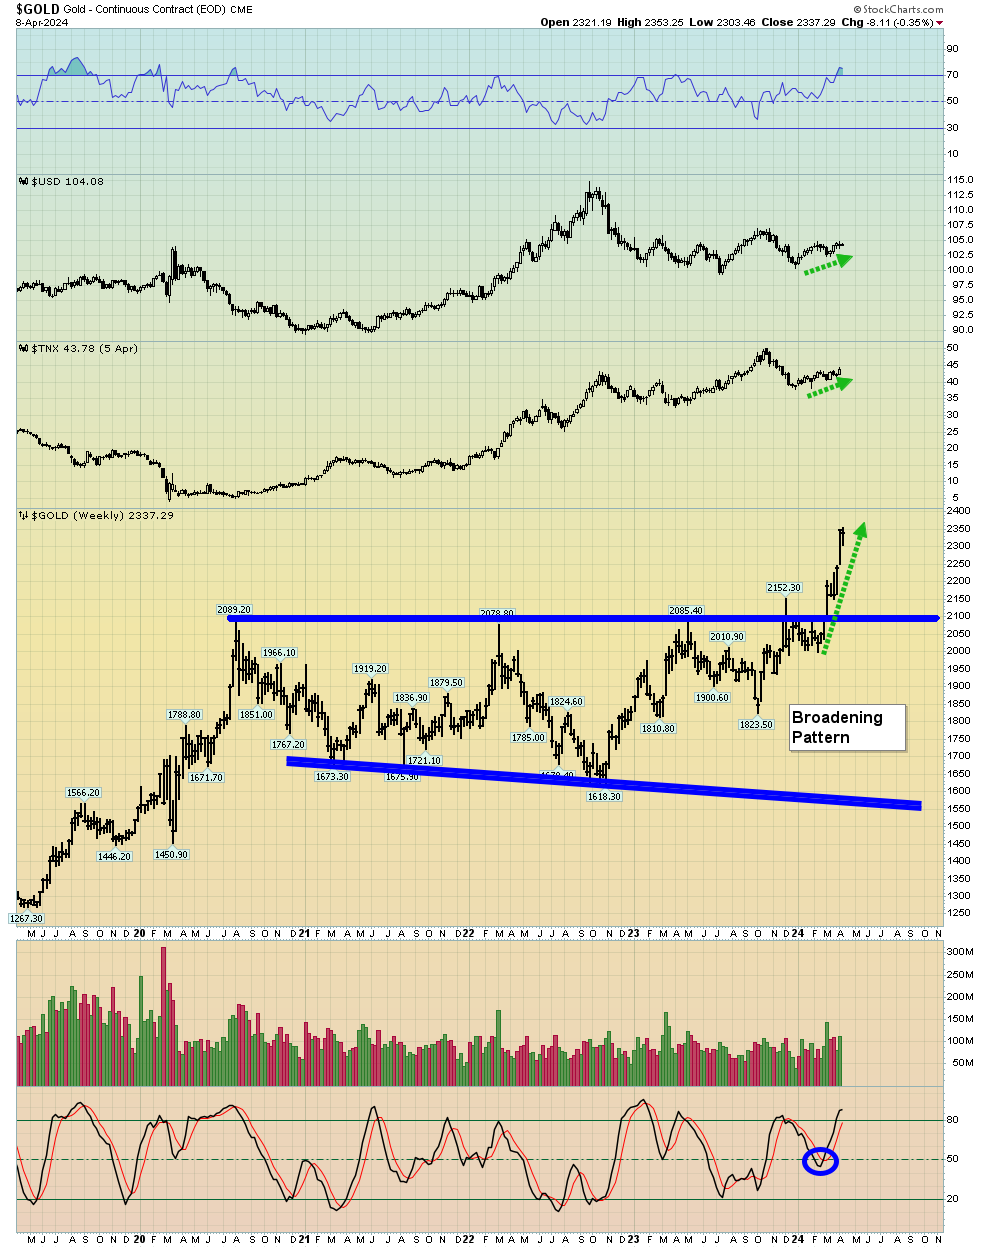
- Getting more gold! Various investor tools and tactics are available to accomplish this mission on an ongoing basis, and on that note, please click here now. Click to enlarge. For the last couple of years, I’ve warned investors of the world that a broadening formation was in play on this weekly gold chart.
- Broadening patterns indicate a loss of control in a market. In this case, there’s a loss of control in the world’s largest market, which is US fiat.
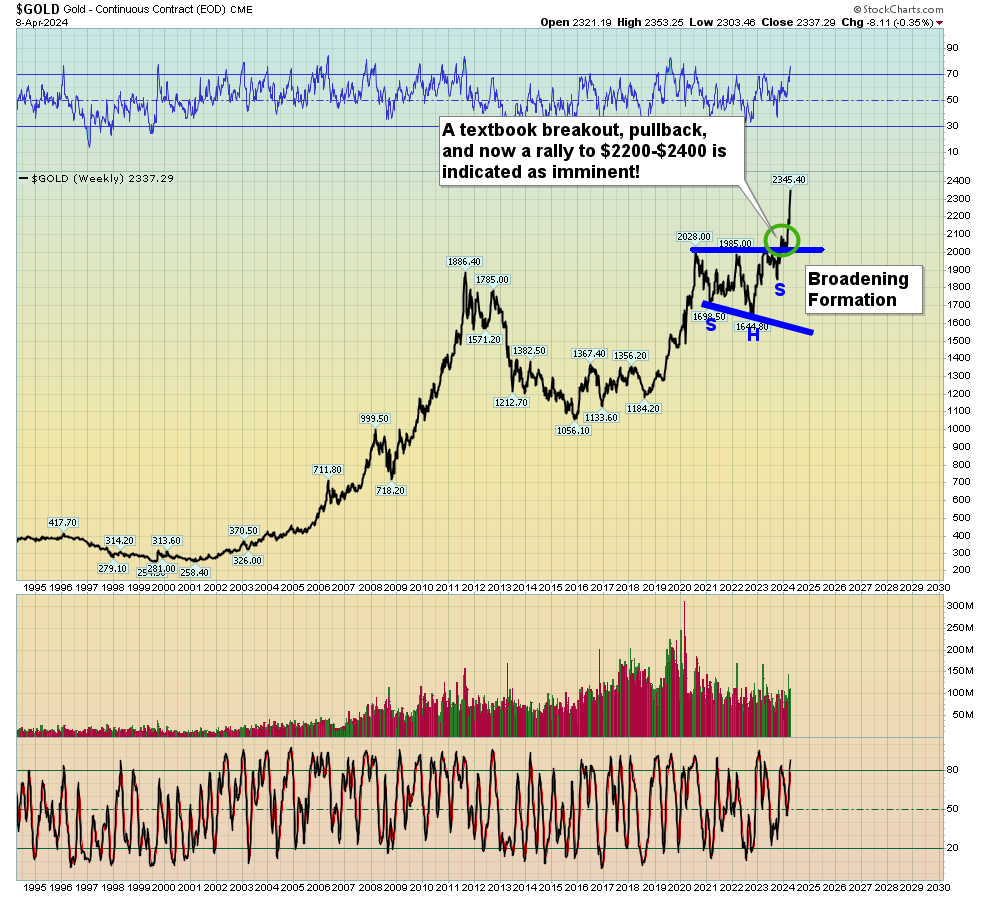
- For another look at it (on a weekly line chart), please click here now. Breakouts from broadening patterns tend to be extremely violent.
- That was the case for the US stock market in 1929 (to the downside), and it’s the case for gold versus all fiat now.
- Note how firm the dollar index and interest rates have been during gold’s recent “rocket ride”. If the dollar index and rates were to lose their firmness and tumble, could gold quickly surge to $3000 or even $4000?
- The answer is yes!
- In terms of preparation… preparation to get more gold… all precious metals investors should be prepared to buy gold, silver, and the miners with significant aggression on a price dip to $2100.
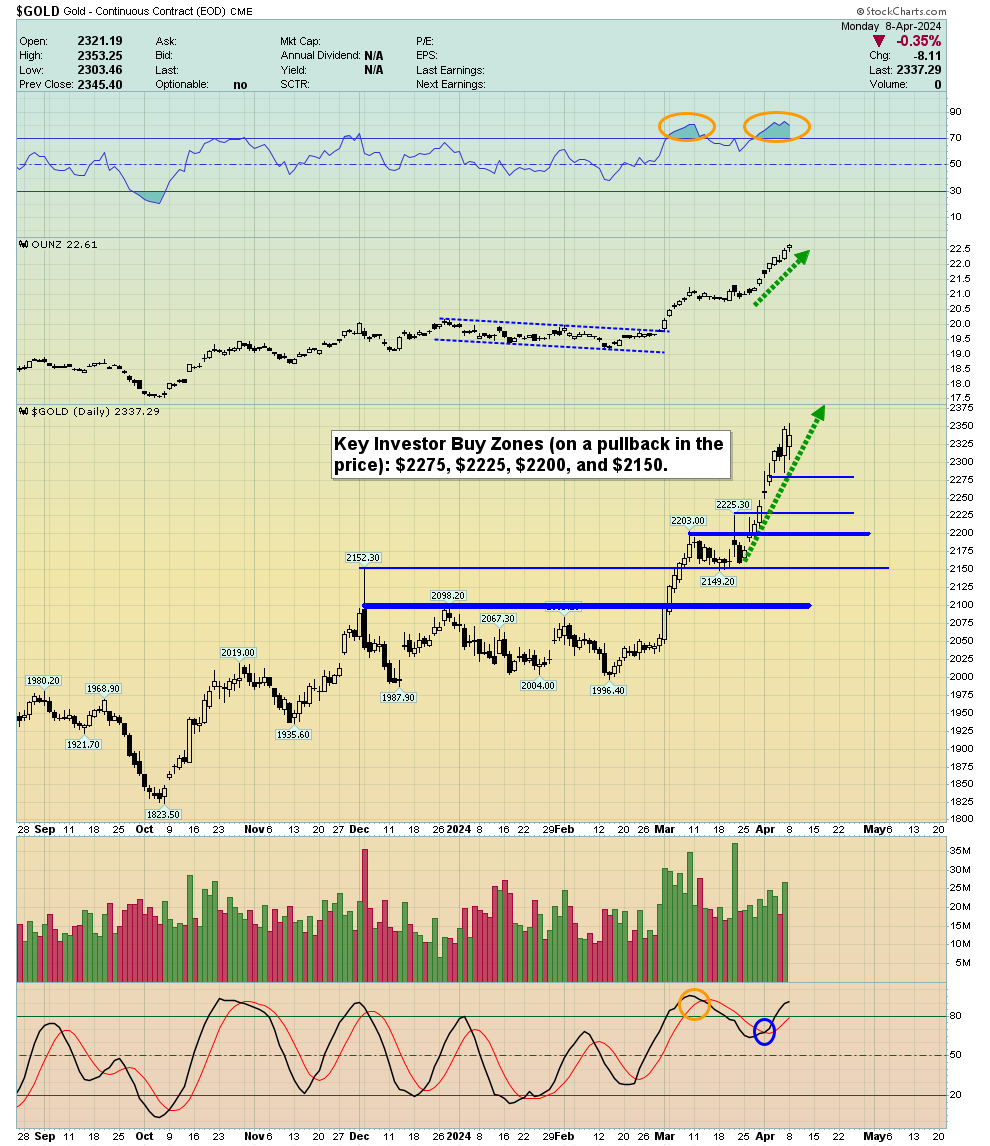
- That’s unlikely to happen in the short or medium term (if ever). So, to identify key buy zones, a look at the daily gold chart is required. On that note, please click here now. Click to enlarge. The price action is superb, and the buy zones are clear.
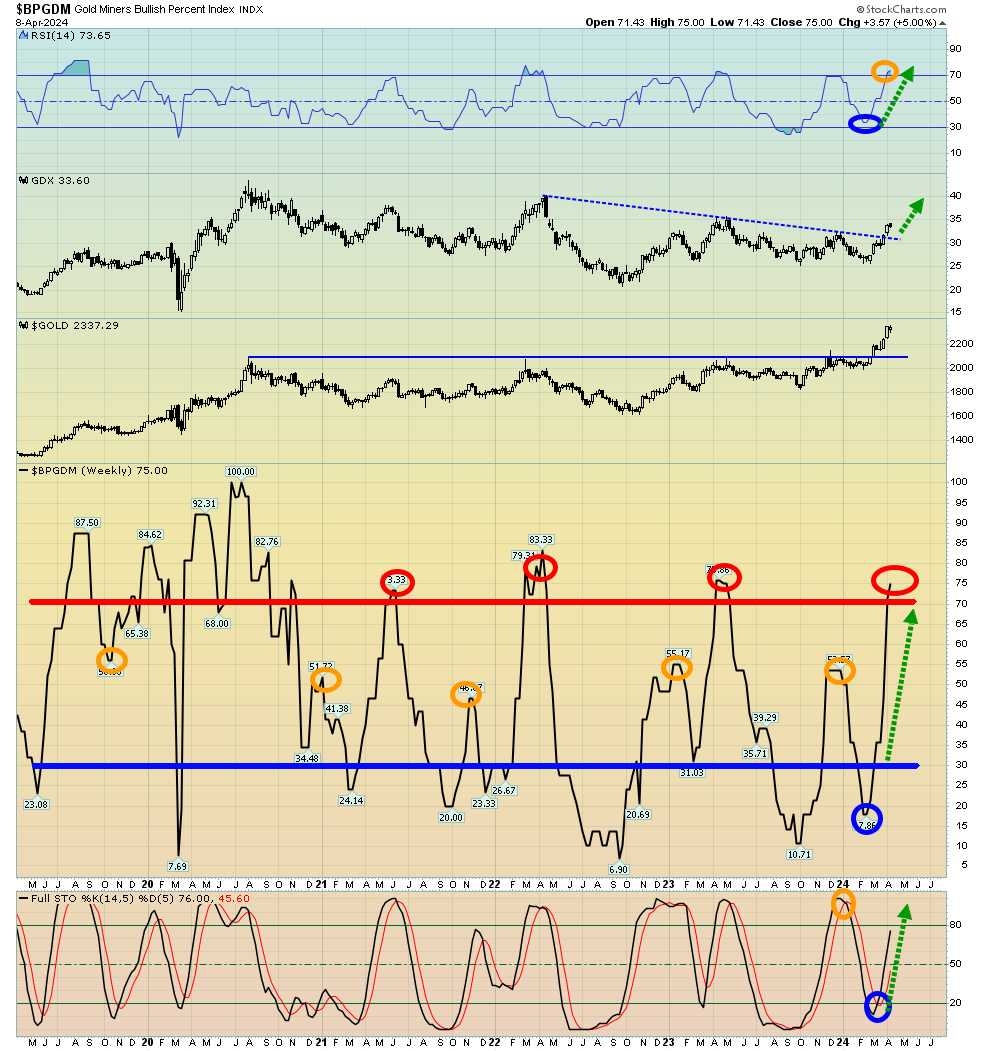
- Sentiment? Please click here now. Click to enlarge this weekly BPGDM sentiment index chart. The index and RSI are both in the overbought zone, but the key 14,7,7 series Stochastics oscillator has yet to arrive there.
- The best sentiment indicator is the individual investor’s own mirror. When they look into it does the investor see greed, confidence, or fear? Also, note that in 1995 US stock market oscillators and sentiment indicators went into the greed zone… and stayed there for the next five years.
- With gold, it’s only a matter of time before three billion Chindians totally dominate global gold price discovery. When that happens, sentiment will go into the confidence zone… and probably stay there for 200 years.
- A daily focus on the big picture is critical for investors as inflation, recession, the 2021-2025 war cycle, a wildly overvalued stock market, debt ceiling horror, and incredible empire transition dominate the investing landscape. I cover this big picture 5-6 times a week in my flagship Galactic Updates newsletter. At $199/year, investors feel the price is too low, but I’m offering a $179/15mths “special offer” that investors can use to get in on the winning action and meticulous analysis. Click this link to get the offer or send me an email and I’ll get you a payment link. Thanks!
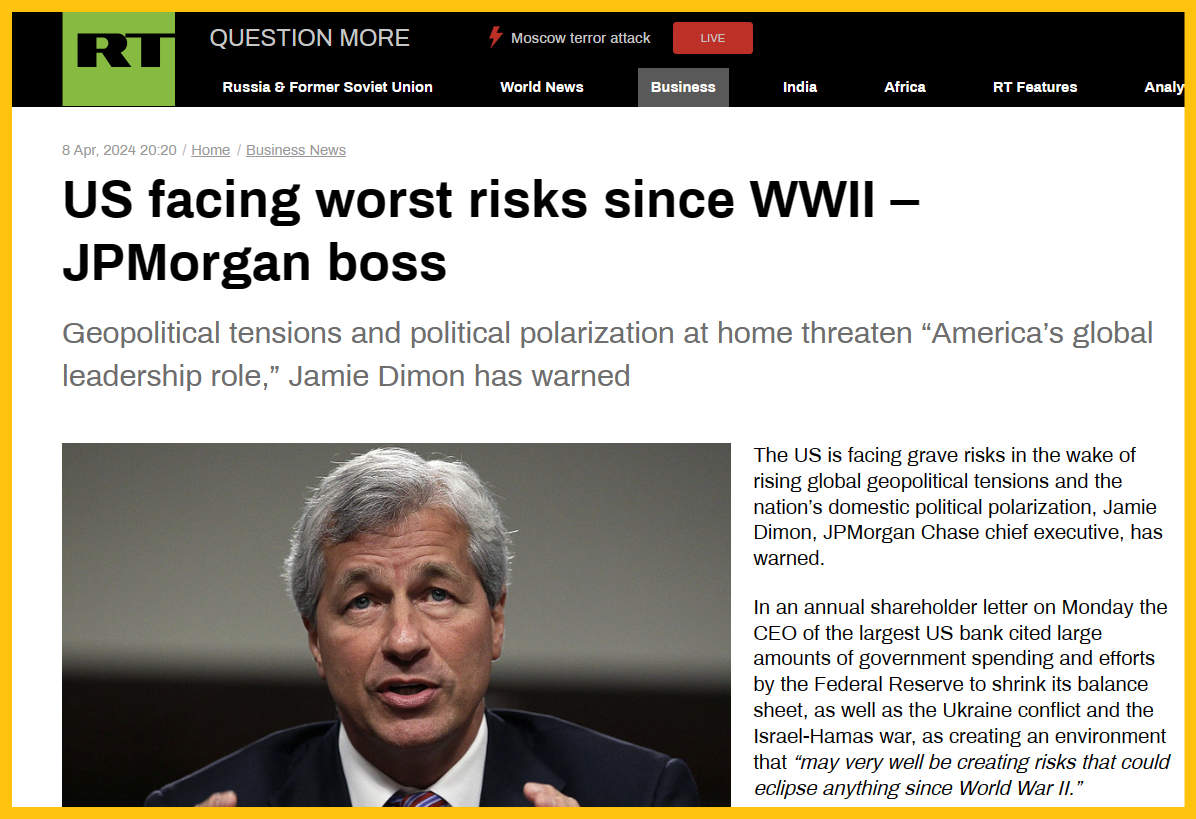
- The 2021-2025 war cycle? Please click here now. Jamie Dimon is correct that the American government (and its fiat) is “on the ropes”, but he fails to address the fact that the United States military, given its huge debt-funded size, is the most pathetic in the history of empires.
- The US government has failed to win a war since WW2 (with the “grand” exceptions of its “meddler wars” in Panama and Grenada). Worse, the government has left mammoth citizen carnage in the wake of each of its war mongering schemes gone awry.
- The predictable bungling is of course part of what has fuelled the weekly gold chart broadening formation breakout and vertical surge in the price.
- The miners? Eastern gold bugs are obsessed with gold jewellery, and Western bugs are obsessed with gold stocks. Both are in “awesome mode” now, and probably will stay that way for the next two years.
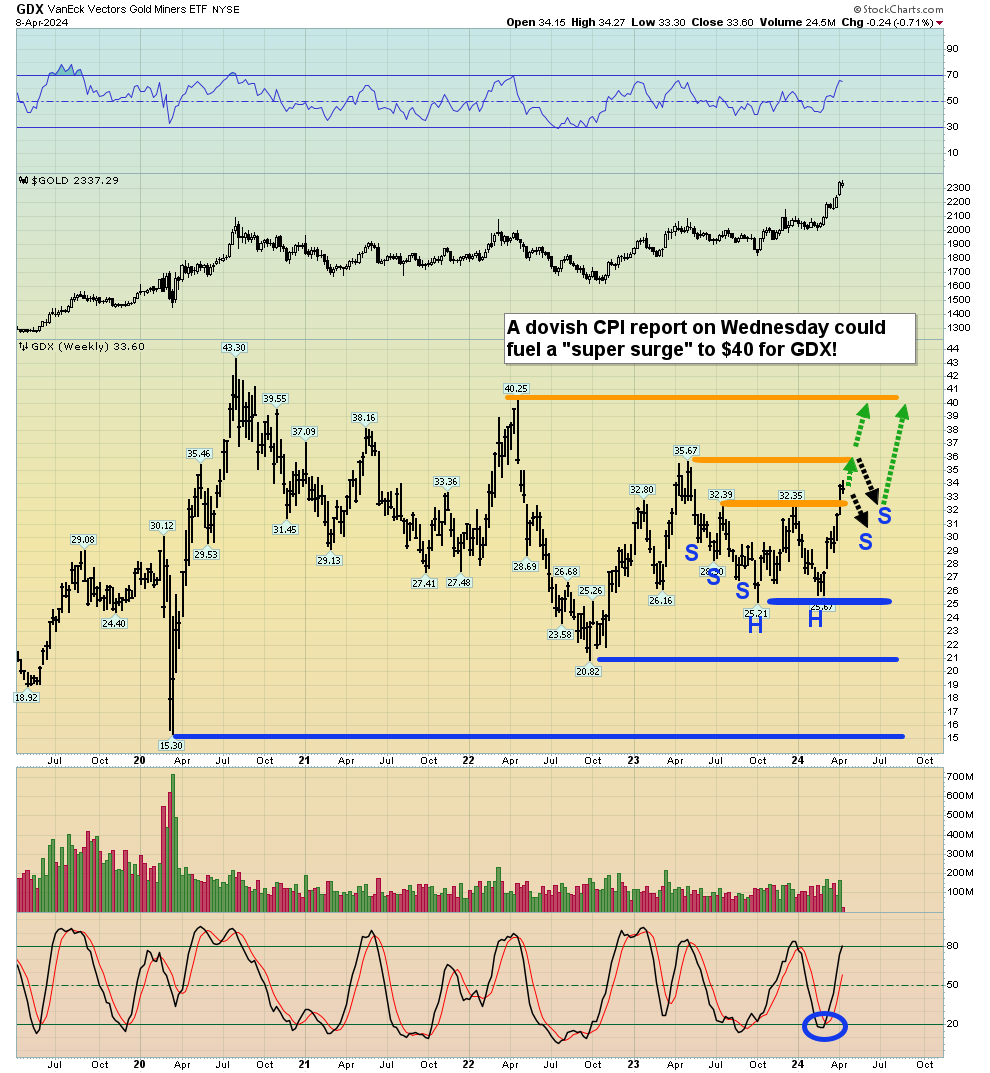
- For a look at a key GDX weekly chart, please click here now. While GDX is overbought by some measures, a dovish print for the key CPI (consumer inflation) report tomorrow could put gold stocks into “hyperdrive” and send GDX to $40!
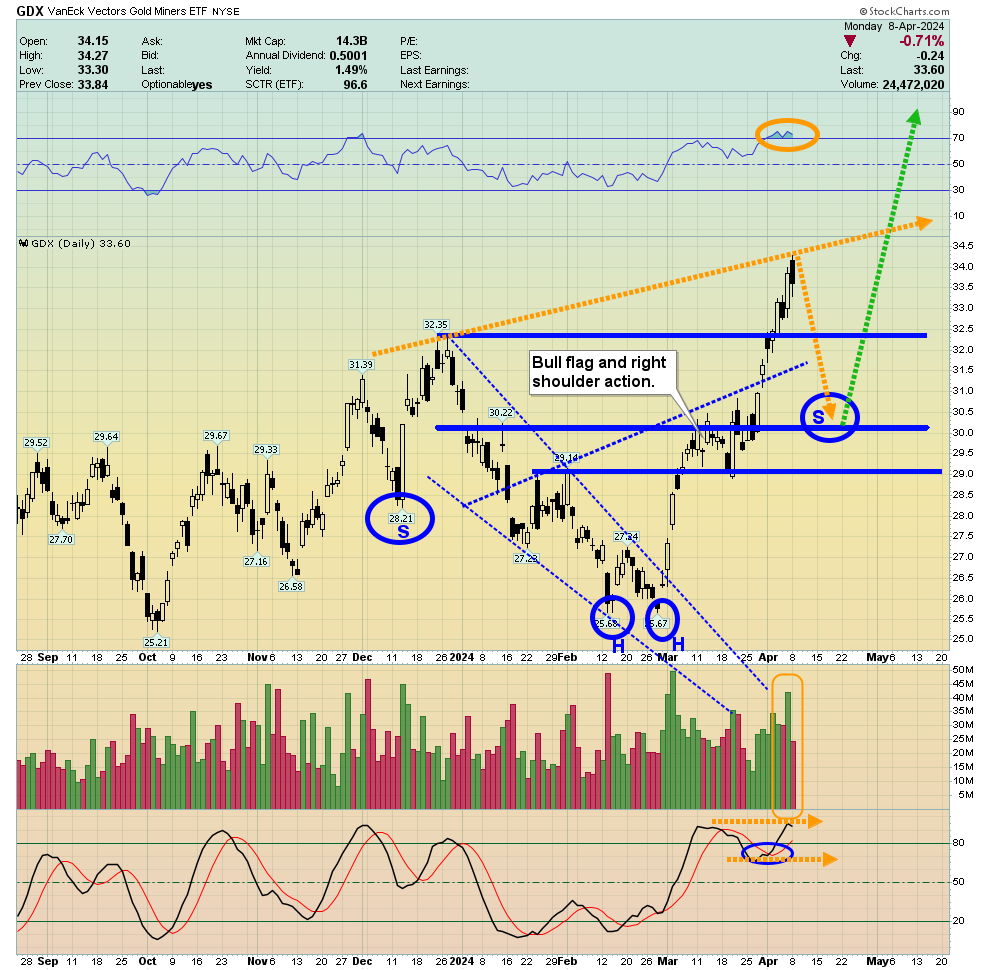
- For a look at the daily chart, please click here now. Click to enlarge. Even if there is a pullback, it would simply make the chart even more bullish than it is now. A right shoulder of a huge inverse H&S pattern would form, with target of about $40-$42.
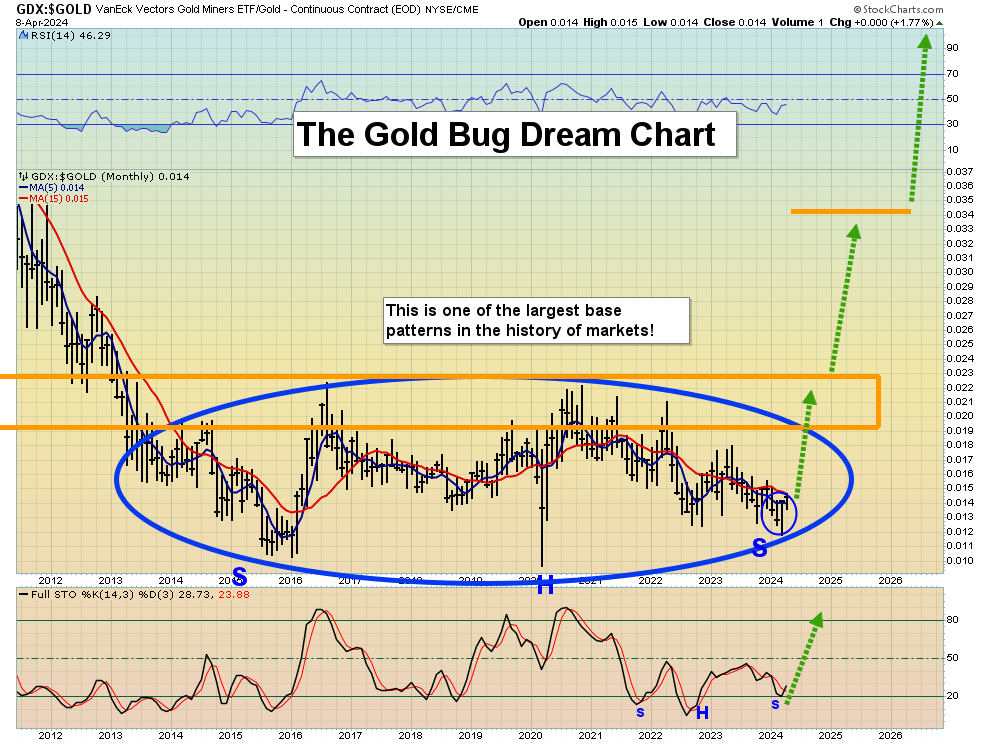
- Please click here now. Click to enlarge what is currently the greatest chart in the world, showcasing the most upside potential for the asset in play… gold and silver mining stocks.
- Note the stunning inverse H&S pattern on the chart and the additional inverse H&S in play for Stochastics around the right shoulder low. Here’s the bottom gold stocks line: Chinese and Indian gold bullion buyers are poised to put global gold market sentiment into the confidence zone and keep it there. This sets up gold stocks to outperform everything on the planet… for at least the next 10, 20, and maybe 200 years!
Thanks!
Cheers
St
About the author
