Gold was crushed this week following the latest Federal Open Market Committee decision. While the Fed didn’t taper quantitative easing or hike interest rates, Fed officials’ predictions of future rates proved more hawkish than expected. That ignited a powerful US-dollar rally, scaring speculators into violently fleeing gold futures. But that painful selling purge leaves gold’s near-term setup way more bullish than it had been.
The FOMC meets about every six weeks to make monetary-policy decisions. This week’s latest one was universally expected to be uneventful, with little market impact. Traders, analysts, and economists didn’t think the Fed would declare any upcoming changes to its $120b per month of quantitative-easing bond monetizations or zero-interest-rate policy. Indeed the FOMC’s statement was nearly identical to the prior one.
But with every other FOMC meeting or once a quarter, the Fed releases a supplementary document called the Summary of Economic Projections. That includes a scatter chart known as the “dot plot”. It summarizes individual Fed officials’ outlooks on federal-funds-rate levels over the next few years. This dot plot has proven notoriously inaccurate in forecasting future rate changes, as the Fed chair himself often warns!
As usual, Jerome Powell gave a press conference right after this week’s new FOMC decision. One of the economics reporters participating in that Zoom call asked him about the dot-plot changes. The following is copied and pasted verbatim out of the Fed’s official transcript of that event, where Powell dismissed the dot plot! “First of all, not for the first time about the dot plot. These are, of course, individual projections.”
“They’re not a Committee forecast, they’re not a plan. And we did not actually have a discussion of whether lift-off [hiking the federal-funds rate] is appropriate at any particular year, because discussing lift-off now would be highly premature, wouldn’t make any sense. If you look at the transcripts from five years ago, you’ll see that sometimes people mentioned their rate path in their interventions. Often they don’t.”
“And the last thing to say is, the dots are not a great forecaster of future rate moves. And that’s not because – it’s just because it’s so highly uncertain. There is no great forecaster of future dots. So, dots to be taken with a big grain of salt.” Interestingly immediately after Powell again said ignore the dot plot, the US benchmark S&P 500 stock index reversed sharply higher after plunging 1.0% on those latest dots.
But bonds, the US Dollar Index, and gold didn’t react to Powell’s “big grain of salt” discrediting, they kept moving on that latest dot plot. Given the violence of those moves, you’d think Fed officials saw rate hikes coming later this year. But they were opining on no federal-funds-rate increases in both 2021 and 2022! It was way out in 2023, two-plus years from now, that the previous consensus of no rate hikes shifted to two.
In addition to still being an eternity away in financial-market terms, those two hikes in 2023 weren’t a high-conviction view. The dots, rate forecasts from individual FOMC officials, were widely-dispersed. And the “Longer run” view on rates after 2023 didn’t budge this week, with these monetary-policy decision makers still seeing the FFR eventually returning to the 2.25%-to-2.50% range. This latest dot-plot shift was minor.
But futures speculators ignored Powell himself and acted as if the FOMC had formally declared rate hikes were imminent. As higher interest rates make the US dollar relatively more attractive compared to major competing currencies like the euro, the USDX rocketed 0.8% higher in the wake of those dots! That was its biggest daily surge since the end of April, and was what actually wreaked the havoc in gold markets.
Gold-futures speculators look to the dollar’s fortunes as their primary trading cue. Throughout millennia of human history, gold has proven the ultimate global currency. It remains a direct competitor to the US dollar. So specs watch the dollar like hawks and often do the opposite with their gold-futures trading. When they rush in or purge out en masse, that really moves gold. These traders dominate its short-term price action.
That’s because gold futures allow extreme leverage far beyond the decades-old 2.0x legal limit in stock markets. Before those latest Fed dots unleashed that violent gold-futures puking, gold was trading near $1,860 per ounce. So each 100-ounce gold-futures contract was controlling $186,000 worth of gold. Yet the CME Group running that market was only requiring specs to hold $9,000 cash margins for each contract.
That meant these traders could run extreme leverage as high as 20.7x! Every 1% move in the gold price would impact their capital risked at 20.7%. If gold moved only 4.8% against their positions at maximum margin, they would lose 100% of their capital risked. This ridiculous danger forces gold-futures traders to maintain incredibly-myopic ultra-short-term focuses. Their time horizons are compressed into days and hours.
So when the US dollar soared on maybe seeing the Fed hike rates a couple times a couple years from now, gold-futures speculators had to sell. Leading into this latest FOMC decision, gold had been stable near $1,860 all day. But within minutes of the dots shifting slightly that Powell often argues have nothing to do with Fed policy decisions, heavy gold-futures selling pummeled this metal sharply lower near $1,837.
For normal traders not running crazy leverage, a 1.2% gold drop on a perceived hawkish Fed is no big deal. But that loss was amplified up to 21x for gold-futures specs, so they were forced to sell regardless of their own gold outlooks. And unfortunately heavy gold-futures selling quickly coalesces into a self-feeding vicious circle. The more gold falls, the more these traders have to sell or risk catastrophic losses.
The more they sell, the faster gold falls! That cascading gold-futures selling runs stops on long-side gold-futures traders, while enticing big new short selling. In the two hours between those latest Fed dots and the US market close Wednesday, gold plunged 1.6% to $1,830. But unfortunately FOMC-triggered US-dollar surges hammering gold don’t usually run their courses until foreign traders have their chances to react.
It usually takes a day or two after a market-moving Fed decision for gold to stabilize. It continued falling after the US markets closed Wednesday, nearing $1,810. Then it rallied back near $1,825 overnight in early Asian trading, but selling resumed heading into the Asian close. It intensified as European markets came online. When the globe spun back around to the US open on Thursday, gold was limping near $1,780.
That was crazy. In 17 hours after the FOMC announced no slowing in the blistering pace of QE money printing and no rate hikes, gold plummeted 4.3% or $80! That was because six out of eighteen top Fed officials decided they might see a slightly-higher federal-funds rate two-plus years from now! And for the umpteenth time, the Fed chair himself dismissed the dot plot as “not a great forecaster of future rate moves.”
For decades now, gold futures’ leverage-enabled tyranny over short-term gold price action has endlessly frustrated precious-metals speculators and investors. Gold-futures specs don’t command much capital at all in the grand scheme of the gold markets, yet every dollar they deploy can have up to 21x the gold-price impact of a dollar invested outright! These traders punch way above their weights in gold-price influence.
But the silver lining to gold-futures-driven gold plunges is they are very-short-lived. Heavy spec selling soon exhausts itself as their very-finite capital firepower runs out. Once their likely long and short selling is largely spent, that leaves room for nothing but buying. So big gold purges even after more-hawkish-than-expected FOMC decisions often quickly reverse, driving gold sharply higher in proportional V-bounces.
Speculators’ total gold-futures positioning is only reported weekly in the famous Commitments of Traders reports. While current to Tuesday closes, those aren’t released until subsequent late Friday afternoons. So the latest-available spec gold-futures data when this essay was published was only current to June 8th. That day gold closed much higher at $1,893, before slumping in the CoT week leading into the Fed.
This chart superimposes daily gold prices during the last several years or so over specs’ weekly gold-futures positioning. Their total long contracts are rendered in green, and their total shorts in red. Specs’ collective positioning remained quite bullish for gold even before its pre-FOMC slump and post-FOMC plunging. And all that heavy selling since this June 8th CoT leaves gold’s near-term setup far more bullish.
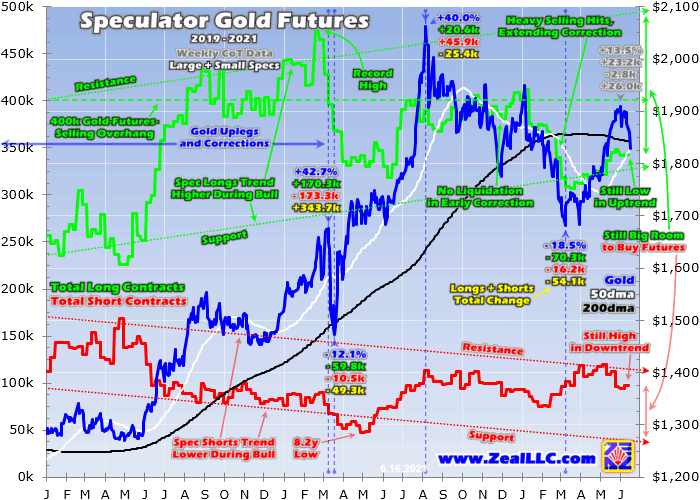
Gold’s current secular bull market was born in mid-December 2015, incidentally right when the FOMC was launching a new rate-hike cycle after 7.0 years of ZIRP! Despite the Fed hiking nine times by late 2018, this gold bull continued advancing on balance. At its latest $2,062 peak in early August, gold had powered 96.2% higher over 4.6 years. After a healthy correction, this bull is very much alive and well today.
Secular gold bulls run for a long time, the last one soared a colossal 638.2% higher over 10.4 years ending in August 2011! Naturally the longer its bulls last, the more bullish all traders get on gold prices. That even includes those myopic hyper-leveraged gold-futures speculators. Their total long contracts slowly meander higher in uptrends as gold bulls mature, while their total shorts drift lower in downtrends.
On June 8th before gold fell 1.8% in the CoT week leading into the FOMC and plunged another 4.3% in the 17 hours after, speculators’ gold-futures positioning was already quite bullish. Their total longs at just 342.6k contracts were still low in their uptrend, way down near its support. And their total shorts running at 97.8k contracts were still high in their downtrend, up around resistance. There was way more room for buying.
Since specs’ leveraged gold-futures trading dominates gold’s short-term price action, I analyze every new CoT week’s positioning data and its implications for gold in our weekly and monthly newsletters. One way we visualize specs’ total longs and shorts in relevant context is to consider them relative to their own past-year trading ranges. That reveals whether substantial gold-futures selling or buying is more probable soon.
That latest-reported June 8th CoT saw total spec longs and shorts running 34% and 52% up into their 52-week trading ranges. The most-bullish near-term setup for gold is 0% longs and 100% shorts, revealing likely selling exhaustion leaving room for nothing but buying. Since specs’ longs usually outnumber their shorts by several-plus times, those upside bets on gold are proportionally more important for driving its price.
So speculators had far more room to buy than sell even before this recent gold carnage. And that was absolutely driven by gold-futures selling. How can we know at this point? Gold’s much-larger longer-term driver is investment demand, which dwarfs spec gold-futures trading. But since it isn’t leveraged, it rarely bullies gold’s prices around as violently as amplified gold futures. This recent sharp selloff reeked of them.
While comprehensive global-gold-investment-demand data is only published quarterly, a high-resolution daily proxy is the combined holdings of the leading and dominant GLD and IAU gold exchange-traded funds. Between that latest June 8th CoT and gold’s Fed-day plunge this Wednesday, GLD+IAU holdings actually climbed 0.6%! Builds in these reveal stock-market capital flowing into gold, or investment buying.
That very day the latest Fed dots Powell warns against showed two potential rate hikes at least a couple years down the road, GLD and IAU experienced 0.1% and 0.2% holdings builds. So the American stock traders often dominating global gold investment demand weren’t selling gold-ETF shares faster than gold was being hammered by futures selling. On the contrary, they were doing slight buying as gold plunged.
No significant GLD+IAU draws guarantees gold’s recent plunge was gold-futures-driven. And there’s no doubt the next couple CoT reports covering this pre-FOMC week and the hawkish-dots reaction since will confirm that in spades. And that had to be a big spec longs dump, and likely sizable new shorting, to hammer gold so sharply lower. That means spec gold-futures positioning is now way more bullish post-purge!
Speculators’ futures puking since June 8th had to have left their total longs way lower than that 342.6k contracts. They are probably now well under uptrend support, maybe even down to a new multi-year low. That would imply these leveraged traders’ gold-futures liquidation is exhausted, leaving room for nothing but buying. Like usual, that should soon catapult gold sharply higher in a proportional V-bounce recovery.
And total spec shorts are also likely now much higher than June 8th’s 97.8k contracts. That day’s overall speculator positioning at 34% longs and 52% shorts has to have shifted much closer to that most-bullish-possible near-term setup for gold of 0% longs and 100% shorts. I can’t wait to see how close it got, how many longs specs puked out and shorts they piled into. I’ll cover that in depth in our upcoming newsletters.
So speculators’ gold-futures setup almost certainly now looks super-bullish for gold, with that Fed-dots scare squeezing out the great majority of potential selling. Had spec longs been really high before their crazy overreaction to two potential rate hikes over two years from now not officially forecast by the FOMC, we would have to be wary of more selling. A great example of that happened in March 2020’s stock panic.
With government COVID-19 lockdowns threatening to unleash economic devastation, traders rushed into the US dollar as a safe haven. That unleashed huge gold-futures selling, collapsing gold a brutal 12.1% lower in just eight trading days! Gold was particularly vulnerable then because total spec longs soared to an all-time record high of 473.2k contracts a few CoT weeks earlier. I warned about that before gold plunged.
Generally we should be wary of major cascading gold-futures selloffs when spec longs exceed 400k, a threshold I call the gold-futures-selling overhang. That was exceeded in early January 2021, before heavy gold-futures selling unleashed an extended gold correction. But way down at just 342.6k contracts before this latest gold carnage, there simply wasn’t enough potential selling fuel to sustain a serious gold selloff.
So odds are great gold will soon bounce sharply higher as speculators’ kneejerk gold-futures purging quickly exhausts itself. Like Powell himself often warns, the dot plot has proven notoriously inaccurate at forecasting future federal-funds-rate levels. 2023 is still years away, and the FOMC lacks the courage to hike rates anyway if that drives major stock-market selloffs. That’s a serious risk with today’s bubble valuations!
And since that March 2020 stock panic, the Fed has frantically printed trillions of dollars of new money to stave off a depression-triggering serious stock bear. In only 15.0 months since, the Fed’s balance sheet has mushroomed a staggering 84.4% or $3,640b! This profligate Fed has nearly doubled the US-dollar supply, which is why price inflation is soaring everywhere. That is really bullish for gold prices going forward.
The global gold supply only grows on the order of 1% annually from mining, so vastly-faster monetary inflation leaves far more dollars chasing gold and bidding up its price. And even if the FOMC musters the fortitude to start slowing its $120b of monthly QE bond monetizations late this year, that implies at least another $1.4t of new dollars conjured into existence by the end of 2022! That monetary excess is gold-rocket-fuel.
So it doesn’t make much sense to worry about this week’s ridiculously-overdone gold-futures purge on that notoriously-inaccurate dot plot. That was so violent it had to shake out most of the remaining likely gold-futures selling. That leaves room for massive gold-futures buying to soon catapult this metal sharply higher. This hawkish-dots gold anomaly is a great opportunity to deploy capital in beaten-down gold stocks!
At Zeal we walk the contrarian walk, buying low when few others are willing before later selling high when few others can. We overcome popular greed and fear by diligently studying market cycles. We trade on time-tested indicators derived from technical, sentimental, and fundamental research. That has already led to unrealized gains in this current young upleg as high as +74.6% on our recent newsletter stock trades!
To multiply your wealth trading high-potential gold stocks, you need to stay informed about what’s going on in this sector. Staying subscribed to our popular and affordable weekly and monthly newsletters is a great way. They draw on my vast experience, knowledge, wisdom, and ongoing research to explain what’s going on in the markets, why, and how to trade them with specific stocks. Subscribe today while this gold-stock upleg remains young! Our recently-reformatted newsletters have expanded individual-stock analysis.
The bottom line is this week’s Fed-sparked gold-futures purge was ridiculous and unsustainable. The FOMC didn’t warn about QE tapering or imminent rate hikes, maintaining its $120b of monthly bond monetizations and ZIRP indefinitely. Instead just a third of top Fed officials said they expected slightly-higher federal-funds-rate levels way out in 2023! And the Fed chair warned to take dots “with a big grain of salt.”
The dot plot is not official, it is not a forecast, and has proven notoriously inaccurate at predicting future FOMC moves. Futures speculators, both on the US-dollar and gold sides, should know better. And that hawkish-dots gold-futures puking erupted from already-low spec-longs levels, so it should quickly exhaust itself. That brutal purge left gold far more bullish, leaving gold-futures traders big room for mean-reversion buying.
Adam Hamilton, CPA
June 18, 2021
Copyright 2000 - 2021 Zeal LLC (www.ZealLLC.com)
About the author