
- It’s All about the Strait of Hormuz
- Inflation to Spike?
- That Word Transitory Again
- Thoughts on Unemployment
- El Segundo, West Palm Beach, New York, DC?, and Boston
There has been so much data released in the past week it’s hard to know where to begin. And that is all compounded by the fog of confusion/war surrounding the “Iran conflict.”
Rather than focus on a single topic, today we are going to go “around the horn” (an old term which refers to going around the Cape of South Africa, which became a baseball term for throwing a ball around the infield in a particular manner, covering all the bases, for those not familiar with American baseball).
Much of the data is inconclusive or not helpful, but it is not as bad as many click-bait pundits suggest as they take each data point and extrapolate it into the future. It’s never that nice and neat.
It’s All about the Strait of Hormuz
Newt Gingrich was very candid in his assessment of the Iranian situation: in an interview with Larry Kudlow, he said, “I don't care what it costs. If they can't keep it [the Strait of Hormuz] open, this war will in fact be an American defeat before very long.”
Summarizing, if we can open the Strait of Hormuz, the oil price will come back down fairly quickly and the mood will change.
As a share of seaborne commodities that pass through the Strait, we’re talking:
- ~34% of the world’s oil,
- ~22% of the world’s minerals, and
- ~16% of world’s fertilizer
. . . plus, a whole bunch of other important things, like jet fuel, aluminum, and a slew of chemicals.
You can see the massive drop off in carriers through Hormuz in the graph below.
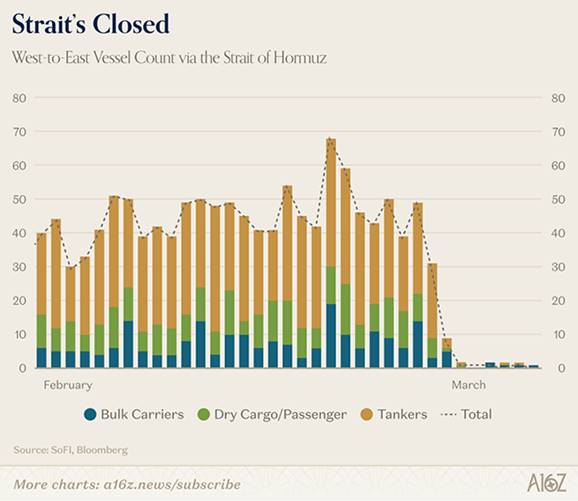
Source: A16Z
David Bahnsen weighed in this morning on Iran:
“$95 oil will take a toll on the economy if it were to last for a week, two weeks, a month. $80 oil, less so. Something sustainably over $100 becomes a major issue. But if all of this is going to end soon, and if, in fact, oil is going to settle back in the low-70's as the futures curve suggests, why does it matter?
“Stock market prices have to reflect whatever impact exists from whatever does happen with oil prices over this period of time, and also the uncertainty over what is happening and how it will all transpire—hence the volatility. A rule of thumb for markets: Bad news gets priced in, then responded to; Uncertainty just leaves us in exacerbated volatility.
“The oil issue is not currently about the mere "headline" reality of the war. The very specific issues in the Strait of Hormuz have generated concerns that commercial shipping faces a sustained headwind that had not been fully discounted when this all began. The administration can say what it wants to say about the success of the operation militarily, and it may very well be 100% right, but if operators, insurers, shippers, and those with commercial interests do not want to operate out of the Strait of Hormuz, it creates a massive marginal impact on economic activity and expectations.
“A substantial control and enabling of operation in that waterway is the major need of the moment for markets, and it does not appear to be imminent. This is not to say that this will not be resolved in three days or three weeks, but it is to say that it might not be, and it is certainly to say that markets now believe in week #2 that the state of the Strait of Hormuz were not anticipated to this degree when the strikes began two weeks ago. That creates a challenge of confidence.
“A host of policy options remain, and if this were a straight-up bet on the US military versus any aspect of Iranian success here, it would be a pretty easy bet for me. But it is not—it is a more nuanced scenario around the reality of the Strait of Hormuz that is in an uncertain position two weeks into this, and that was not expected one week ago, and certainly not 10-14 days ago.
“I do expect a number of other announcements and counter-measures to attempt to offset the Hormuz impact. Ultimately, though, this will remain a source of volatility in oil markets, and therefore stock markets, until there is greater clarity. And the base case is no longer that such clarity will come in mere days.”
It’s not like the military leadership was unaware of the problem from the beginning. They certainly have strategies to deal with the issue, but the Iranian military also has a strategy. Theirs is to wear down the US and Israel. Their only way to effectively do that is to keep the Strait of Hormuz as closed as possible, and to inflict damage on their neighbors hopefully creating pressure on the US and Israel to wind down the war. That would allow the Iranian regime to survive. Survival is their “win.”
Martin Wolf of the Financial Times (subscribe to read) cites a research paper by Capital Economics which tries to analyze what the cost to the world would be depending on the length and physical destruction of the war. (H/T Adam Tooze) Quoting:
“Capital Economics considers three scenarios. The first is of a short, sharp conflict, lasting about two weeks. The estimate is of a loss of around 1.4 per cent of global annual oil exports and a similar proportion of LNG exports. The second is of a conflict lasting three months, but with limited longer-term damage to facilities. The estimate for this is of a loss of 5-6 per cent of world exports of crude and LNG in 2026. The third is also of a conflict lasting three months, but with longer-lasting damage to capacity, notably to Iran’s Kharg Island. The estimate here is of a loss of 8-9 per cent of world exports of oil and LNG, with an impact into 2027. Oil prices could hit $150 a barrel and prices of gas in the EU (per megawatt hour) could hit €120. According to Capital Economics, the only comparable global supply shock to this last possibility was “from the late-1970s to the mid-1980s.”
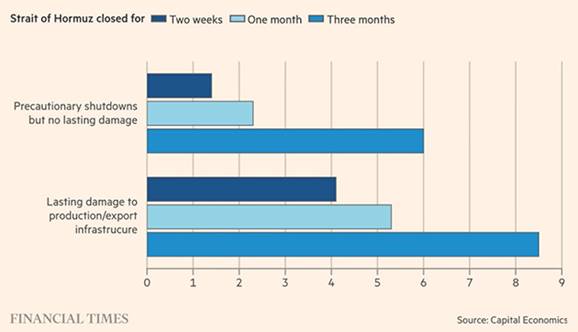
Source: Financial Times; Capital Economics
So, what would this mean for oil and natural gas prices? Note that these are guesses, and will likely be wrong, but I think they at least have the direction right.
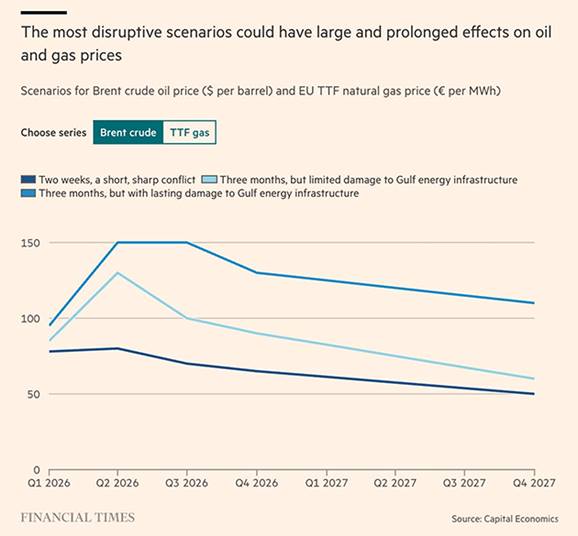
Source: Financial Times; Capital Economics
Note that in two of the scenarios the price of oil drops back to its previous range. A short war, or one where the Strait of Hormuz is essentially open even if the war continues, shows relatively little long-term price damage.
Even if the war lasts three months, but there is no substantial infrastructure damage, the long-term results are frustrating, and certainly inflationary over the next year, but not the end of the world as many armchair analysts claim.
But infrastructure damage? That’s a game changer. So far, the US and Israel have largely not damaged the infrastructure in Iran. Iran has the option of trying to damage the infrastructure of its neighbors and seems to be trying. Can the US take Kharg Island through which ships 90% of Iranian oil? Without damaging the infrastructure?
That would allow the US to control revenues into Iran, which is already suffering serious economic difficulties in massive inflation. That is existential for Iran. I have no way of knowing what will happen, but why is the 82nd airborne mobilizing? Inquiring minds and all that…
Moving on… As we all know, oil and gas are not just for transportation and energy. It is a key component of fertilizers. It is the spring in the northern hemisphere and fertilizer will be needed.

This is a chart of nitrogen fertilizer coming from the Persian Gulf over the last five years. Notice the rather high percentages of fertilizer imports into each country. The US gets 51% of its nitrogen fertilizer from the Persian Gulf. India 89%. This will obviously work its way into food prices later in the year.
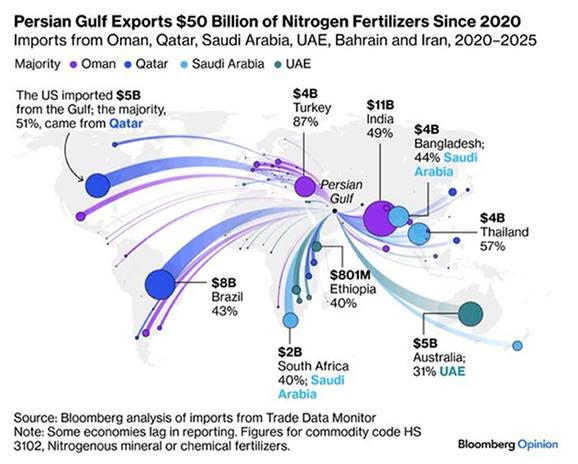
Source: Bloomberg Opinion
All that said, and this could change tomorrow, so far the energy shock hasn’t been as severe as the beginning of the Ukraine war, at least to Europe. From my friends at GaveKal:
“The scale of Europe’s 2022 energy crisis is illustrated by the red line in the chart below, which tracks the price paid by European energy users before and after the invasion. The index combines oil, natural gas, and electricity prices expressed in euros per barrel of oil equivalent (€/boe), weighted by their share in final energy consumption. On this measure, energy prices rose from around €70 to €120/boe the year before the invasion, then surged to an average of €209/boe in 2022, with a peak near €500/boe.
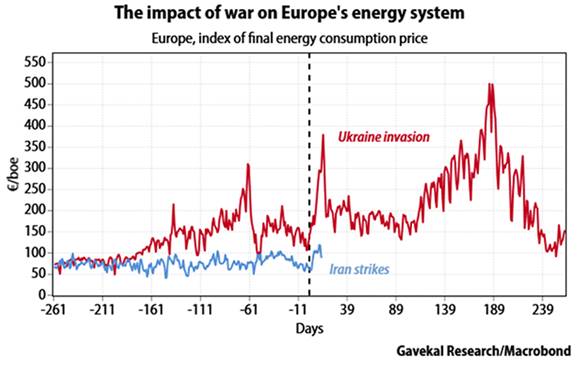
Source: Gavekal Research; Macrobond
“The blue line shows how the current shock compares with 2022 so far. The same composite energy price has increased from around €60 to €90/boe over the past two weeks. Even so, the shock started from a much lower base and remains far smaller than the jump from roughly €120 to €350/boe in the immediate aftermath of Russia’s invasion of Ukraine.”
The release of 400 million barrels of oil from national reserves will help a little, but it only buys a few weeks. Can they get the Strait open by then? No one really knows how long the war will last. Let’s hope it’s over soon.
(Note: 172 million barrels of that oil is coming from the US strategic reserves. Energy Sec. Christopher Wright actually did something pretty clever. Rather than like previous administrations simply selling the oil into the market, he swapped it for futures contracts which are at a much lower price than the current price. So essentially, we are selling 172 million barrels of oil and getting back 200 million barrels of oil. What a refreshing approach.)
Inflation to Spike?
That is the term some analysts are using. And while some components will definitely be “spiking,” the term is somewhat subjective. Would a 0.2% increase be considered a spike? Would it need to be 0.5% to justify that term?
January PCE, which is now “ancient” data, came in at slightly over 3%, for the first time in two years. March data is likely to be even higher.
Then again, if a large portion of your expenses are food and energy, you can be forgiven if thinking that inflation is spiking, as your cost will definitely be rising more than a few tenths of a percent.
As I write this Friday the 13th morning, WTI oil is at $93.57. About four years ago it was $118.
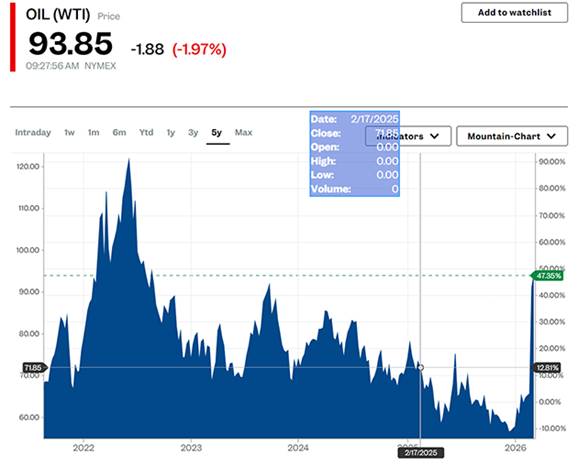
Source: Business Insider
Vanguard published an interesting report this week. Their analyses suggest that although the US and global economies remain resilient, the scale and persistence of energy disruptions raise noteworthy risks for growth, inflation, and central bank decision‑making. Note that the US does relatively much better than Europe and Japan. This chart does give you some idea of the impact on GDP and inflation for each region:
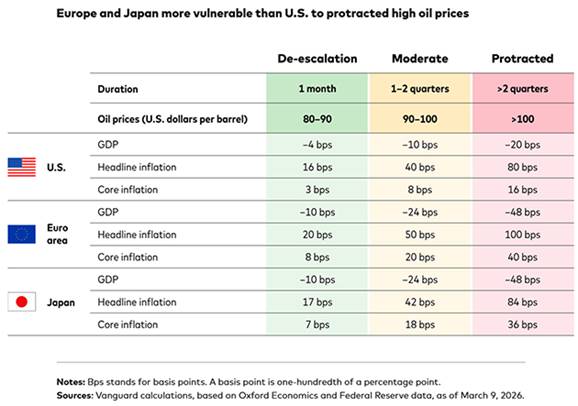
Source: Vanguard
Vanguard takes a relatively optimistic view:
“The U.S. economy is comparatively well-positioned to absorb an energy shock, especially one that is short‑lived. With household balance sheets, labor markets, and corporate fundamentals relatively strong, a de‑escalation of the conflict and a subsequent easing in oil prices could allow markets and economic activity to rebound. In that scenario, tighter financial conditions and weaker sentiment would likely unwind, limiting the risk of lasting damage and enabling a quicker snapback in growth and financial markets.”
The key word in the above paragraph is “comparatively.” We are going to see higher inflation numbers, though to what extent is anybody’s guess.
(This analysis is consistent with what I read elsewhere. Again, this is “guesstimation,” but they have the direction right.)
That Word Transitory Again
In the 70s, Federal Reserve Chairman Arthur Burns kept using the word “transitory” to describe various price increases of different items, allowing him to ignore the overall increase in inflation until it became serious/disastrous.
The war and energy inflation complicates future Fed Chair Kevin Warsh’s life. As we will see, unemployment is getting softer. GDP is not robust. The BEA just reduced its estimate for 4th quarter GDP further downward to 0.7%. That is below what I think of as Muddle Through, and if that continues, is closer to stall speed.
At best they can be seen as a soft Muddle Through. There is going to be a large drumbeat for a rate cut in June, and not just from the White House. Yet inflation will be rising due to energy and food, although somewhat offset by lower housing costs, which are already baked into the cake.
Although I expect that Warsh will not actually use the word transitory, as it is somewhat toxic in Federal Reserve history, he will point out that (hopefully) by then the war is over and oil prices are returning to “normal.”
Let’s remind ourselves that energy price increases have essentially the same effect as a tax increase. They generally reduce GDP. A slowing economy and rising inflation? Can you say stagflation, boys and girls? Sigh…
Thoughts on Unemployment
The February jobs report that came out last week was just awful. February’s loss of 92,000 jobs, 86,000 of them in the private sector, certainly came as a surprise, but it’s a trend that’s been two years in the making, according to Philippa Dunne of the Liscio Report.
“…below is a graph of monthly changes in total and private employment (bars) along with their three-month moving averages (lines). The three-month moving average of employment growth was 152,000 in January 2024—or 103,000 for the private sector alone. The average rose some over the next couple of months, hitting 203,000 in March, or 135,000 for the private sector. (After months of deep federal job losses—333,000 of them since October 2024, which has taken federal employment to the lowest share since monthly stats began in 1939—it may be surprising to look back on a time when private job growth lagged the total.) In February, the three-month moving averages were 6,000 total or 18,000 private. Those represent a decline from the March 2024 peak of 97% and 87% respectively—or 96% and 83% if you want to measure from beginning of this graph in January 2024.”
It would be wrong to describe the decline in the averages as uninterrupted, but it’s been pretty steady for two years. The yearly growth in total employment has fallen from 0.8% in January 2024 to 0.1% in February 2025. For the private sector, the decline has been from 0.6% to 0.3%.
February was bad, but it’s not just one bad month.
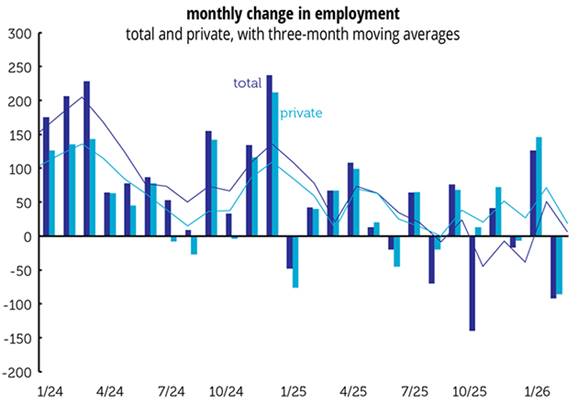
Source: The Liscio Report
The twelve-month average job growth now stands at only 13,000. For perspective, in 2019, the US economy added an average 165,000 jobs per month. That does not portend well for economic growth and consumer spending. Unemployment in the US is 4.4%, up from 3.5% exactly 5 years ago.
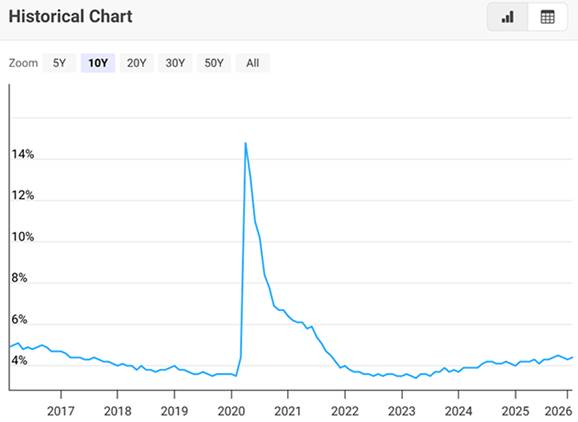
Source: Macrotrends
Historically, 4.4% is relatively low. But that masks several factors. First, we have had 2.5 million people leave the country because of their immigration status. Most were voluntary. And many of those people had jobs? I can find no research on that, but surely a lot of them. If even half of them had jobs, it would add almost 1% to the unemployment rate.
But the bigger issue, one which seems somewhat intractable, if not puzzling to Boomer generations, is the increasing number of men in prime working age not in the labor force. A paper published late last year from the Center for Immigration Studies sheds some light on this. Quoting:
- While the share of US-born, working-age (16 to 64) men not in the labor force has roughly returned to the level before Covid in 2019, it remains historically very high. It was 11.3 percent in April 1960, 16.9 percent in April 2000, and 21.7 percent in April 2025.
- If the same share of US-born men (16 to 64) were in the labor force in 2025 as in 1960, there would be 8.9 million more US-born men in the labor force. Even if the share returned only to the 2000 level, it would still add 4.1 million US-born men to the labor force.
- Even “prime-age” US-born men (25 to 54), the group most likely to work, have experienced a similar deterioration, from 4 percent not in the labor force in April 1960, to 8.5 percent in 2000, and 11.2 percent in April of this year.
If the share of the prime age workers were to return to the 2000 level, it would add roughly three percentage points to the unemployment rate.
Remember, you are listed as not in the labor force if you have not been looking for jobs in the last 30 days. And while many in that group have looked for work at least one time over the last year, it is clear there is a high number of discouraged or not interested in working prime age men.
The numbers are less stark for women, as they have the same relative increase as to the number not in the labor force.
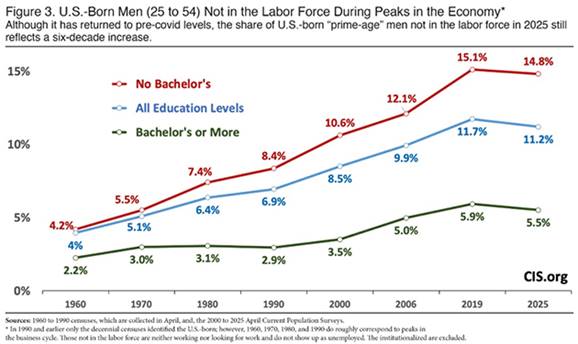
Source: CIS.org
This next chart shows the actual difference in the numbers of workers that would be added if we were to increase the labor participation rate. There are 66.5 million men between 16 and 64 actually working in the labor force. But there are 85 million men in that age group. Yes, many of them are in school or have other situations, but clearly not a majority.
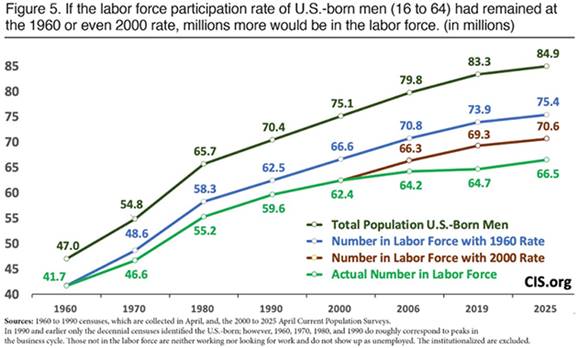
Source: CIS.org
Finally, let’s look at the U-6 unemployment rate. This rate includes total unemployed individuals, those marginally attached to the labor force, and those employed part-time for economic reasons. The rate as of February was 7.9%.
As we can see below, there have certainly been higher U-6 unemployment rate numbers. But it is just another sign that the employment situation is, at a minimum, getting softer.
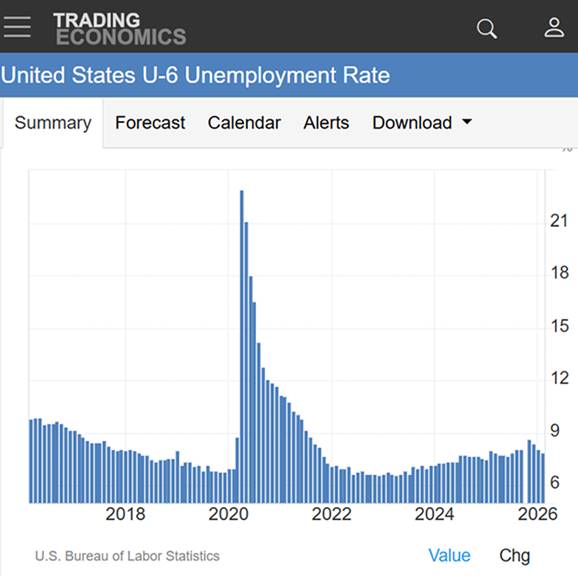
Source: Trading Economics
Bottom line? Between Iran and energy prices, an increase in inflation for at least one quarter, a slowing GDP, and increasing unemployment, the economy is likely to be softer. Offsetting that is strong earnings growth (so far), better manufacturing numbers, low unemployment claims, and increased consumer spending, at least among the higher income portion of the economy.
This is not a recession. It is simply Muddle Through, subpar growth. We have been here before. Stay tuned…
El Segundo, West Palm Beach, New York, DC?, and Boston
I will fly to El Segundo, California, the last week of March to be with the Inner Circle. In addition to regular meetings, we will be visiting multiple local technology startups. El Segundo has become a hotbed for all sorts of cutting-edge technology startups.
Then in the middle of April, I will be going to a very large longevity conference in West Palm Beach, and hopefully help inaugurate the opening of our Lifespan Edge clinic in West Palm Beach as well.
Then I will fly directly to either DC or New York for a series of dinners and meetings. Then the SIC starts in early May, and I have no trips actually scheduled until Boston in early June. That will likely change.
In 2018, Shane and I moved to Puerto Rico and settled in Dorado Beach. We moved for the taxes but should have moved for the lifestyle. Fabulous weather, wonderful neighbors, a great and active community with all sorts of amenities. For the right people, Puerto Rico is a wonderful option.
But travel back and forth from Puerto Rico does add a lot to travel times compared to living in Dallas. Getting to the West Coast is a 14-hour day there and back. On the other hand, New York is just four hours and there are numerous flights up and down the East Coast. Then again, a small price to pay for living in paradise.
And with that, I will hit the send button. You have a great week!
Your definitely (and too much) in the labor force analyst,


John Mauldin
Co-Founder, Mauldin Economics
About the author
