
China and Japan are by far the largest buyers of US Treasuries. According to Statista, using data compiled by the US Federal Reserve and the Treasury Department, as of September 2021, foreign countries held $7.55 trillion in US Treasury securities. Of this total, Japan owned $1.3 trillion and China owned $1.05 trillion. After the United Kingdom’s $566.5 billion, it should come as no surprise that the next four countries on Statista’s list are tax havens. In descending order, we have Luxembourg, Ireland, Switzerland and the Cayman Islands.
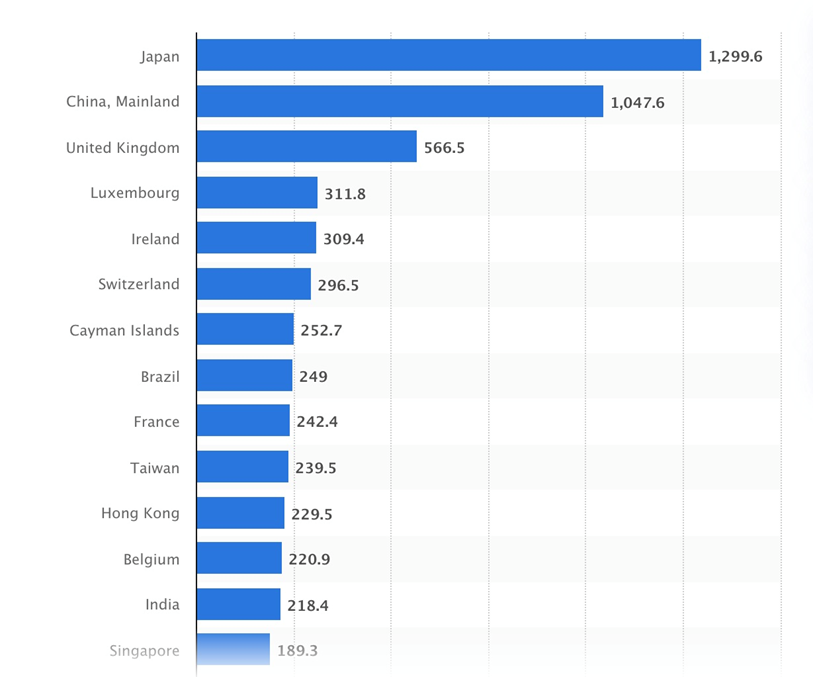 Major holders of US Treasuries, as of September 2021. Source: Statista
Ever since the US dollar became the reserve currency in 1944, a decision made by the Bretton Woods delegation of 44 Allied countries, long-term US bonds, like the 30-year and the 10-year, have been held in high esteem by foreign governments, corporations and individuals.
In July 1944, as Allied troops were racing across Normandy to liberate Paris, delegates from 44 nations met at Bretton Woods, New Hampshire and agreed to “peg” their currencies to the US dollar, the only currency strong enough to meet the rising demands for international currency transactions.
“At the closing banquet, the assembled delegates rose and sang “For He’s a Jolly Good Fellow.” The fellow in question was John Maynard Keynes, leader of the British delegation and intellectual inspiration of the Bretton Woods design.” Robert Kuttner, Bretton Woods Revisited
What made the dollar so attractive to use as an international currency, the world’s reserve currency, was each US dollar was based on 1/35th of an ounce of gold (35.20 US dollars an ounce), and the gold was to be held in the US Treasury.
There’s a lesson not learned that reverberates throughout monetary history: when government, any government, comes under financial pressure they cannot resist printing money and debasing their currency to pay for debts.
An AOTH analysis has found a leveling off of foreign purchases of US Treasury bonds and notes. Instead of foreigners buying T-bills, it is increasingly Americans, including consumers, banks and the biggest buyer of them all, the US Federal Reserve.
This has major implications for the United States, the US dollar and its status as the world’s reserve currency, as well as gold prices, which we found have closely tracked a significant increase in the money supply.
Foreign bond investment refers to net purchases of US Treasuries by foreign individuals or companies. Negative figures in the chart below indicate net sales by foreigners to US residents or a net outflow of capital from the United States.
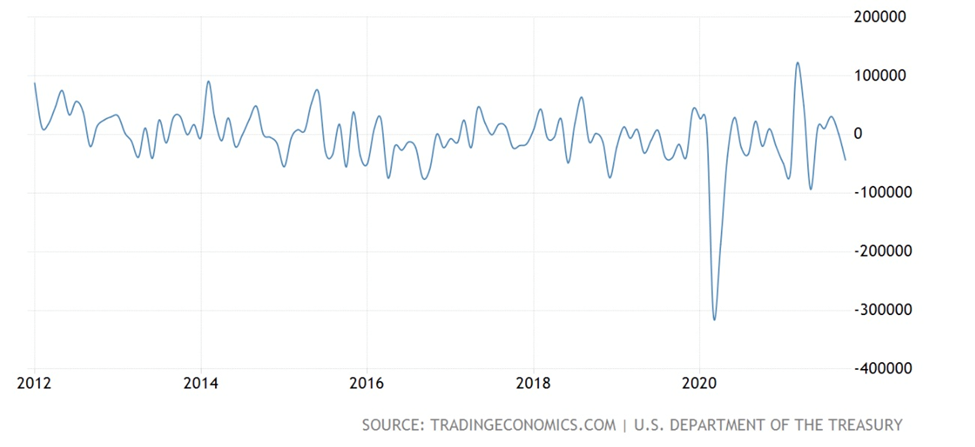 United States Net Purchases of US Treasury Bonds and Notes, 10-year chart
The blue line is shown dipping below zero after rising to US$9,600 million in November 2020, indicating there is currently not a lot of foreign support for US debt purchases. (purchases and sales of US Treasuries are canceling each other out, resulting in net zero)
Notice the dramatic plunge downward in early 2020, associated with the onset of the coronavirus pandemic and the ensuing financial panic.
Looking at a one-year chart, while net purchases rose the most in March 2021 (the chart only goes to October), the trend is down, so we expect there to be an even greater drop-off when the next set of data is released.
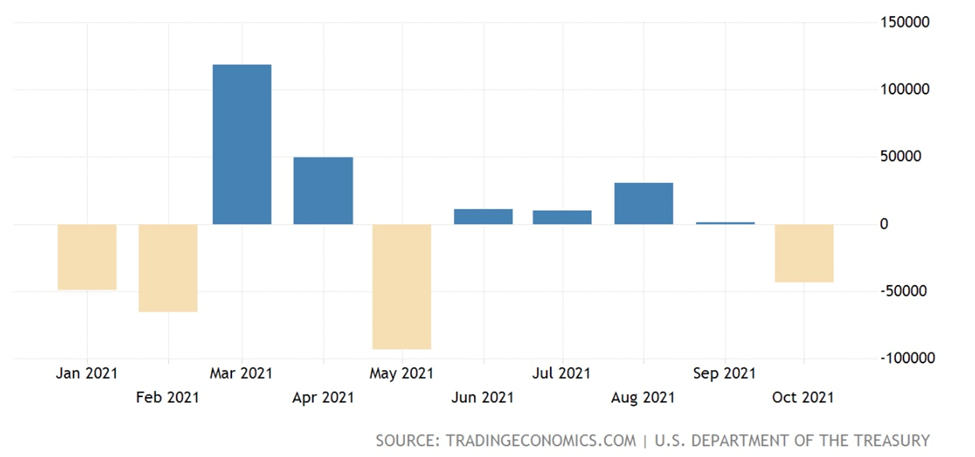 United States Net Purchases of US Treasury Bonds and Notes,
1-year chart
The table below, by the US Treasury Department, is the result of a survey measuring the value of US portfolio holdings of foreign securities at year-end 2020 compared to Dec. 31, 2019. It indicates the amount of US securities foreigners held, broken into equities, long-term debt and short-term debt.
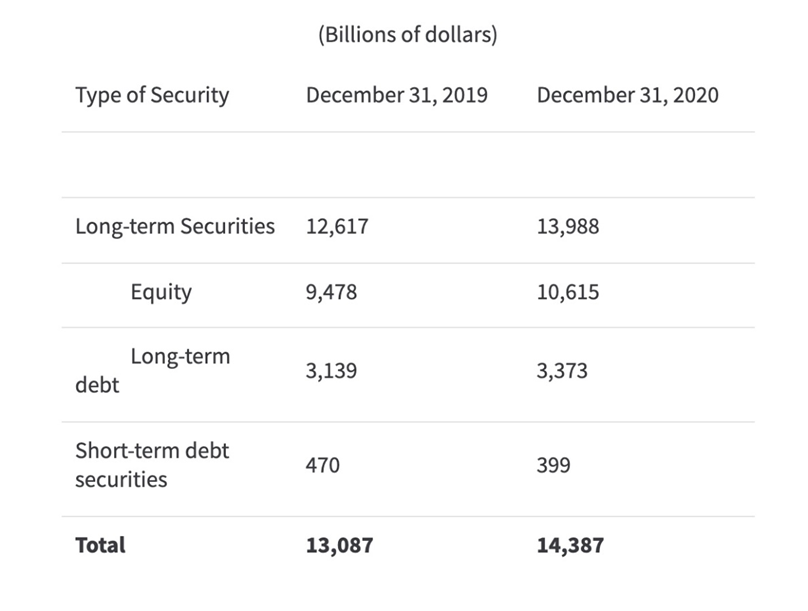 US holdings of foreign securities. Source: US Treasury Department
The end of 2019 shows $9.5 trillion in foreign equities, $3.1 trillion in long-term bonds and $0.5 trillion in short-term bonds. This compares to $10.6 in equities, $3.4T in long-term debt and $0.4T in short-term debt at the end of 2020.
Foreign investors are getting out of short-term debt securities, dumping about $100 billion worth, and adding to their long-term debt, by about $300 billion.
This makes sense given the higher yields of long-term bonds, compared to short-term (1-year and less) and it also makes sense for foreign investors to have shifted some of their short-term and long-term bond holdings to equities. They saw the Fed is propping up the stock market, so why not take their chances on stocks versus low-interest bonds, particularly tech stocks which were popular in 2020.
De-dollarization
With US Treasuries offering such pitiful yields (the best right now (Jan. 10) would be the 20-year at 2.15%, short-term rates are much lower), it’s no wonder the major buyers are giving Treasuries a pass. Factor in current US inflation (CPI) of 6.8%, which is at a 30-year high, and all of those bonds and notes are money-losing ventures. The 20 year would have a negative real interest rate of -4.65%.
Increasing geopolitical and trade tensions between the US and its adversaries is another reason for lower bond purchases.
In 2021, China trimmed its holdings of US Treasury bonds for four straight months, in what analysts called a move to prevent potential adverse impact from escalating China-US tensions. Data from the US Treasury Department found China’s Treasury holdings fell to $1.062 trillion last June, down $16.5 billion from May. Holdings were down $10.4 billion in the second quarter.
Meanwhile Japanese funds sold a record $34 billion in the two weeks ended Feb. 26, just before the country’s fiscal year-end last March. Official US data showed Japanese investors sold a net $17.8 billion of Treasury bonds in 2020.
Last August the country’s largest pension fund reduced its holdings of American government bills and bonds from 47% to about 35% of its total foreign assets, in the 12-month period leading to March 30, 2021. The extra weight was shifted into holdings of various European sovereign bonds, according to The Deep Dive.
“De-dollarization” is being pursued by countries with agendas increasingly at odds with the US, including China, Russia and Iran.
As the target of US sanctions, Russia sees diversification from the dollar and into gold and other currencies, as a way of skirting trade restrictions.
Russia and China have been cozying up in a number of ways over the past few years. In 2014 Russian state-owned Gazprom signed an eye-popping $456 billion gas deal with China. The year previously, Rosneft agreed to double oil supplies to China in a deal valued at $270 billion, and in 2009 Russian oil giant Rosneft secured a $25 billion oil swap agreement with Beijing.
2014 was also the year that China really started to move away from the dollar. China agreed with Brazil on a $29 billion currency swap in an effort to promote the Chinese yuan as a reserve currency, and the Chinese and Russian central banks signed an agreement on yuan-ruble swaps to double trade between the two countries. The $150 billion deal, one of 38 accords inked in Moscow, is a way for Russia to move away from U.S. dollar-dominated settlements.
A few years ago China came up with a new crude oil futures contract, priced in yuan and convertible into gold. The Shanghai-based contract allows oil exporters like Russia and Iran to dodge US sanctions against them by trading oil in yuan rather than US dollars.
The latest evidence of Chinese and Russian de-dollarization concerns the SWIFT system of international banking transactions.
In 2014 after Russia annexed Ukraine’s Crimean peninsula, there were calls to cut Russia off from SWIFT. In response the Kremlin developed its own financial communications platform known as SPFS. As of the end of 2020, SPFS had over 400 member banks and handled 20% of all domestic financial communications.
China is also developing an alternative to SWIFT, in 2015 launching the Cross-Border Interbank Payment System (CPS) to help internationalize the use of its yuan currency.
United States Money Supply
Just because foreign entities aren’t buying Treasuries, doesn’t mean they are going begging. Short and long-term T-bills and notes and being soaked up by Americans themselves, mostly banks and the US central bank, aka the Fed.
A 25-year read-out of M0 United States Money Supply, shows supply basically unchanged from 2000 to 2008, when it starts rising in line with the first three rounds of quantitative easing. The Fed started printing money to counter-act the recessionary effects of the financial crisis of 2008-09.
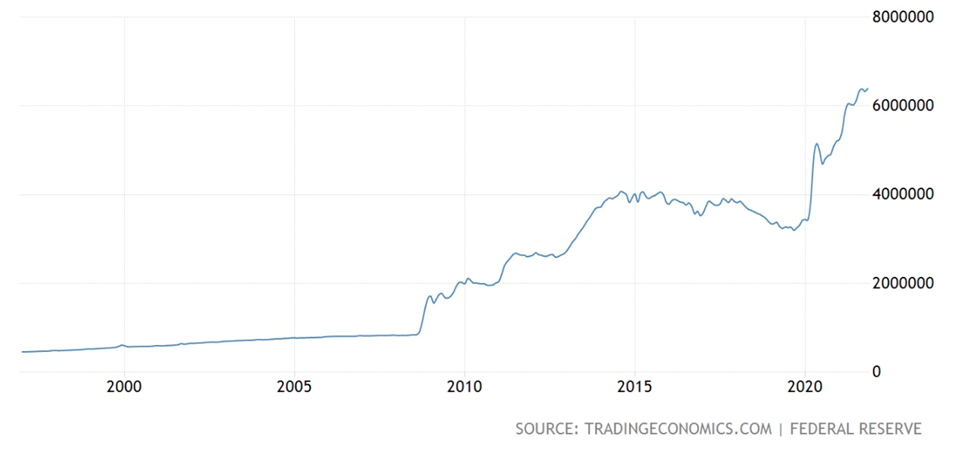 M0 United States Money Supply, 25-year chart
Similar patterns are observed in M1 and M2. Note the 2020 spike in M1 Money Supply, in about one year quadrupling from $5 trillion to over $20 trillion. The M2 Money Supply rises much more gradually, taking about 20 years to quadruple.
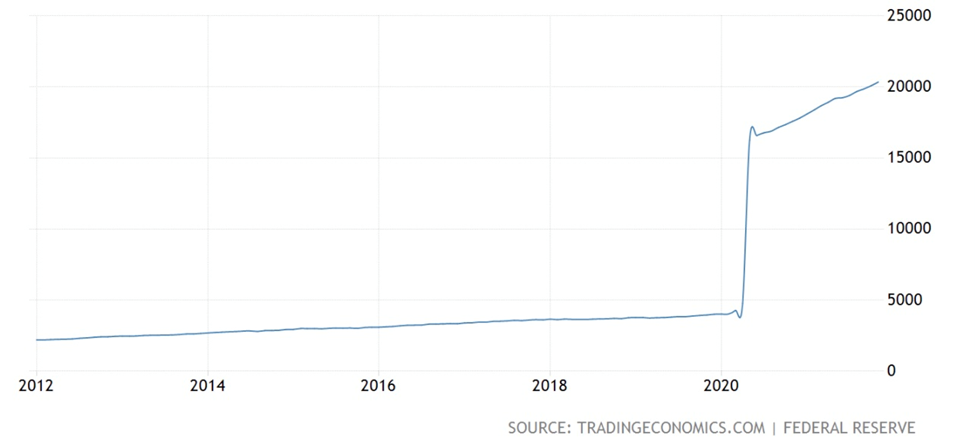 M1 United States Money Supply, 10-year chart
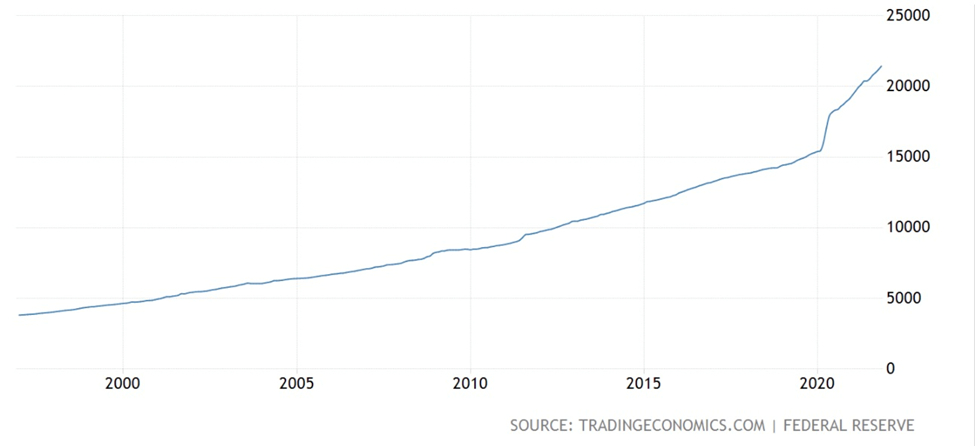 M2 United States Money Supply, 25-year chart
US Banks Balance Sheet
The United States Banks Balance Sheet is a weekly report that lists the banks’ assets and liabilities.
Between 2008 and mid-2014 the Fed increased its balance sheet from $800 billion to $4.5 trillion, thus helping to recapitalize banks that were in danger of going bankrupt, and restoring confidence in the economy.
But most of the new money never made its way into the economy; it stayed within the banks and much of it wasn’t leant out. This is why inflation wasn’t a feature of the first three rounds of QE, even though it was predicted.
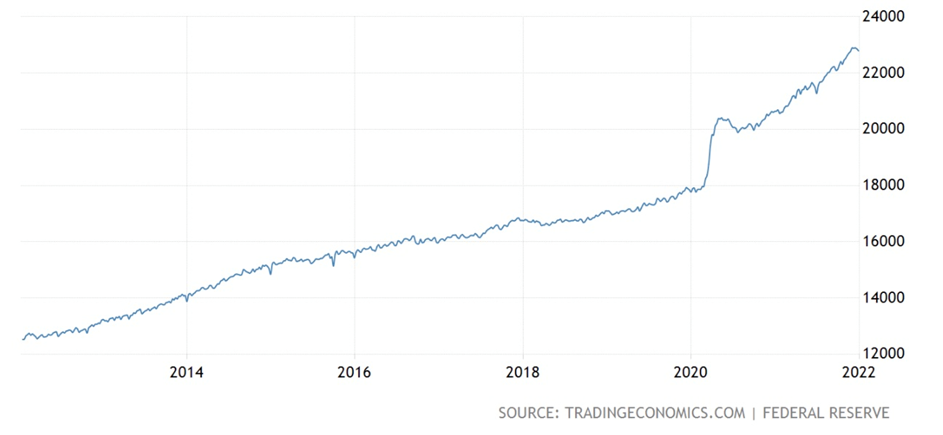 US Banks Balance Sheet, 10-year chart
In 2014, the total balance sheet of US banks amounted to $14 trillion. Four rounds of quantitative easing later, the banks now have about $23 trillion on the books.
Central Bank Balance Sheet
The Central Bank Balance Sheet also reads like a map of quantitative easing.
Up to 2008 nothing much happened, it bumped along at around $1 trillion. The Fed’s four QE programs have added about $7 trillion to its balance sheet, which now sits at over $8T.
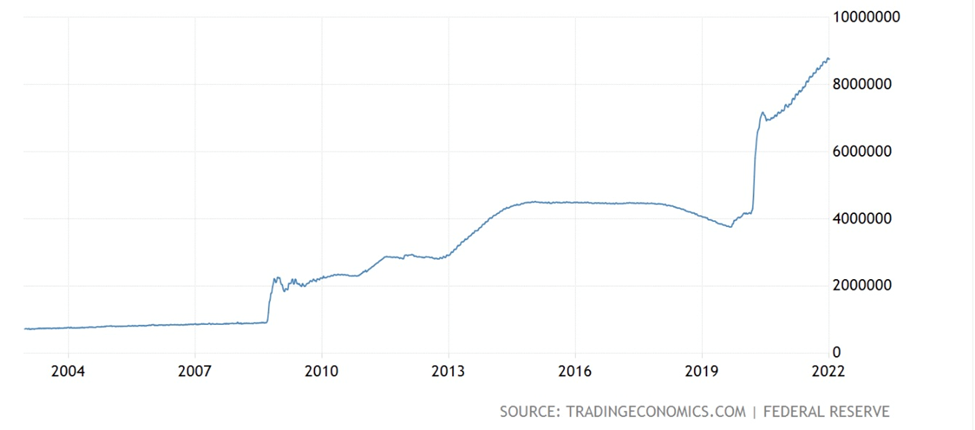 Central Bank Balance Sheet, 25-year chart
United States Private Debt to GDP
Foreign interest in supporting US public debt has fallen off a cliff, it’s basically net zero, so now it is up to the banks, the Fed, and consumers, through their 401K retirement plans, to purchase the regular offerings of US government bonds — which the federal government relies on to finance its deficits.
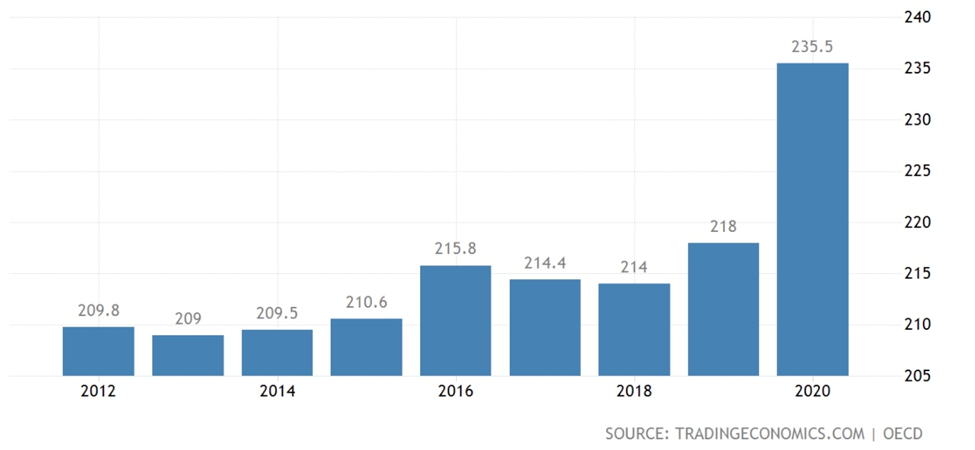 United States Private Debt to GDP, 10-year chart
As the banks continue to sop up US Treasuries, corporations and individuals are eagerly taking out loans, spurred on by near-zero interest rates. In the above chart we see a combination of corporate and household debt climbing from 209% in 2012 to 235% in 2020.
According to the Federal Reserve and the Securities Industry and Financial Markets Association (SIFA), US companies now face the highest debt levels on record, at more than $10.5 trillion. In 40 years the amount of corporate bonds outstanding has grown by over 2,000%, from 16% of US GDP in 1980, to 50% of GDP in 2020.
Forbes notes the level of corporate debt is actually much higher because the above-mentioned figures only include fixed income debt, not loans and lines of credit.
These debt levels were massive even before the coronavirus (about $9 trillion), with rock-bottom interest rates left over from the financial crisis making it very easy for corporations to borrow money.
In the United States, consumer spending makes up nearly 70% of GDP, meaning the ability of households to spend, and to handle debt burdens, is of utmost importance. Globally the figure is similar.
Household debt jumped the most in 14 years in the second quarter of 2021. Though mostly driven by the housing market, credit card debt is reportedly back on the rise.
A Federal Reserve report found that credit card balances rose 11% from April to May, the largest increase in five years. On Aug. 4, the Fed reported the highest second-quarter jump in household debt in 14 years, to nearly $15 trillion.
As the graph below shows, US household debt to GDP had actually been falling steadily for the past decade. The pandemic reversed the trend, and it now sits at about 79% of GDP, compared to 75% pre-covid.
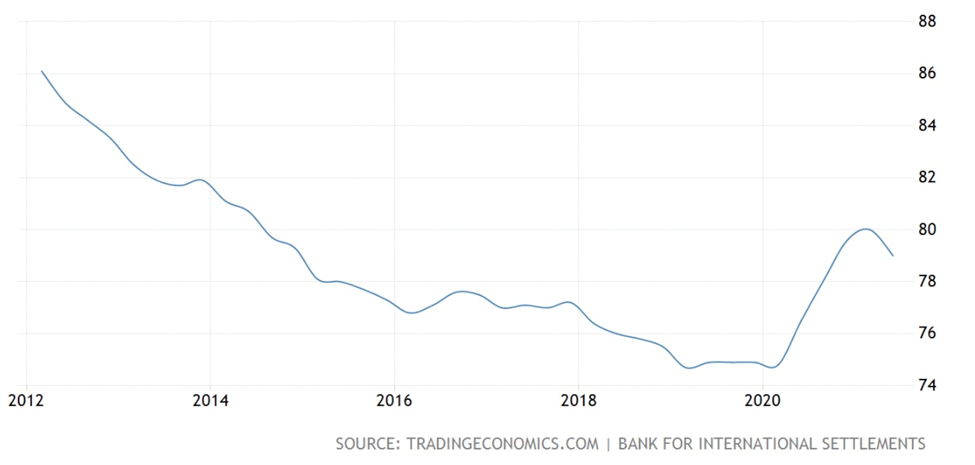 United States Households Debt to GDP
30-year Gold Price
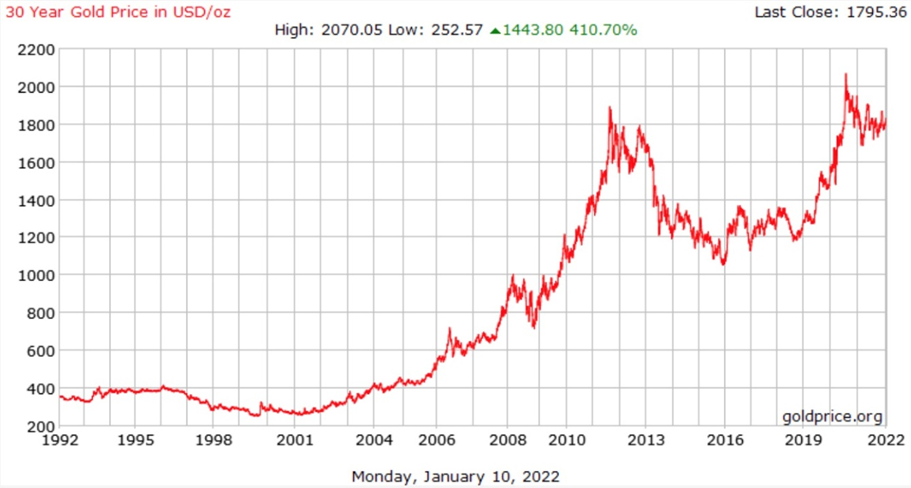 30-year spot gold price. Source: Goldprice.org
The 30-year gold price more or less tells the story of QE, money-printing and the sky-high Fed balance sheet.
Spot gold starts to climb around 2002, edging its way up to around $700 in 2006, shows some volatility in 2008-09, during the Great Recession, then arcs sharply higher until September 2011, when it hit a then-record $1,900 an ounce.
Of course it’s no coincidence that this period corresponds to both falling interest rates and increasing M0 Money Supply, which rose with the Fed’s first three QE programs, 2008-15, went down between 2015 and 2020, as the Fed reduced its balance sheet, then turned back up in 2020 when QE4 began.
The answer to the question, “Why has gold gone up”, is right there in the charts: money-printing.
Conclusion
What I’ve tried to prove in this article is the growing disinterest of foreign investors in buying US Treasury debt; with US banks, the Fed and consumers left holding the bag for the federal government’s continued issuance of debt.
The Fed can telegraph/ jawbone its intentions all it wants, regarding raising rates, the fact remains that at such unsustainably high debt levels, the interest payments will eventually cripple the federal government, corporations, and 70% of economic activity – consumers.
If the trend of foreign investors slowing their buying of US debt continues
Americans will have to increase buying their own debt.
Considering their current debt levels, corporations and consumers are increasingly going to be unable to meet that burden. Meaning money-printing, bond-buying, low interest rates and high levels of inflation will continue, in perpetuity.
Causing, imo, precious metals to soar
Richard (Rick) Mills
aheadoftheherd.com
Legal Notice / Disclaimer
Ahead of the Herd newsletter, aheadoftheherd.com, hereafter known as AOTH.
Please read the entire Disclaimer carefully before you use this website or read the newsletter. If you do not agree to all the AOTH/Richard Mills Disclaimer, do not access/read this website/newsletter/article, or any of its pages. By reading/using this AOTH/Richard Mills website/newsletter/article, and whether you actually read this Disclaimer, you are deemed to have accepted it.
Any AOTH/Richard Mills document is not, and should not be, construed as an offer to sell or the solicitation of an offer to purchase or subscribe for any investment.
AOTH/Richard Mills has based this document on information obtained from sources he believes to be reliable, but which has not been independently verified.
AOTH/Richard Mills makes no guarantee, representation or warranty and accepts no responsibility or liability as to its accuracy or completeness.
Expressions of opinion are those of AOTH/Richard Mills only and are subject to change without notice.
AOTH/Richard Mills assumes no warranty, liability or guarantee for the current relevance, correctness or completeness of any information provided within this Report and will not be held liable for the consequence of reliance upon any opinion or statement contained herein or any omission.
Furthermore, AOTH/Richard Mills assumes no liability for any direct or indirect loss or damage for lost profit, which you may incur as a result of the use and existence of the information provided within this AOTH/Richard Mills Report.
You agree that by reading AOTH/Richard Mills articles, you are acting at your OWN RISK. In no event should AOTH/Richard Mills liable for any direct or indirect trading losses caused by any information contained in AOTH/Richard Mills articles. Information in AOTH/Richard Mills articles is not an offer to sell or a solicitation of an offer to buy any security. AOTH/Richard Mills is not suggesting the transacting of any financial instruments.
Our publications are not a recommendation to buy or sell a security – no information posted on this site is to be considered investment advice or a recommendation to do anything involving finance or money aside from performing your own due diligence and consulting with your personal registered broker/financial advisor.
AOTH/Richard Mills recommends that before investing in any securities, you consult with a professional financial planner or advisor, and that you should conduct a complete and independent investigation before investing in any security after prudent consideration of all pertinent risks. Ahead of the Herd is not a registered broker, dealer, analyst, or advisor. We hold no investment licenses and may not sell, offer to sell, or offer to buy any security.
About the author

Richard (Rick) Mills

Legal Notice / Disclaimer
Ahead of the Herd newsletter, aheadoftheherd.com, hereafter known as AOTH.
Please read the entire Disclaimer carefully before you use this website or read the newsletter. If you do not agree to all the AOTH/Richard Mills Disclaimer, do not access/read this website/newsletter/article, or any of its pages. By reading/using this AOTH/Richard Mills website/newsletter/article, and whether or not you actually read this Disclaimer, you are deemed to have accepted it.
Any AOTH/Richard Mills document is not, and should not be, construed as an offer to sell or the solicitation of an offer to purchase or subscribe for any investment.