
Point: One of the long-standing trading tenants of “The Smart Alec Dept.” is to “buy the rumour” and then “sell the news”. We thus present the quintessential example of such grip n’ trip treatment: Gold.
Gold entered this past week garnering +19 points of fresh premium as COMEX contract volume moved from June into August. But wait, there’s more. For as the week unfolded came the fevoured anticipation for Congressional passage of the StateSide DDD (“Debt Default Deal”): a raising of the debt ceiling by $4T! But where’s the dough to make it so? “Hello Jay? Janet. Joey just signed it. Let’s do it!” Thus it can’t get any better for Gold, right? And indeed through the “rumour” stint, Gold gripped for +51 points. But upon the Congressional approval “news”, Gold then tripped -36 points.
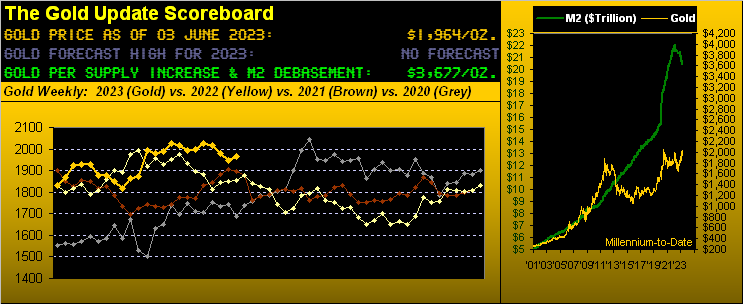
In sum, by “front month” measuring, Gold’s settling the week yesterday (Friday) at 1964 marked a weekly gain of +18 points, whereas spot itself gained but +1 point. Either way, ’twas a “nothing week” for Gold, which given the approval of the DDD ought rightly have sent the yellow metal to the moon.
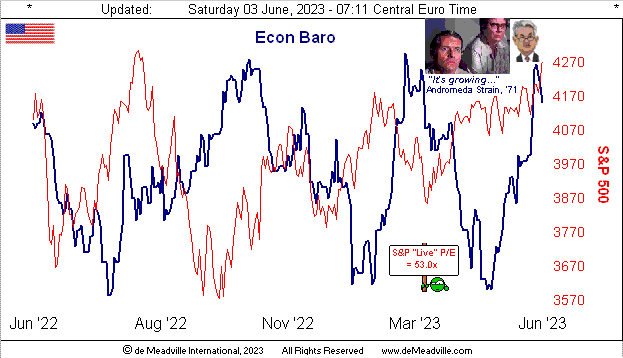
Counterpoint: As we tweeted earlier in the week, ’tis instead the Economic Barometer that’s been moon-bound, doubtless meaning the Federal Reserve (as herein penned a week ago) “…shall keep [its] foot on the rate raise throttle…” Why, even the brilliant Bloomy brains figured this out following May’s robust Payrolls report on Friday by printing “Yields rise as traders bet on one Fed hike by July.” Talk about foresight: the Federal Open Market Committee is only scheduled to issue one Policy Statement prior to July (in adding +0.25% to the FedFundsRate on 14 June). Impressive FinMedia insight there. Regardless, make no mistake by the Baro’s take, for even as FinParrots say the economy’s slowing, instead by math ’tis visually growing:
And as “grows” the economy — certainly aided and abetted by inflation — so grows the FedFundsRate, and in turn the Almighty Dollar, its Index of which from low-to-high across the past five weeks is +4.1% toward returning to nearly a three month high (today 104.000; March’s high 105.870). Whilst most broadly Gold plays no currency favourites, the short (sighted)- term conventional wisdom crowd dumps the yellow metal (or shorts it, as really very few actually own it) in championing the Dollar and its attendant yield. Indeed the ridiculously-overvalued S&P 500 yields but a wee 1.613% versus the U.S. 3-month T-Bill’s 5.215% — and “Old Yeller” can now rest assured that she can pay the requisite interest,(until…) Note too: “always first” Fitch is nonetheless maintaining their “negative credit watch” on the U.S.A., but keeping the “AAA” rating (until…)
Of note as well from the “Afraid to Know the Truth Dept.” you’ll see in the above Econ Baro graphic the wee one with the sign displaying the honestly calculated “live” price/earnings ratio of the S&P 500 as 53.0x; (the current miscalculated parroted version is 24.8x). We point this out with respect to yield. The long-standing back-of-the-napkin calculation of yield is to invert the P/E. Using the parroted 24.8x, the implied yield for the S&P is thus 4.032% — whereas in reality ’tis but the aforementioned 1.613% — which is far closer to the inverted 53.0x yield of 1.887%. Just in case you’re scoring at home, as “tick-tick-tick goes the clock-clock-clock…”
Meanwhile, ticking lower are the red dots of Gold’s fresh weekly parabolic Short trend, now two weeks in length:
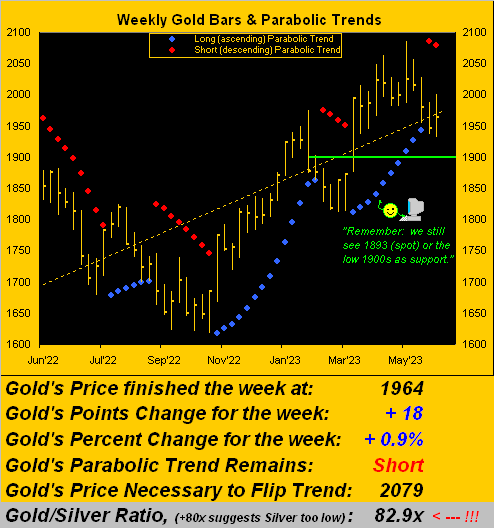
However, therein we see the prior Short trend lasted but four weeks (17 Feb to 17 Mar). And whilst historically such Short trends suggest Gold revisiting the 1800s during this stint (as graphically herein detailed a week ago), wouldn’t it be lovely to have the present Short trend short-lived? “Got Gold?”
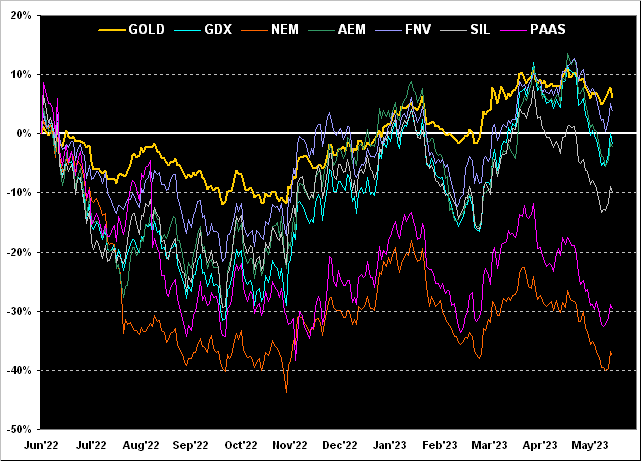
The still rare breed of investor that does “have” Gold goes for its leverage afforded via precious metals equities. This being our “month-end” edition of the Gold Update (plus two days of June for which to attune), below we’ve the following year-over-year percentage tracks with Gold +6% itself leading the pack, pursued by Franco-Nevada (FNV) +4%, both the VanEck Vectors Gold Miners exchange-traded fund (GDX) and Agnico Eagle Mines (AEM) -2%, the Global X Silver Miners exchange-traded fund (SIL) -10%, Pan American Silver (PAAS) -30%, and S&P 500 constituent Newmont (NEM) -37%. Using this date from a year ago as a starting point — given Gold’s positive track — the balance of this bunch ought all be far higher still!
“Yet it depends from where you start, right mmb?”
Indeed so, Squire. For example: if measuring from the precious metals’ price depths of year-end 2015, Gold today is +85%, but GDX (as a surrogate for many miners both Gold and Silver) is +129% … and arguably some say it ought be far more. More toward “The Now”, here’s the graphic:
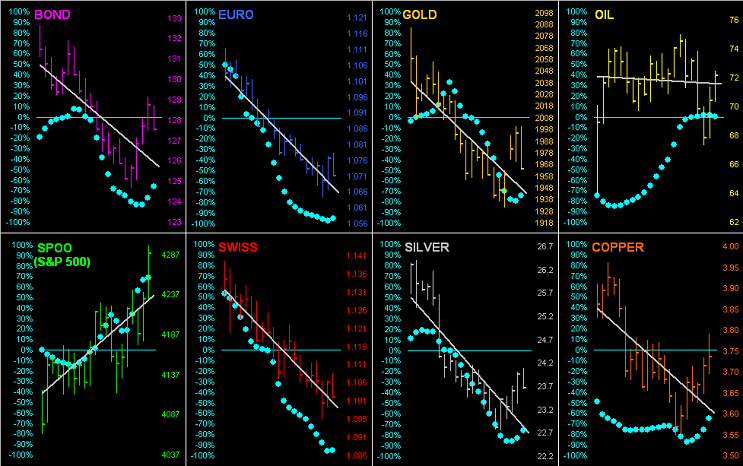
It essentially being month-end, let’s open up the BEGOS Markets’ gates as we go ’round the horn for all eight components by their daily bars from one month ago-to-date. As shown, save for the senseless S&P (Spoo), the balance of the diagonal trendlines are down given the firming Dollar![]() “phenomenon do-do-do-doooo…”
“phenomenon do-do-do-doooo…”![]() . And as you regular website viewers know, the baby blue dots represent the day-to-day consistency of each component’s grey trendline. So notably mind the “Baby Blues” for both Gold and Silver as they’re just starting to curl upward:
. And as you regular website viewers know, the baby blue dots represent the day-to-day consistency of each component’s grey trendline. So notably mind the “Baby Blues” for both Gold and Silver as they’re just starting to curl upward:
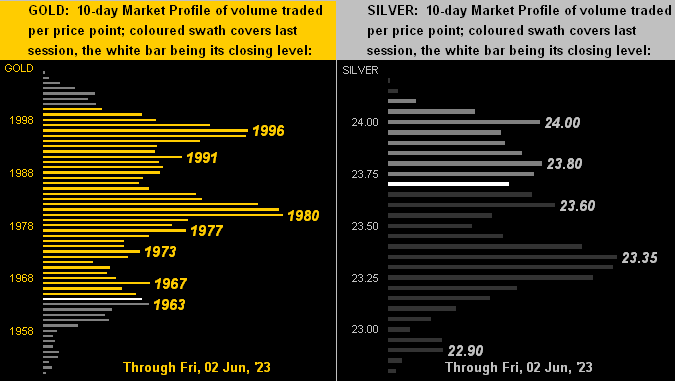
Specific to the 10-day Market Profiles for the precious metals, here next we’ve that for Gold on the left and for Silver on the right. Obviously Gold has much more overhead trading resistance with which to deal, whereas Silver exhibits more of a 23s safety net. ‘Course, per the aforeshown Gold/Silver ratio of 82.9x versus the millennium-to-date average of 67.5x, Sister Silver remains cheap!
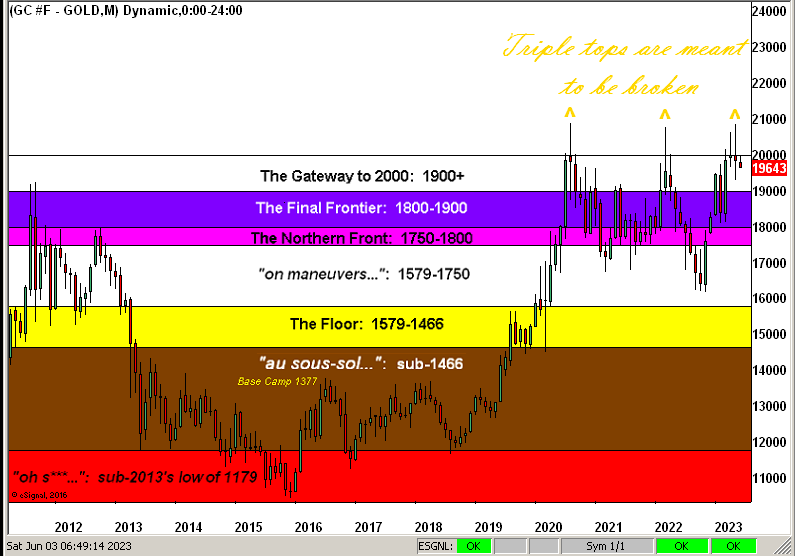
Then broadly in looking at Gold’s Structure by its monthly bars across the last dozen or so years — all those stratified layers notwithstanding — that rightmost triple top remains ripe for the taking:
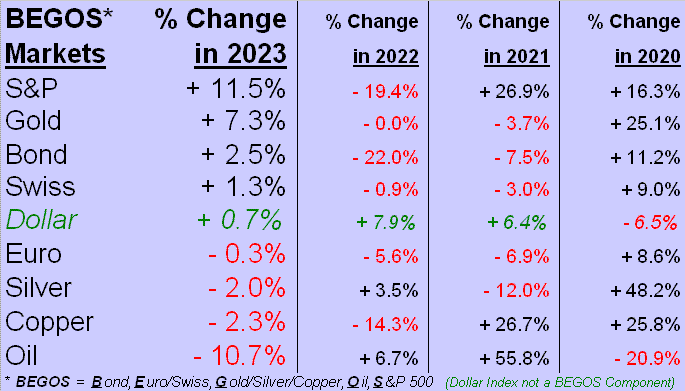
Toward closing, ‘twouldn’t be month-end without listing the BEGOS Markets’ Standings from year-end 2022 through this 03 June. Note that Gold has been displaced at the top of the stack by none other than the S&P 500, aka “The Magic Earnings-less Index”. As stated in the past: “‘Tis diabolical”:
Which in turn leads us to this wrap.
We’ve oft referred to the current monetary climate as The Investing Age of Stoopid. So bizarre has it become that we are seeing headlines which a generation ago would have been regarded as completely irrational, (and obviously never would have made the front, if any, newspaper page). Nonetheless, the once quite useful WSJ just ran above Friday’s fold with “Robust Labor Market Poses Threat to Stocks’ Rally” –> What? Shouldn’t a robust labor market encourage a stocks’ rally? But then we forget. In this New Age of piling into earnings-less stocks, valuation has no bearing to price. Rather the Fed has become EVERYTHING, even as FinMedia guidance to the Fed’s “next move” is useless as it changes from week-to-week: “They’re gonna pivot; no wait, they’re gonna pause; no wait, they’re gonna raise, but only once and then they’re gonna pause…” Good grief: for the bazillionth time, this is why we do the math. (To which point, see last week’s missive as regards the Fed-favoured Core PCE inflation gauge). And by doing the math, we know that to expect.
And most broadly, yes, Gold shall eventually go to the moon! So either get in, or get off the gantry!

Cheers!
…m…
www.TheGoldUpdate.com
www.deMeadville.com
and now on Twitter: @deMeadvillePro
deMeadville. Copyright Ⓒ 2010 - 2023. All Rights Reserved.
About the author
