
Gold had its worst week since March, falling some 4.6 percent from the previous Friday, as the U.S. dollar staged a rally against the euro. The price of bullion closed below $1,900 an ounce last Wednesday for the first time since July 23 and is now down about 10 percent from its high of $2,075, putting it in correction territory.
I’ve already seen numerous headlines questioning whether this is the end of the gold rally. Hardly. Corrections such as this are normal and healthy. They’re a part of gold’s DNA of volatility. During the monster rally of the 2000s that culminated in gold hitting its previous record high of $1,900, there were several significant pullbacks, some of them exceeding 20 percent.
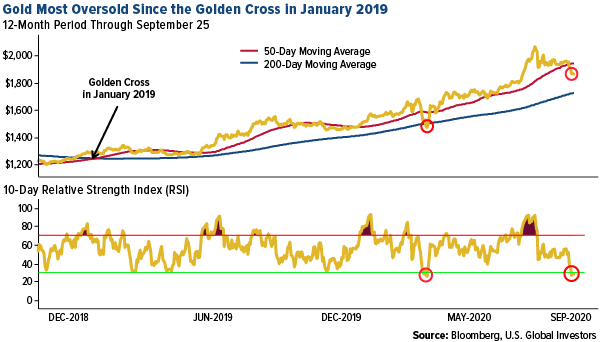
Take a look below. Gold is now more oversold on the short-term, 10-day relative strength index (RSI) than at any other time since the golden cross took place in January 2019. The last time the precious metal was this oversold, in mid-March, gold fell below not just its 50-day moving average but also its 200-day average. We’re not quite there yet—gold is trading below its 50-day but still well above the 200-day—but had you bought the March dip, you would have seen your position increase 40 percent over the next five months.
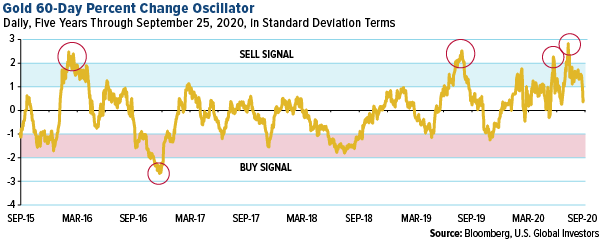
Looking at a longer-term period, gold doesn’t yet appear to be oversold. The oscillator chart below is based on the daily gold price over a rolling 60-day period, which is equivalent to a three-month quarter. As you can see, gold has recently fallen out of overbought territory and is returning to its five-year mean, or average price. It’s important to remember that for the 60-day period, a move of one standard deviation is equivalent to 10 percent. In other words, the price of gold needs to change by 10 percent to record a move of one standard deviation.
Biggest One-Day Inflows into Gold-Backed ETFs
With real rates still negative (and likely to remain that way for some time longer), and unprecedented money-printing threatening to heat up inflation, I believe it only makes sense to buy the dips at this time.
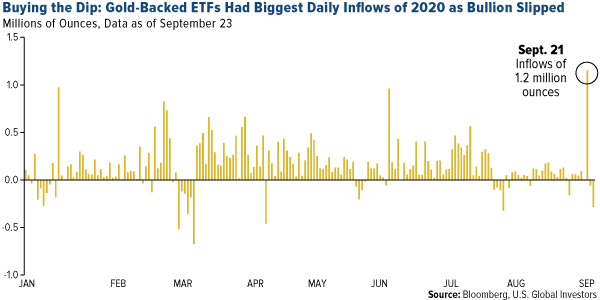
That’s exactly what many investors did last week. On Monday, when the yellow metal fell nearly 2 percent, investors added 1.2 million ounces to ETFs backed by physical gold. That was the most for a single day in 2020.
Randy Smallwood: Precious Metals in “Golden Times”
Gold and silver are in “golden times” right now, according to Wheaton Precious Metals’ president and CEO Randy Smallwood during an online Denver Gold event last week. The “helicopter money” from governments will continue to be highly supported of prices.
Randy is also optimistic base metals, saying they are likely to be the bulk of streaming deal opportunities going forward. “It’s of good to see money going to the ground in the base-metals space,” he commented.
Wheaton Precious is planning to list on the London Stock Exchange by year end, which will put the $23 billion streaming company on the radar of United Kingdom investors who are seeking to gain equity exposure to precious metals. Wheaton currently trades in Toronto and New York.
I believe this is a well-timed decision on the part of Randy, who was named the new chair of the World Gold Council (WGC) earlier this month. According to Edison Investment Research, precious metal companies listed in London “have tended to outperform their peers, with 52 percent of London-listed companies outperforming the gold price over the period of the worst depredations of the coronavirus so far this year, compared with 39 percent globally.”
Further, Wheaton Precious “will provide premium-quality, geared exposure to precious metals prices and fill a void for investors left by the departure of Randgold Resources in December 2018 after it was acquired by Barrick,” analyst Charles Gibson wrote in a note dated September 22.
As you know, Wheaton is one of our favorite mining stocks. At present it pays out 30 percent of its cash flow in dividends, but this could rise to between 40 percent and 50 percent with higher metal prices, Randy says.
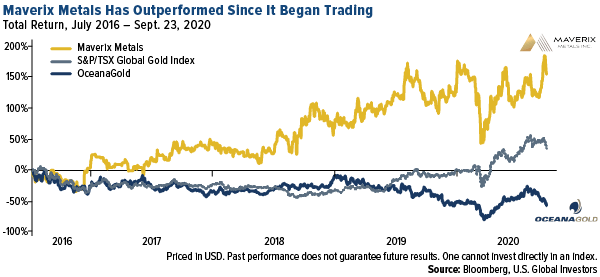
Maverix Metals: A Rising Star in the Streaming Space
Another royalty and streaming company we have our eyes on is Maverix Metals, formed in 2016 after the company acquired a package of assets from Pan American Silver. Last week, Maverix entered into a binding purchase and sale agreement to buy a portfolio of 11 royalties from Newmont, including the Camino Rojo gold and silver project in Mexico.
The transaction, according to a note by Raymond James, “provides Maverix with potential near-term gold equivalent ounce and cash flow growth from five development assets in the Americas, while adding longer-term optionality through the six exploration properties.”
Raymond James has given the stock an Outperform rating, with a price target of C$7.50.
We like the stock and, based on our quantamental stock-picking model, have recently added it our portfolio. This replaced Australia-based producer OceanaGold. Maverix’ gross margin overtook OceanaGold’s in 2019 and has only continued to increase, which is why we made the rotation.
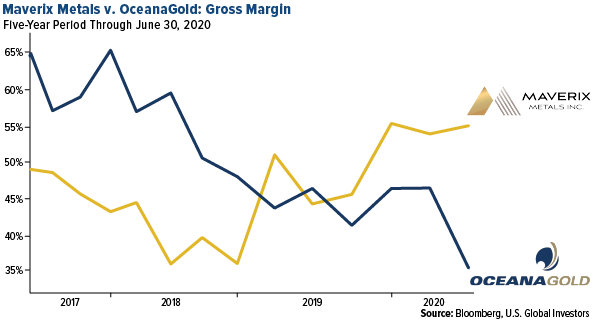
Since it began trading in July 2016, Maverix has outperformed OceanaGold and other global gold stocks.
Do you know the world’s top 10 gold producing countries? To find out, click here!
All opinions expressed and data provided are subject to change without notice. Some of these opinions may not be appropriate to every investor. By clicking the link(s) above, you will be directed to a third-party website(s). U.S. Global Investors does not endorse all information supplied by this/these website(s) and is not responsible for its/their content.
There is no guarantee that the issuers of any securities will declare dividends in the future or that, if declared, will remain at current levels or increase over time.
The relative strength index (RSI) is a momentum indicator used in technical analysis that measures the magnitude of recent price changes to evaluate overbought or oversold conditions in the price of a stock or other asset. Standard deviation is a measure of the dispersion of a set of data from its mean. The more spread apart the data, the higher the deviation. Standard deviation is also known as historical volatility. The cash flow growth rate for a stock is a measure of how the stock’s cash flow per share (CFPS) has grown over the last three to five years. Gross margin is a company's net sales revenue minus its cost of goods sold (COGS). In other words, it is the sales revenue a company retains after incurring the direct costs associated with producing the goods it sells, and the services it provides.
Holdings may change daily. Holdings are reported as of the most recent quarter-end. The following securities mentioned in the article were held by one or more accounts managed by U.S. Global Investors as of (06/30/2020): Tesla Inc., Wheaton Precious Metals Corp., Maverix Metals Inc., OceanaGold Corp., Barrick Gold Corp., Newmont Corp.
About the author
