
 The Captain’s weekly gold chart.
Analysis:
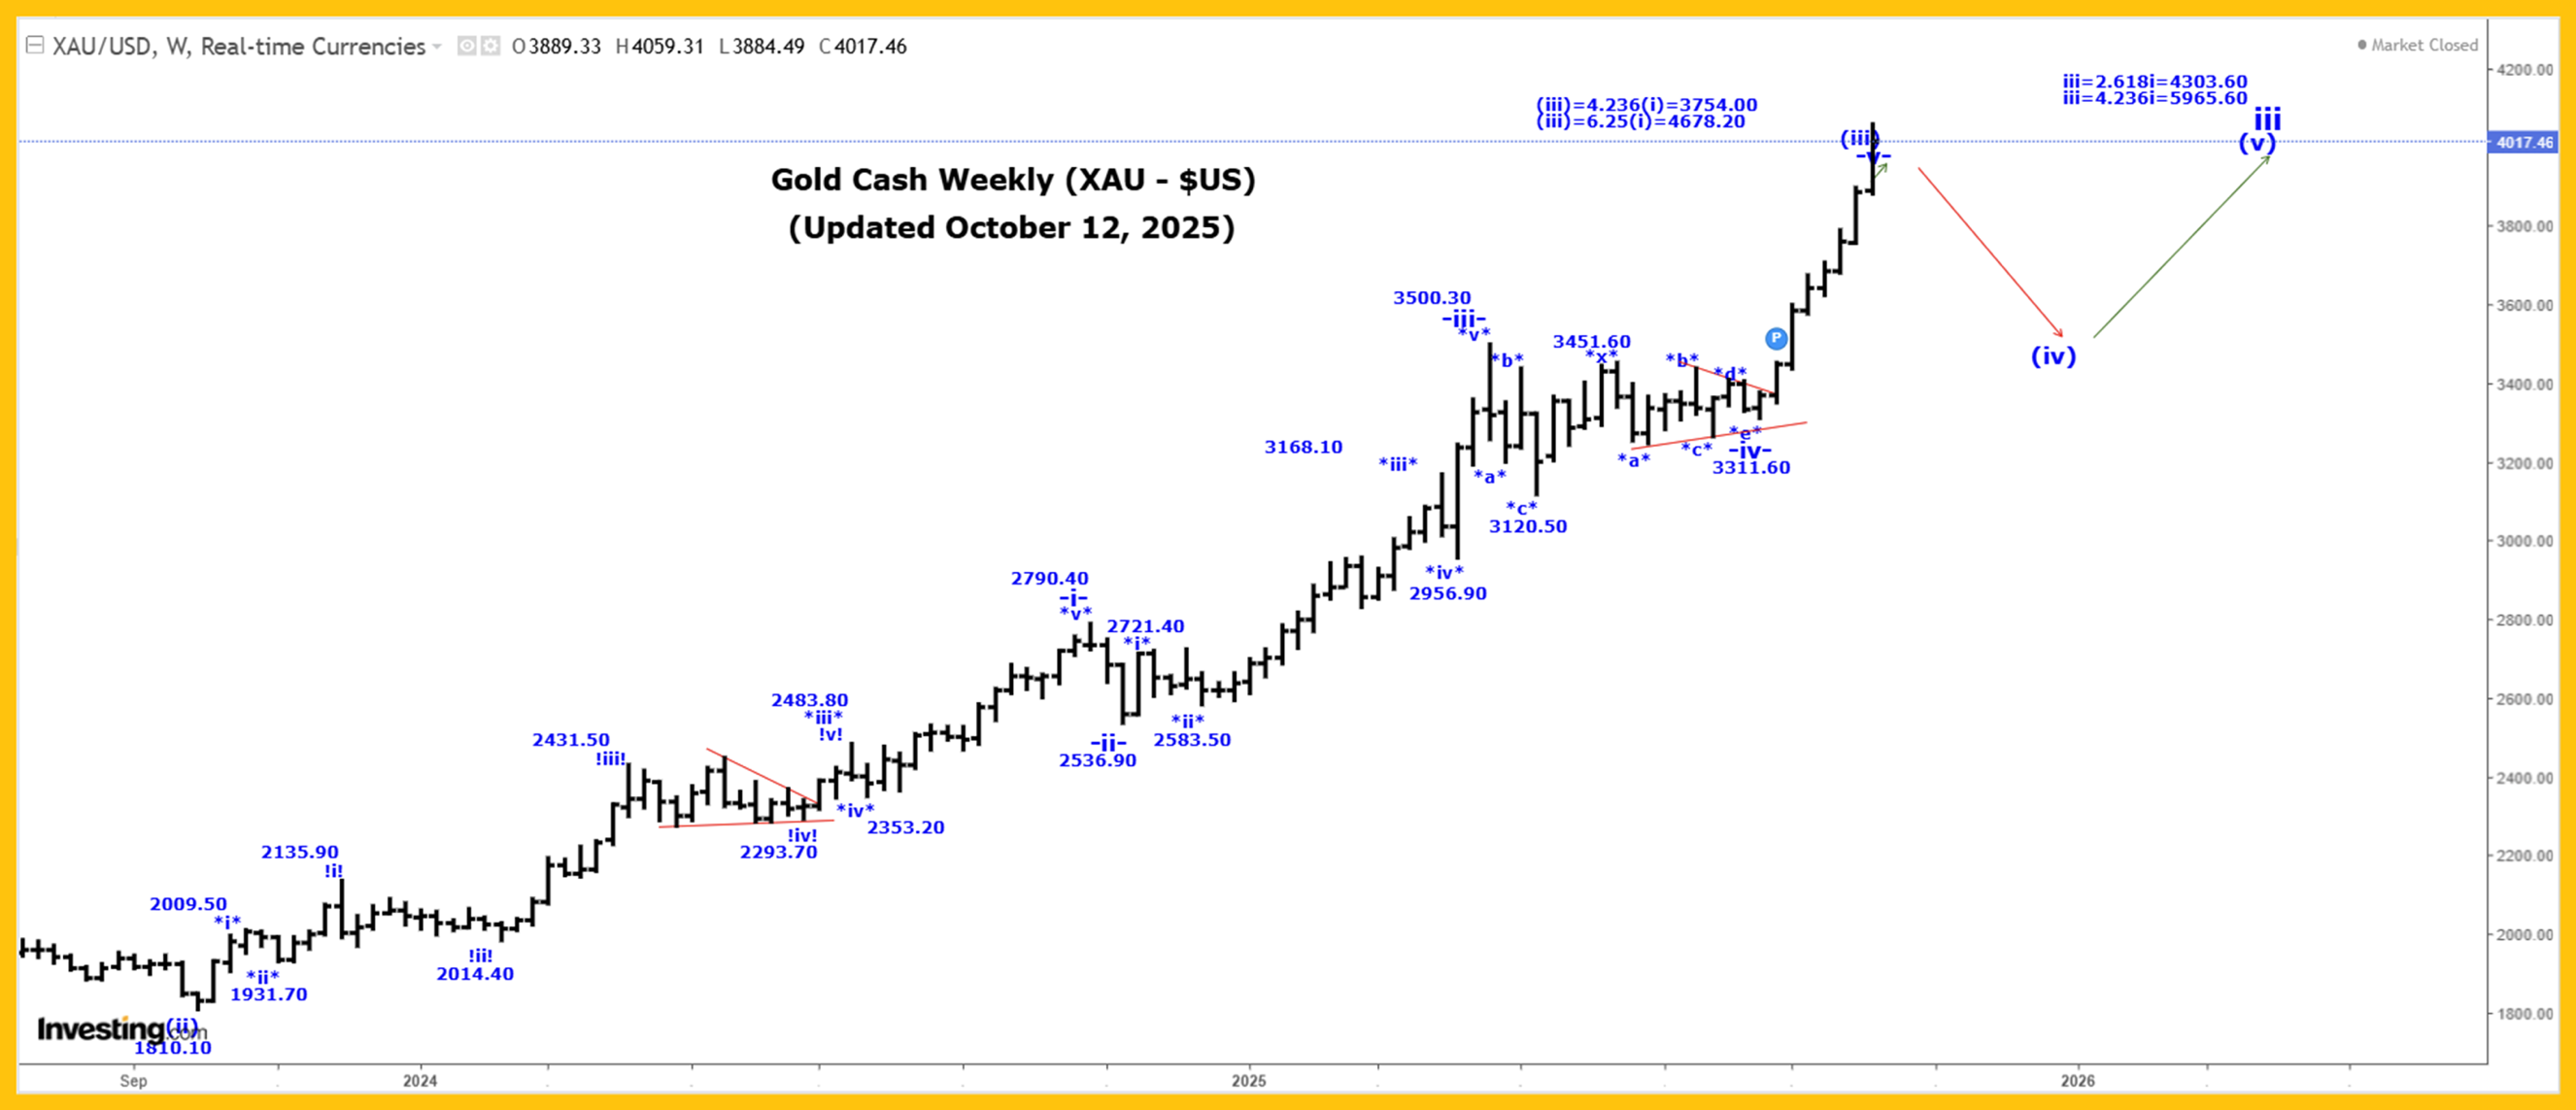
Gold was higher again this past week, reaching another all-time high at 4059.30, and closing at 4017.50!
Our current long-term gold count, starting from the 35.20 low made back in 1971, which remains incomplete, is as follows:
1 = 1920.80.
2 = 1046.20.
3:
i = 2073.40.
ii = 1614.40.
iii:
(i) = 2073.30.
(ii) = 1810.10.
(iii):
-i- = 2790.40.
-ii- = 2539.90.
-iii- = 3500.30.
-iv- = 3280.60.
-v- is still underway, to complete wave (iii).
Projections for the end of wave (iii) are:
(iii) = 4.236(i) = 3753.00.
(iii) = 6.25(i) = 4678.20.
We are very reluctantly now working on the assumption that all of wave -v- and (iii) are complete at the 4059.30 high, and if that is the case, then we are starting to fall in our wave (iv) correction, with retracement levels as indicated in our last Friday Daily Post.
It is still too early to determine which internal wave structure wave (iv) is following.
A projection for the end of wave iii is:
iii = 4.236i = 5965.60.
Projections for the end of wave 3 are:
3 = 2.618(1) = 5936.00.
3 = 4.236(1) = 9033.60
We still cannot rule the possibly that wave -v- is going to move substantially higher and in that case, likely only wave *i* of -v- of (iii) ended at the 4059.30 high and we are now falling in a wave *ii* correction that should retrace between 50 to 61.8% of the entire wave *i* rally.
This would result in wave (iii) soon heading to our last projected endpoint of 4678.20!
Active Positions: Long with puts as stops!
Rates:
 The Captain’s monthly US rates chart.
Analysis:
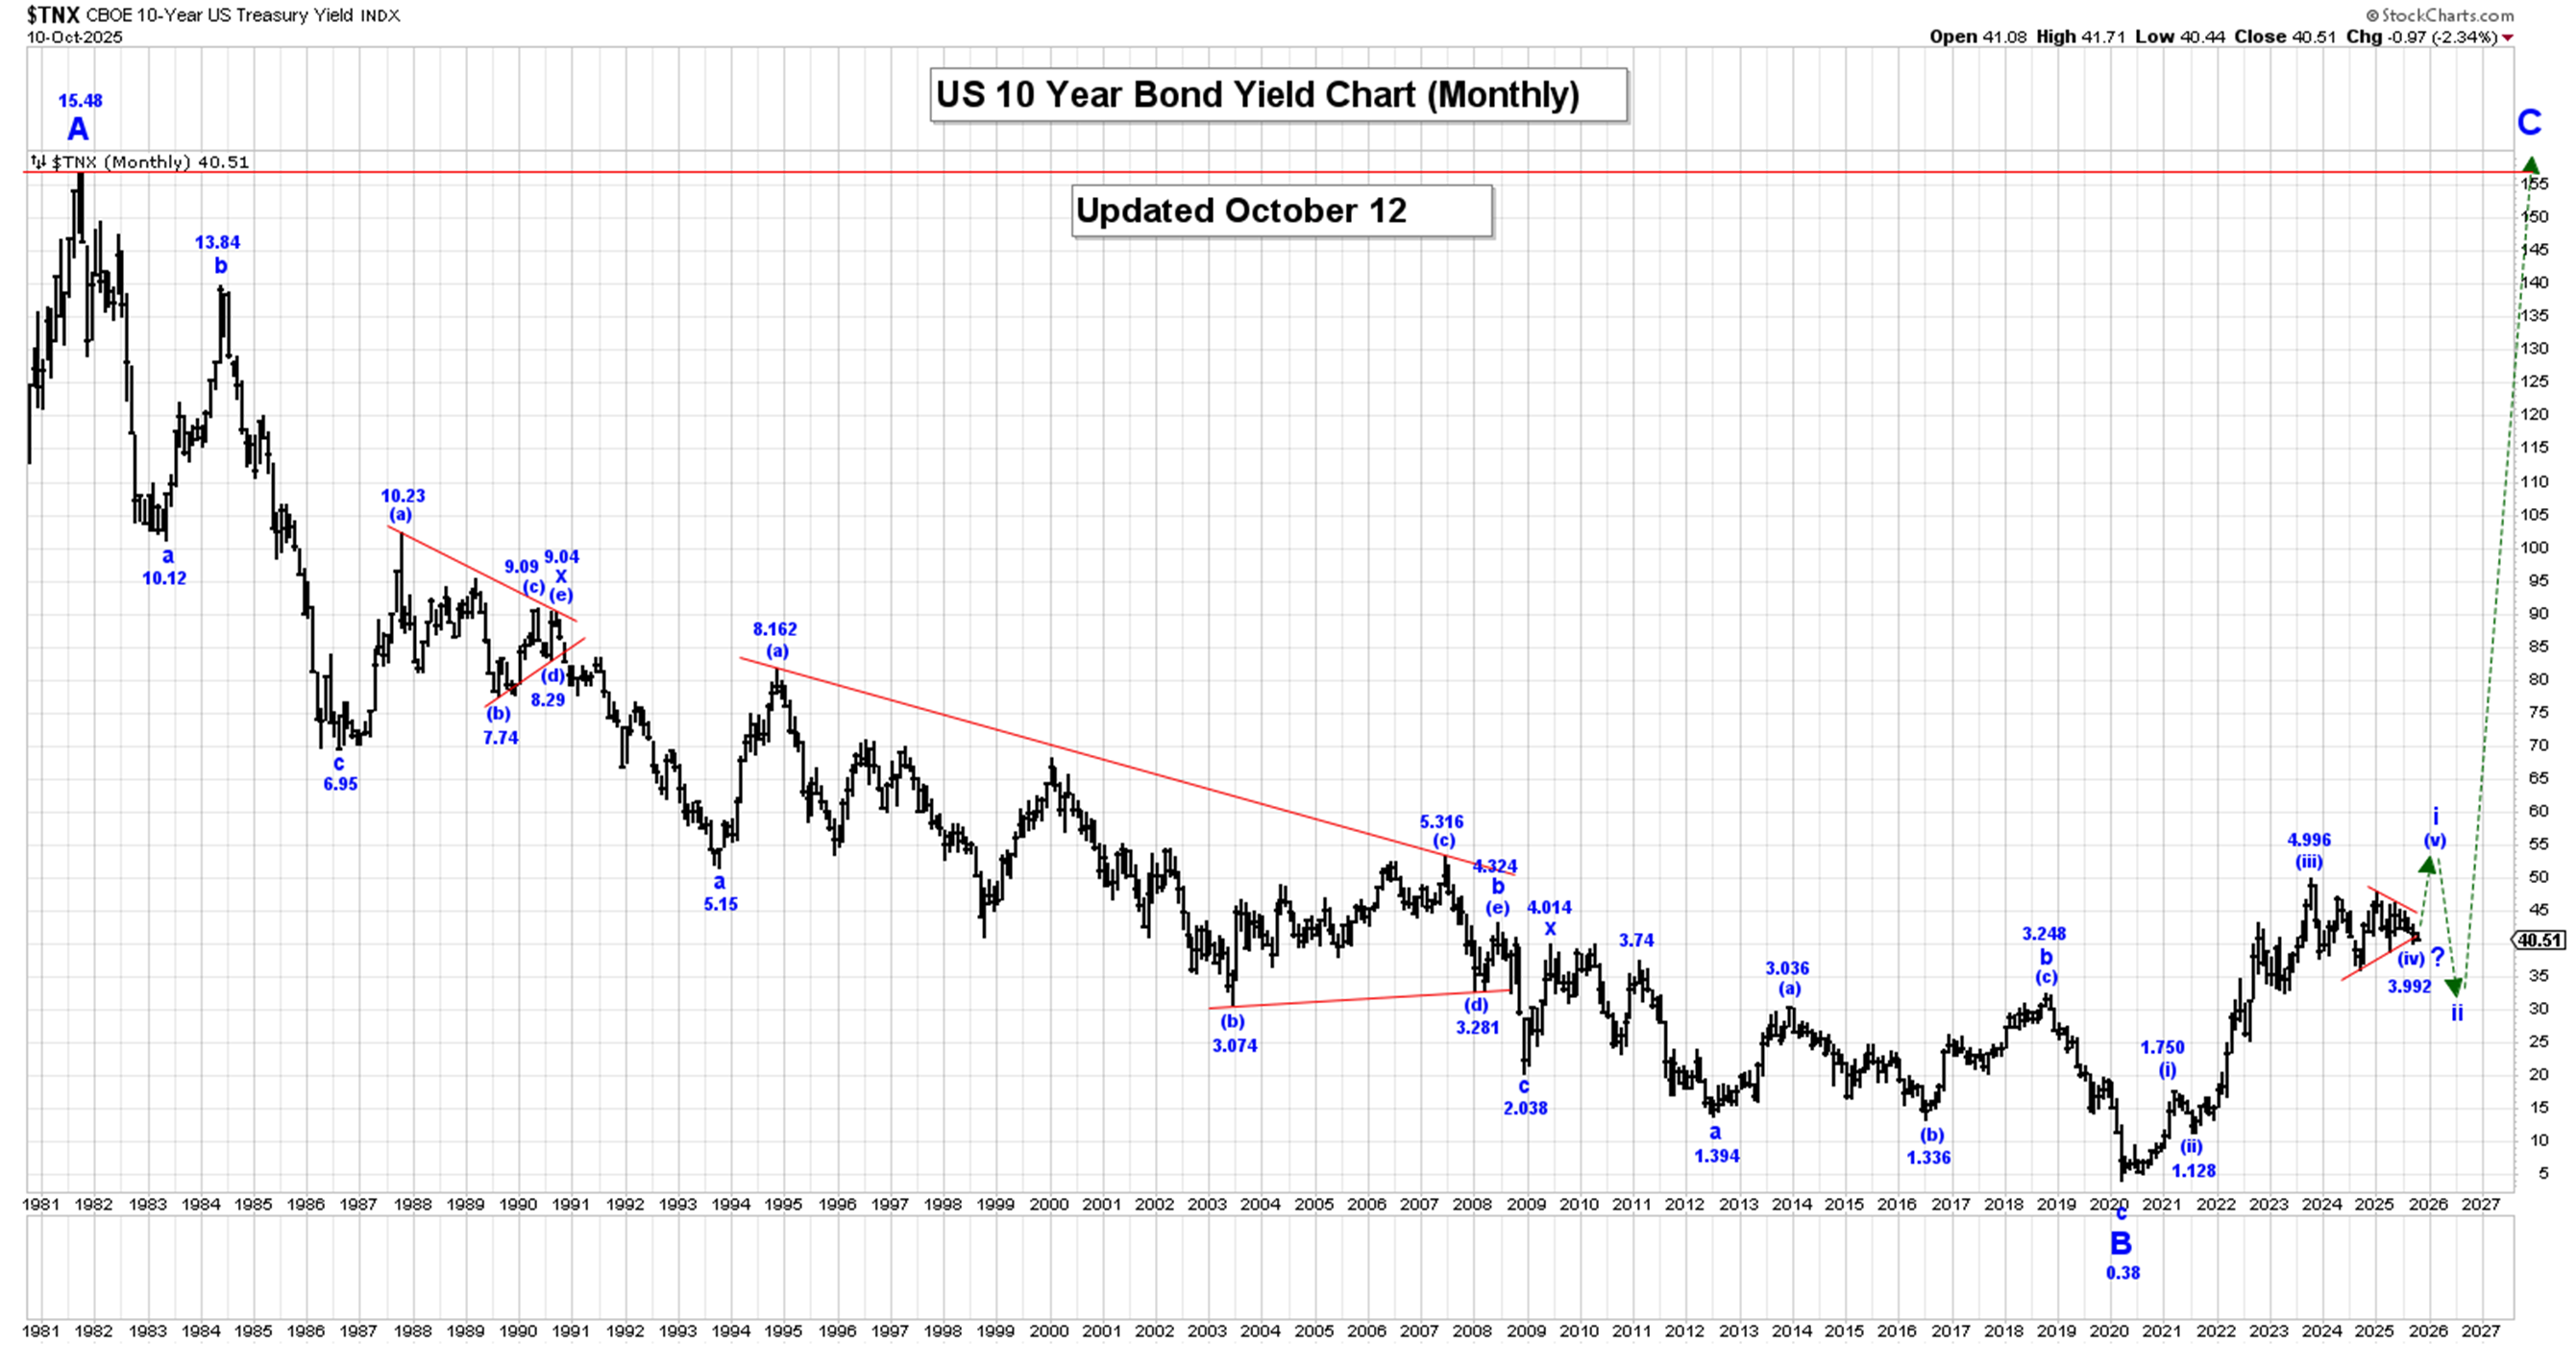
The 10 Year US Bond Yield was lower again this past week, reaching a low of 4.044%, closing at 4.051%.
Within a multi-year wave C, we are rallying in wave i, which is now still underway.
Within wave i, we completed wave (i) at 1.266%, wave (ii) at 0.504%, wave (iii) at 4.997% and we are now correcting in a large wave (iv) bullish triangle, which could now be complete at the 3.992% low.
After our wave (iv) bullish triangle ends, we expect a very sharp thrust higher in wave (v) to complete all of wave i.
We will provide our projected endpoints for wave (v), later next week in one of our Morning Posts.
While the new tariffs mayhem likely “seals the deal” for 2 Fed Funds rate cuts this year… based on the size of the bullish triangle for the 10-year rate, a spike high to 6.00% could be possible!
After wave i ends, we expect a wave ii, correction that retraces between 50 to 61.8% of the entire wave i rally.
On our Long-Term Monthly Chart, all of wave A ended at the 15.83 high in 1981 and since that high was made, we have fallen in a triple 3 wave correction within wave B that ended at the 0.38% level.
We have started to rally higher in a multi-year wave C rally that should eventually see rates reach at least the 15.83 high again.
Active Positions: Long, risking to 3.880%!
S&P500:
 The Captain’s weekly S&P500 chart.
Analysis:
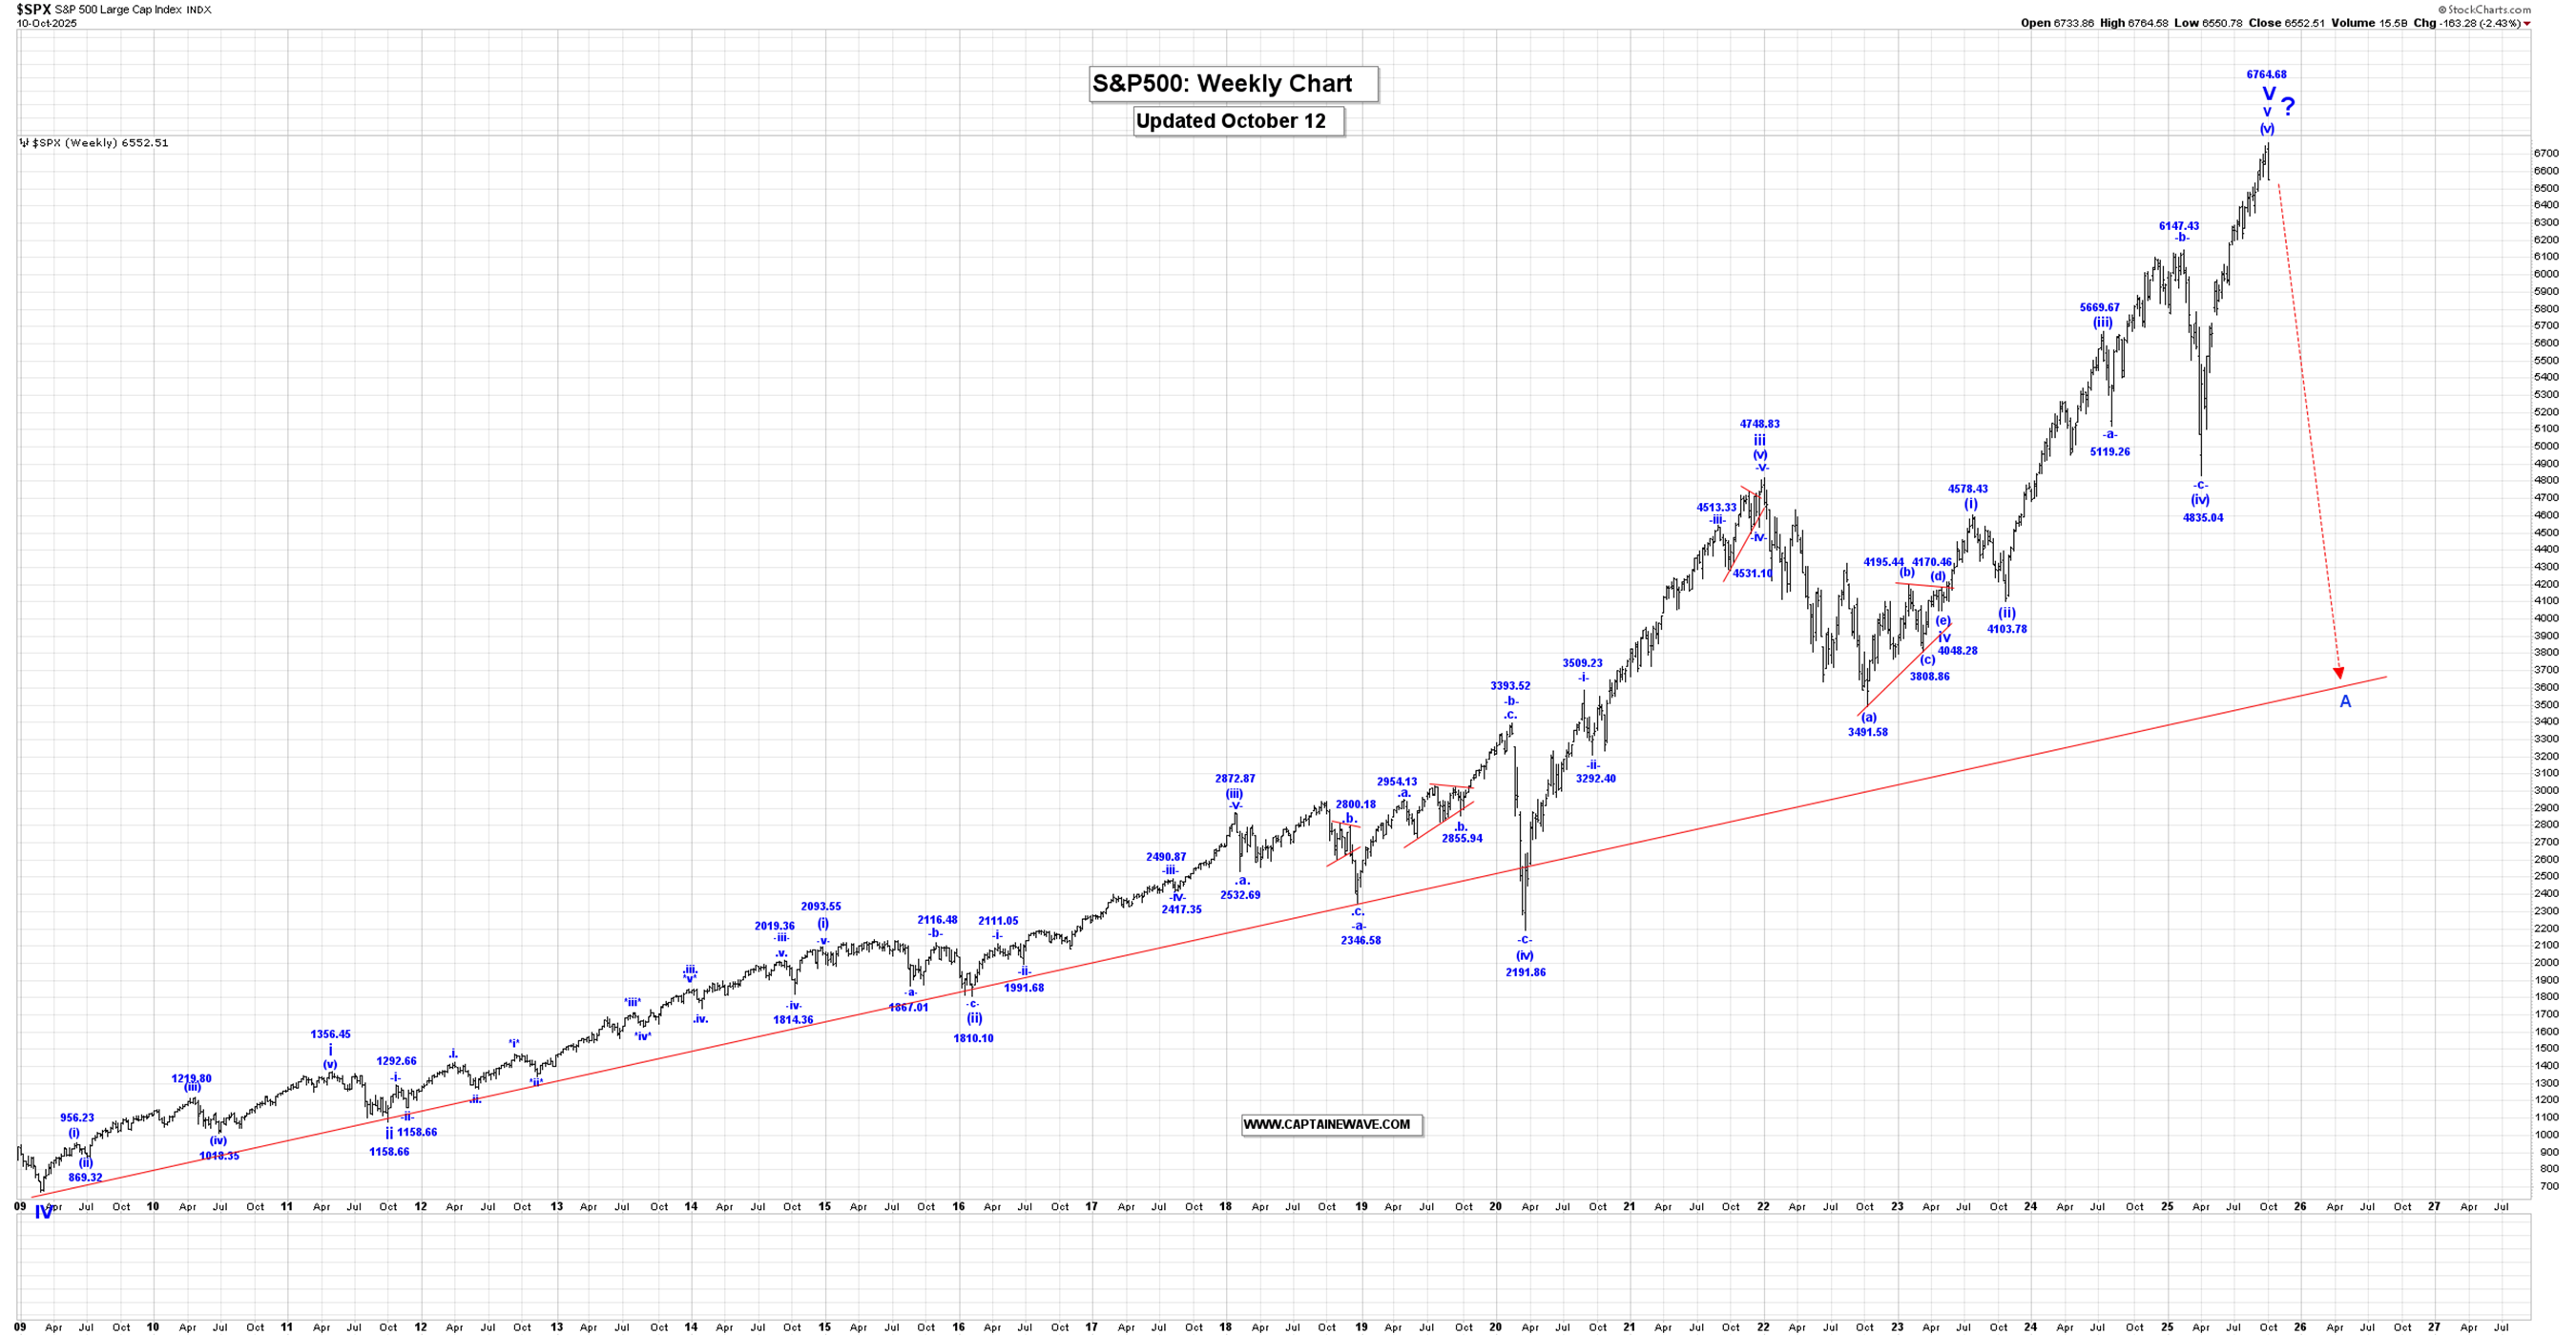
The SP500 was initially higher again this past week, reaching another all-time high at 6764.68, although after that high was made we moved sharply lower, reaching a low of 6550.78!
Within v of V, wave (iv) ended at 4835.04, and we are moving higher in wave (v), which has the following internal wave count:
.i. = 5381.55.
.ii. = 5104.34.
.iii. = 6427.02.
.iv. = 6212.89.
.v. = 6764.68, if complete.
The sharp drop in the SP500 on Friday is likely signaling that a major top has occurred at the 6764.68 high, and a multi-year corrective drop has begun.
We probably completed a five-wave impulsive drop from 6764.68 to 6550.78, so we would not be surprised to see a retracement of between 50 to 61.8% of that drop early next week, before we head lower again.
This upcoming rally could be shorted, with stops at 6765.00.
Active Positions: Short, with call options as our stops!
Thank-you!
Captain Ewave & Crew
About the author
