
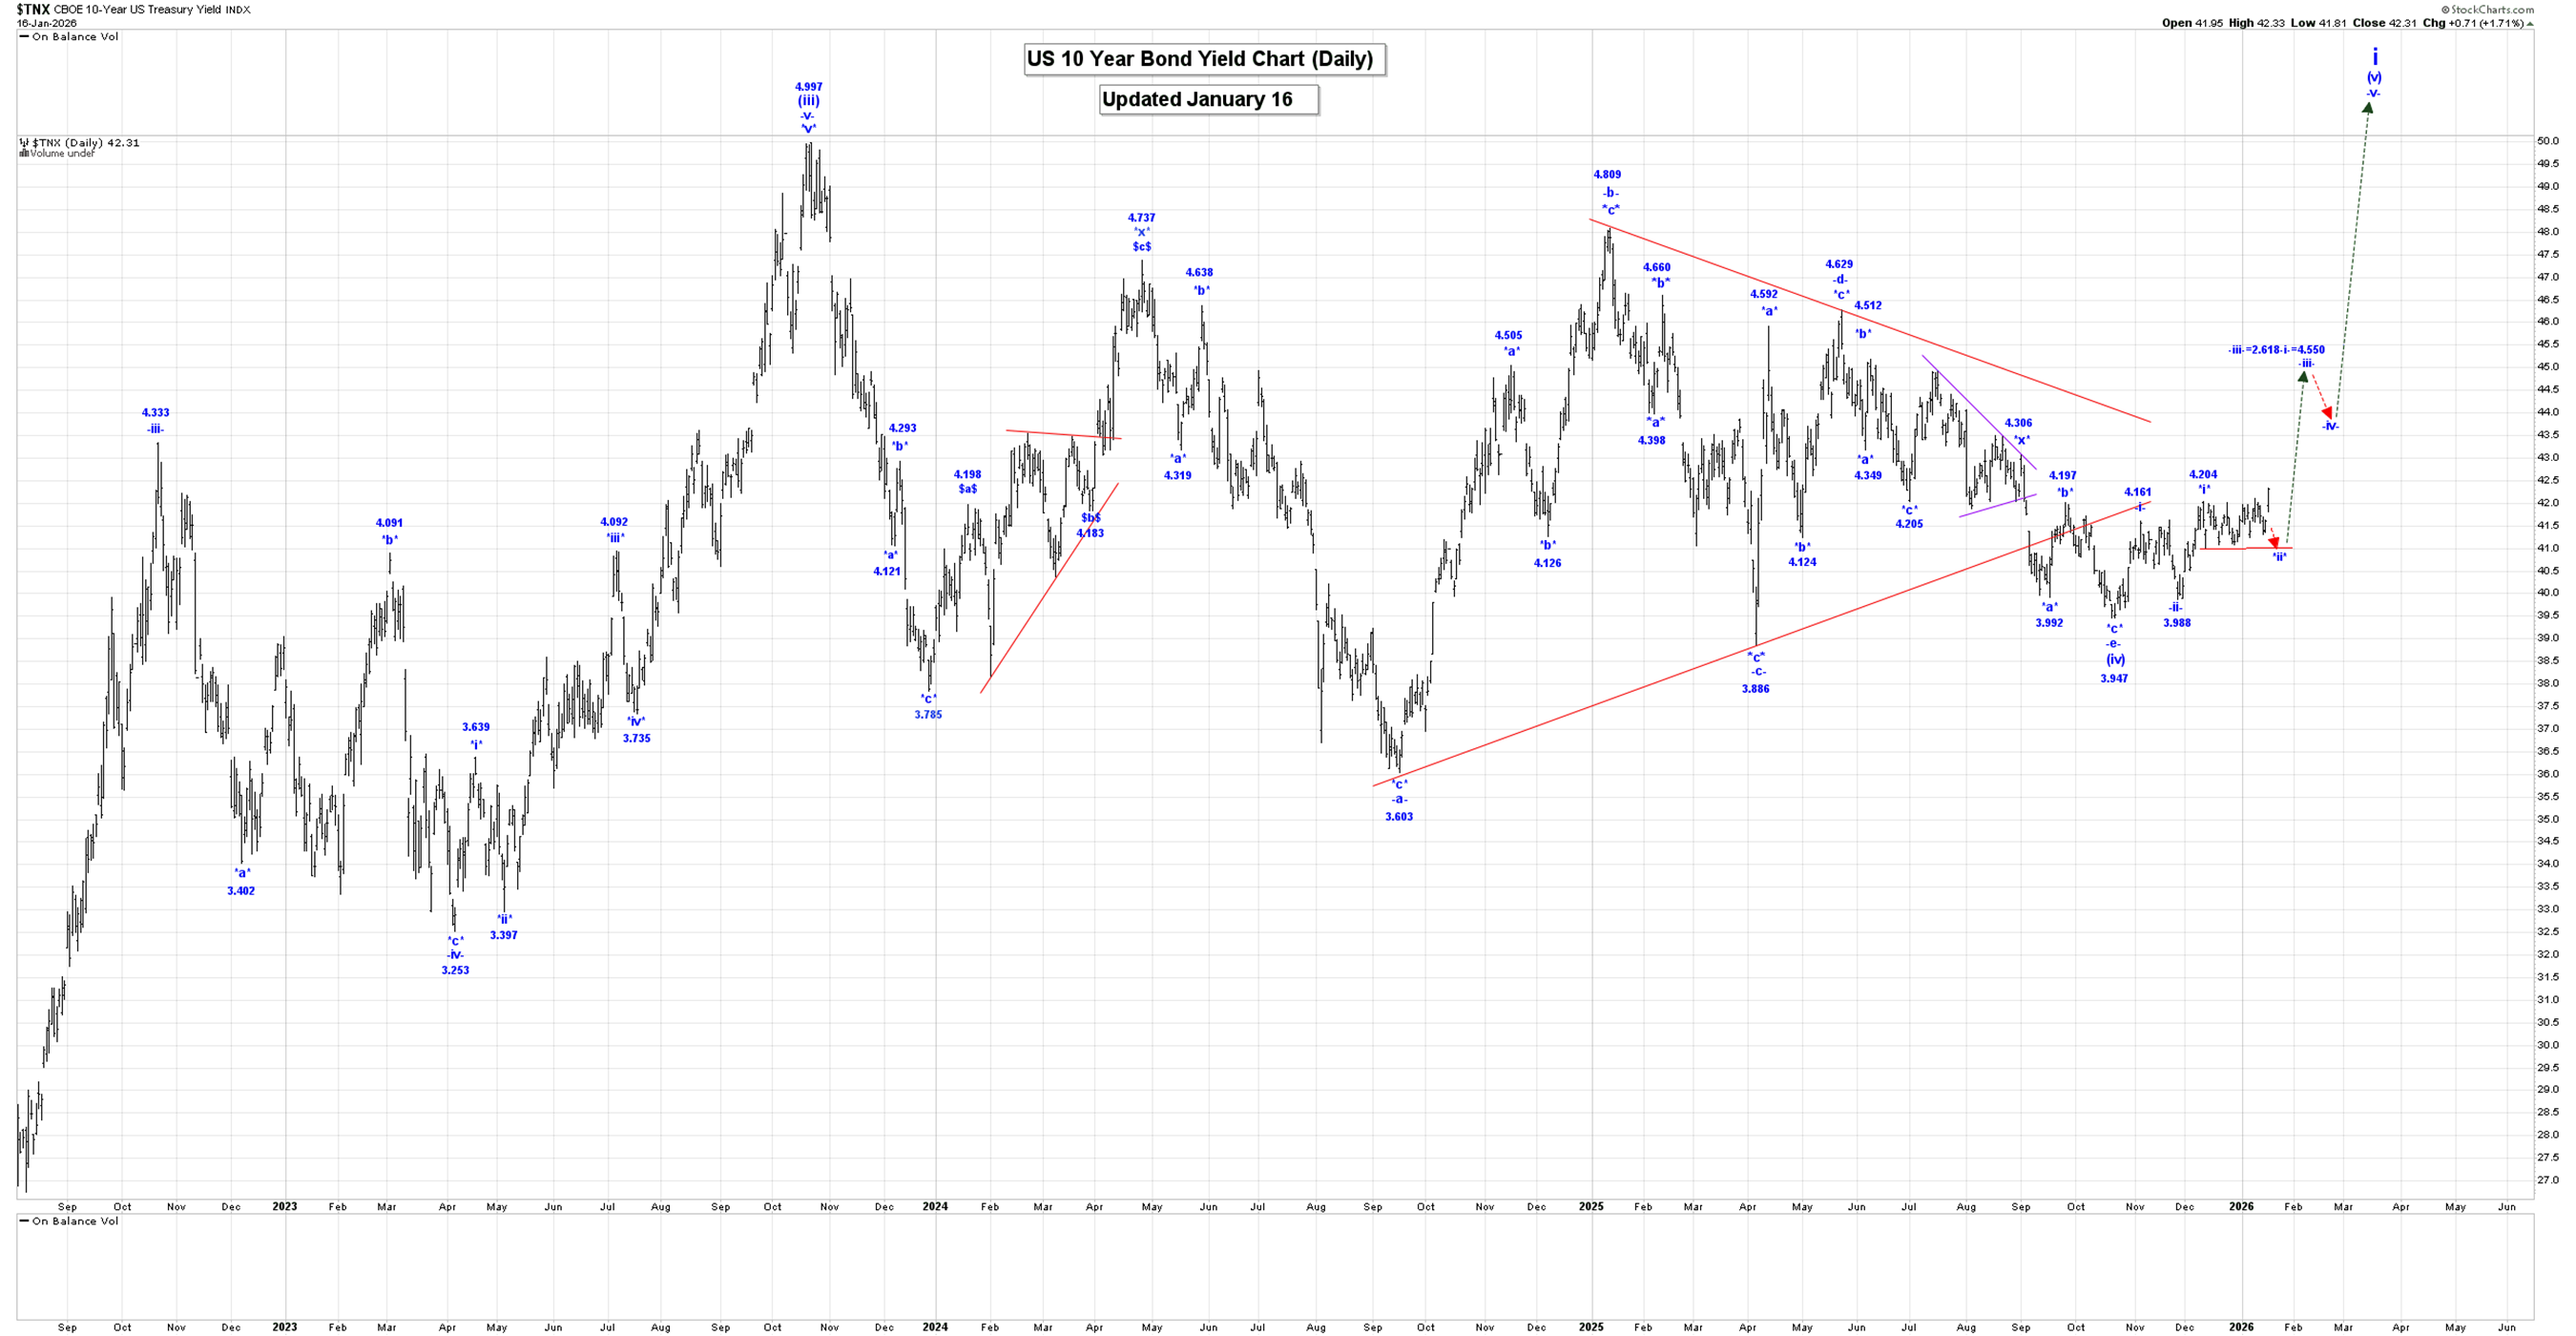
The Captain’s short-term 10-year rates chart. We have an upside breakout, as of Friday’s close!
Analysis:
Wave i is still underway, as shown on our Daily Chart.
Within wave i, we completed wave (i) at 1.266%, wave (ii) at 0.504, wave (iii) at 4.997%, and it is now looking like we are still falling in a more complex wave -e- of (iv), which we are now assuming is complete at the 3.947% low.
We should now be starting to rally higher in wave (v), and within wave (v), we are moving higher in wave -i-. Within wave -i-, we likely completed wave *i* at 4.161% and all of wave *ii* at 3.988%. If that is the case, we are now moving higher in wave *iii*, which has an initial projected endpoint:
*iii* = 1.618*i* = 4.330%
Our projections for the end of wave (v) are:
(v) = 4.997.
(v) = 1.618(i) = 5.370%
Trading Recommendation: Long risking to 3.880%.
Active Positions: Long risking to 3.880%!
Oil:
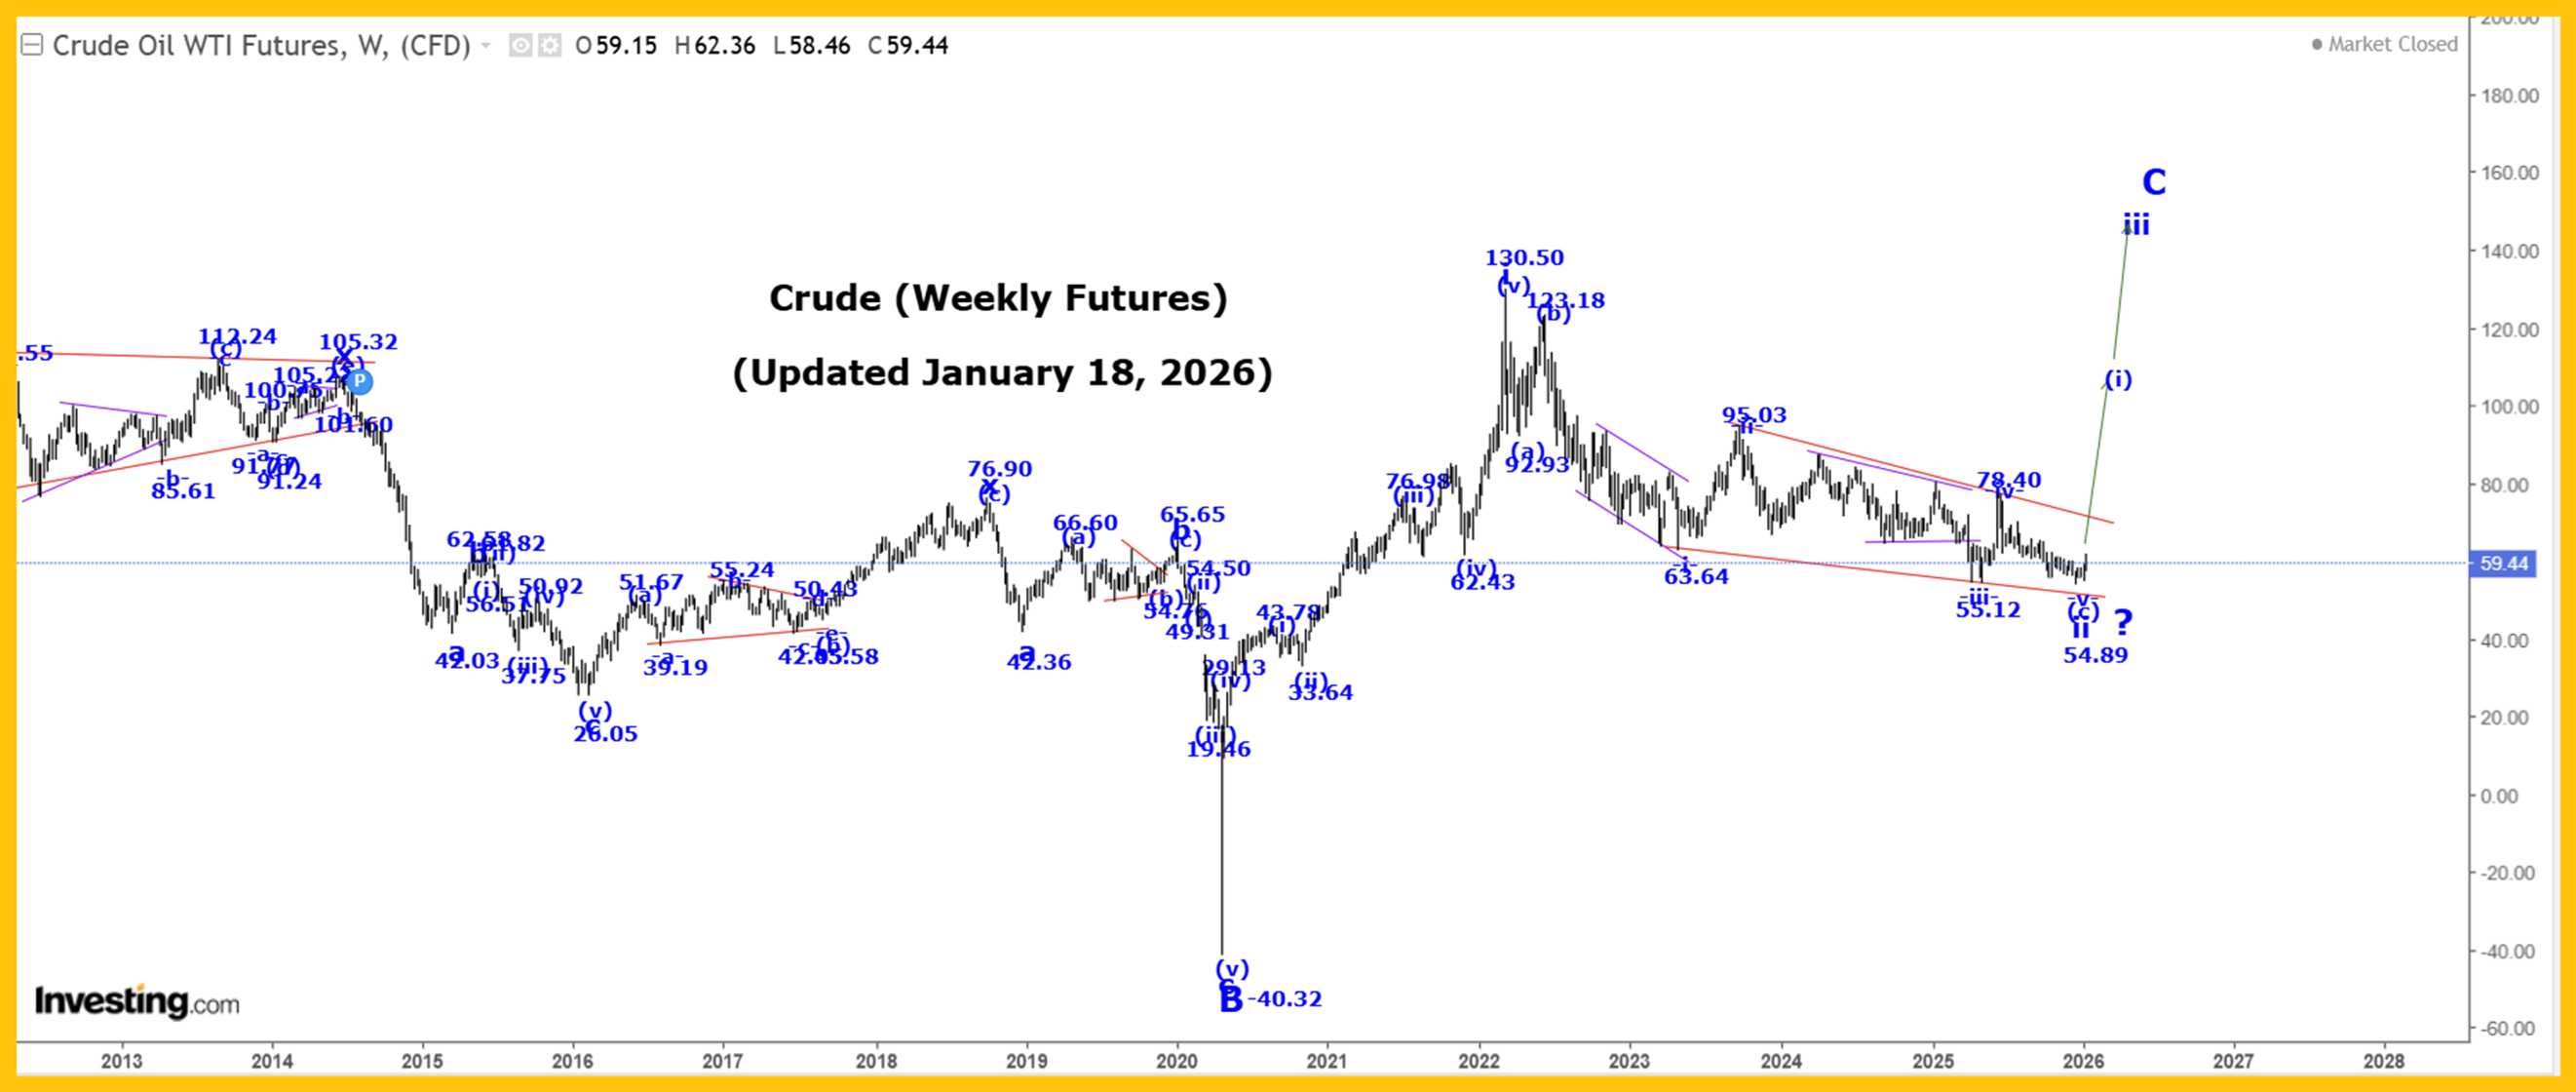 The Captain’s weekly crude oil chart.
Analysis:
Long Term Update:
Crude was higher again this past week, reaching a high of 62.36, closing at 59.44.
Our internal wave count for wave ii to looks like:
(a) = 92.93.
(b) = 123.18.
(c) diagonal triangle:
-i- = 63.64.
-ii- = 95.03.
-iii- = 55.12.
-iv- = 78.40.
-v- = 54.89, if complete.
We have now completed the minimum requirement for an end of our wave -v- ending diagonal triangle formation at the 54.89 low, although only a break of the upper red trendline connecting 95.03 and 78.40 will confirm this to be the case.
After wave ii ends, we expect a very sharp rally higher in wave iii, and we will provide our projected endpoint for its completion after wave ii ends.
In the long term, we are now rallying in wave C that has the following projections:
C = A = 153.77.
C = 1.618A = 244.78!
Suncor:
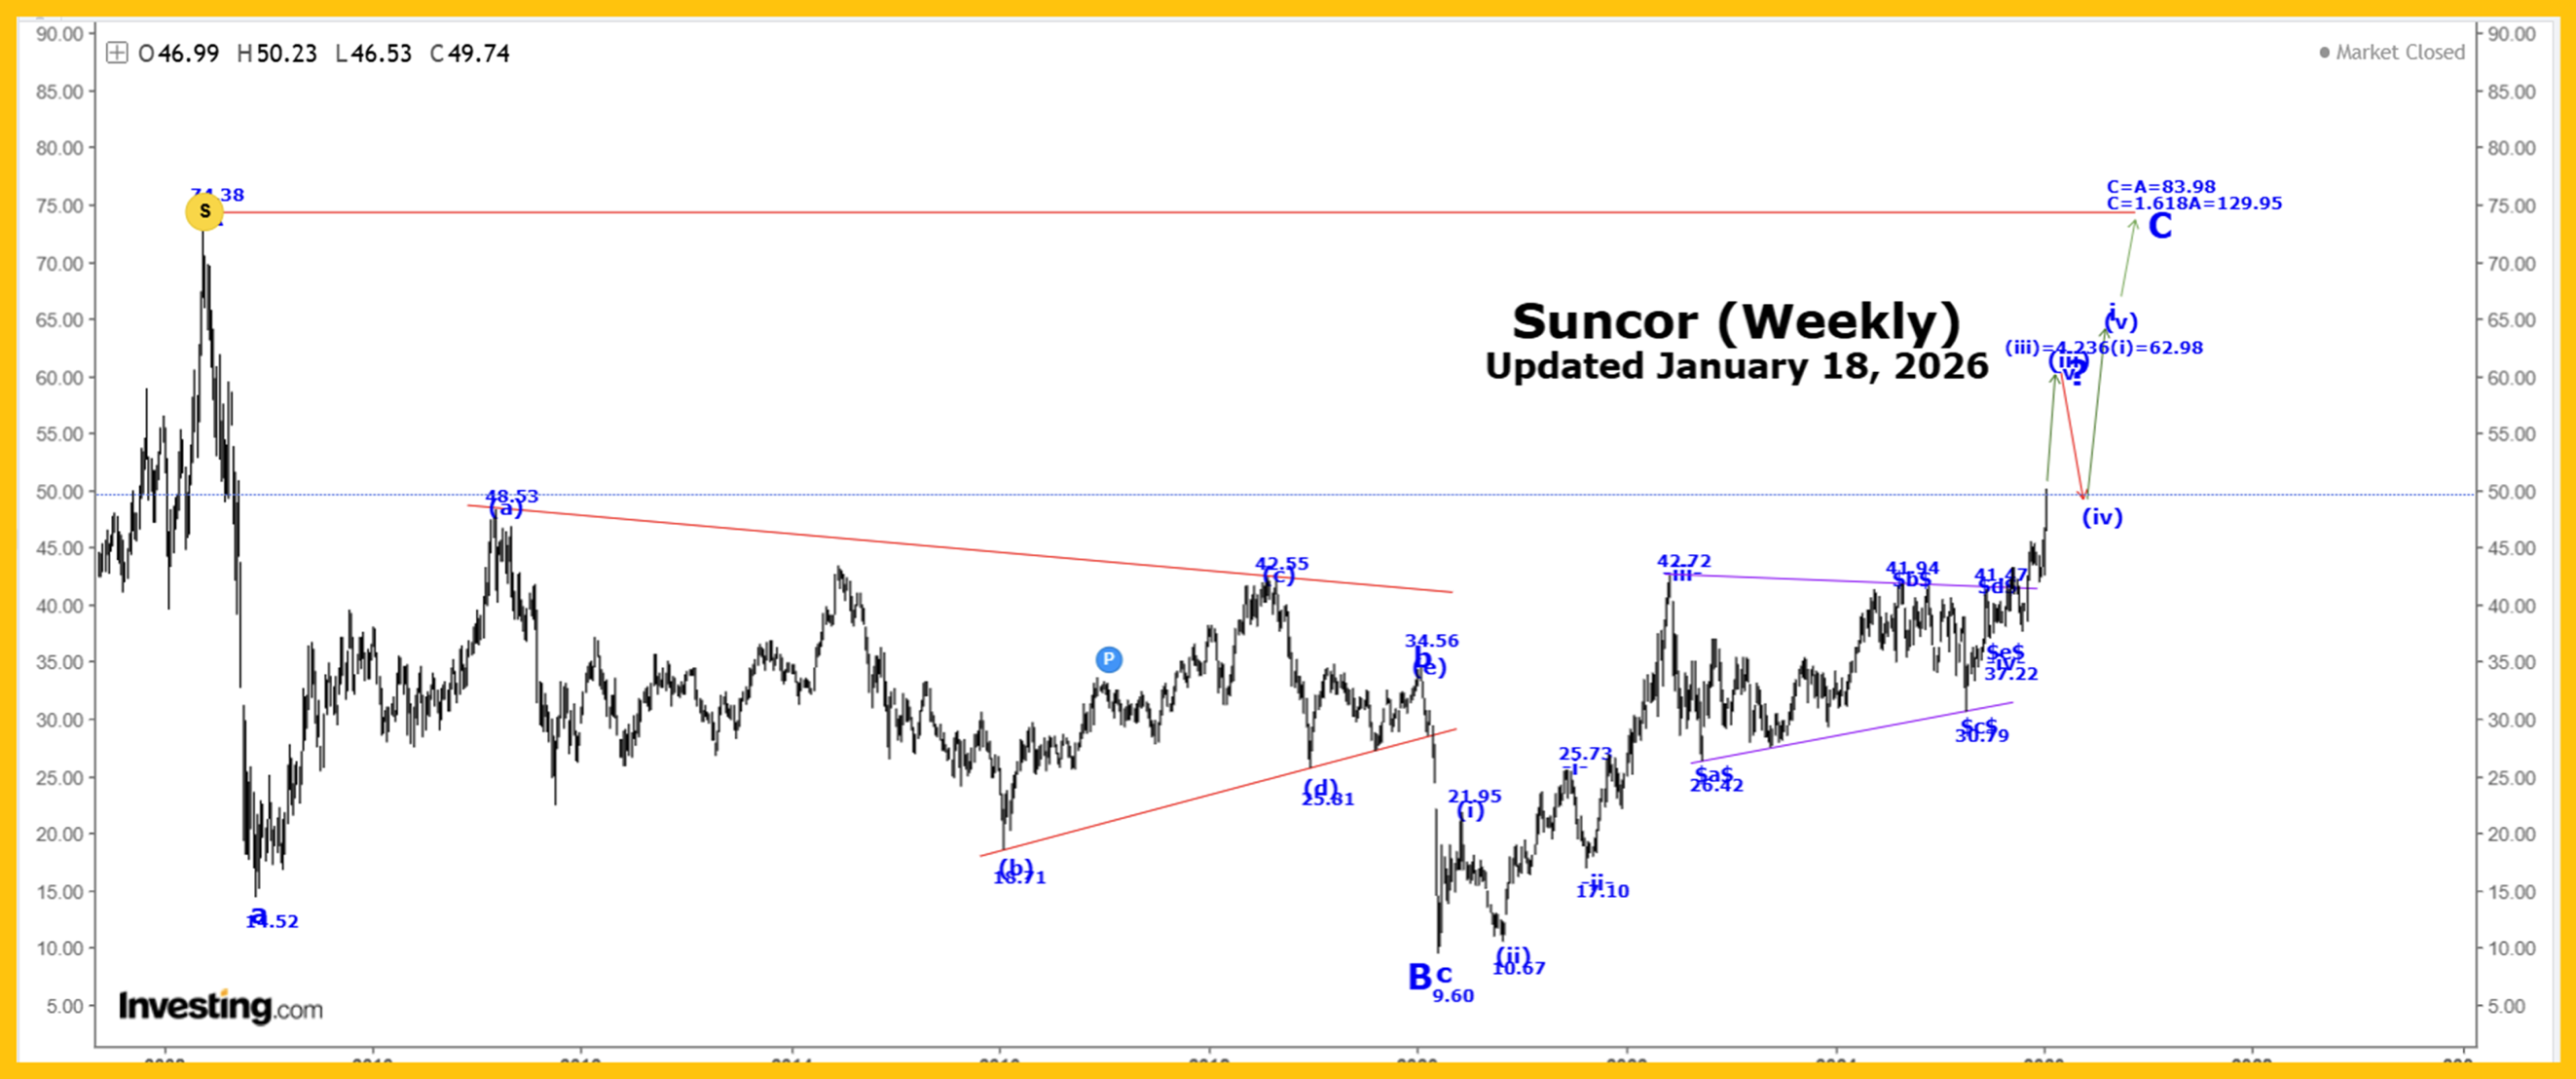 The Captain’s weekly Suncor chart.
Long Term Update:
Suncor was higher again this past week, reaching a high of 50.23, closing at 49.74!
Wave (iii) is still underway and moving higher to the next projected endpoint of:
(iii) = 4.236(i) = 62.98.
We expect higher prices as wave -v- of (iii) continues to develop.
Active Positions: Long crude, with puts as a stop. Long Suncor!
Gold:
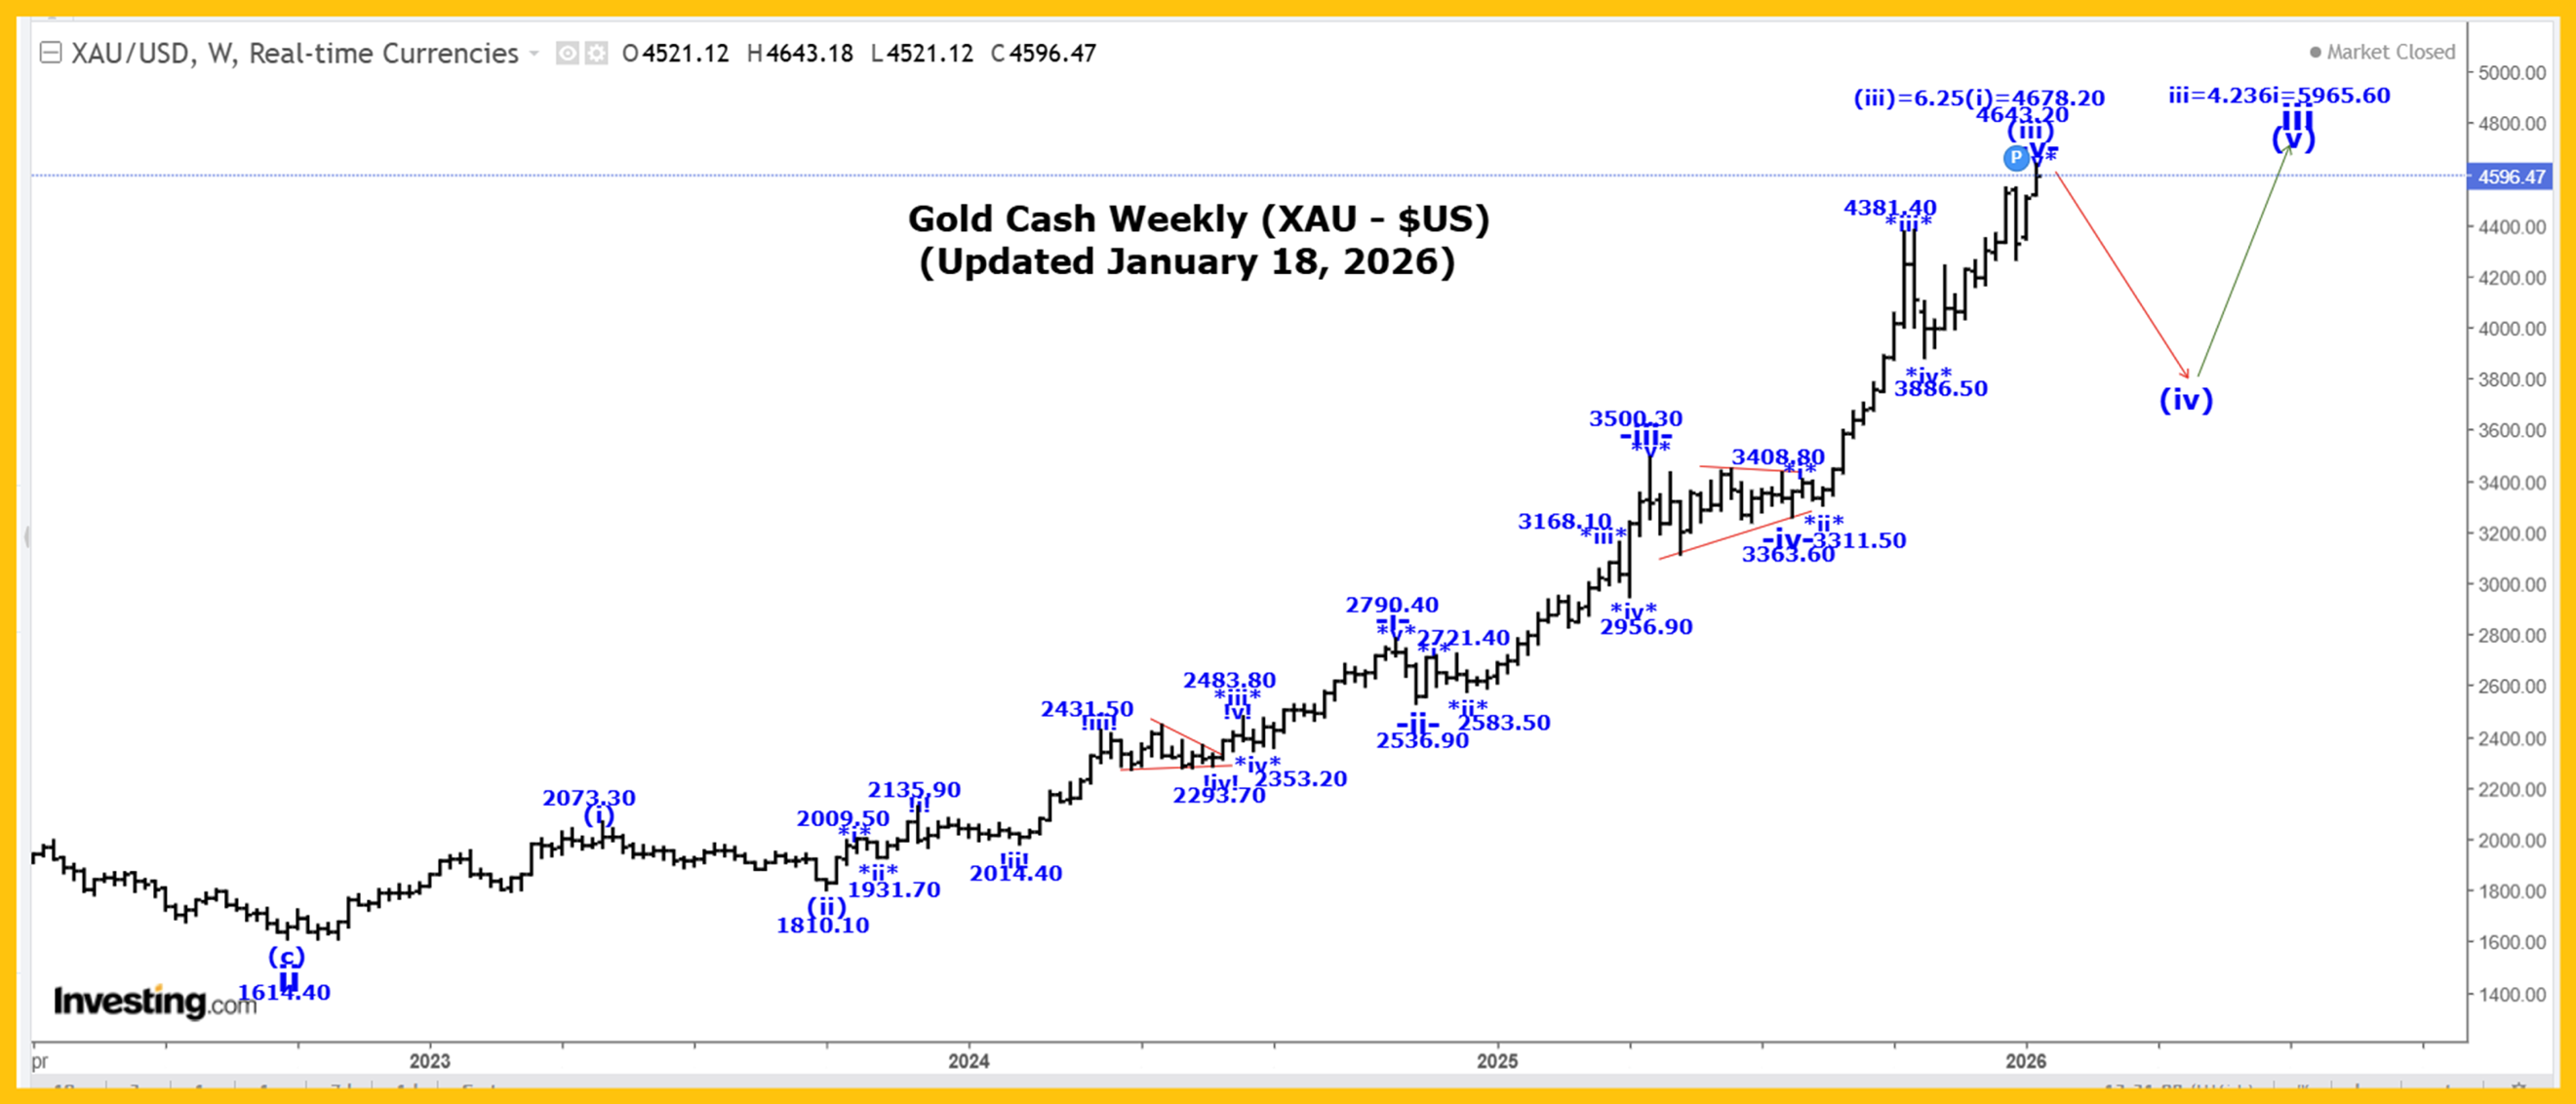 The Captain’s weekly gold chart.
Analysis:
Our current long-term gold count, starting from the 35.20 low made back in 1971:
1 = 1920.80.
2 = 1046.20.
3:
i = 2073.40.
ii = 1614.40.
iii:
(i) = 2073.30.
(ii) = 1810.10.
(iii):
-i- = 2790.40.
-ii- = 2539.90.
-iii- = 3500.30.
-iv- triangle = 3363.60.
-v- = 4550.10, if complete, to complete all of wave (iii).
Our last projection point for the end wave (iii) is:
(iii) = 6.25(i) = 4678.20!
We are still a bit short of our next projected endpoint for wave (iii), so we still see higher prices ahead!
After wave (iii) ends, we expect a wave (iv) correction that retraces between 23.6 top 38.2% of the entire wave (iii) rally.
A projection for the end of wave iii is:
iii = 4.236i = 5965.60.
Projections for the end of wave 3 are:
3 = 2.618(1) = 5936.00.
3 = 4.236(1) = 9033.60!
Active Positions: Flat!
Thank-you!
Captain Ewave & Cre
About the author
