
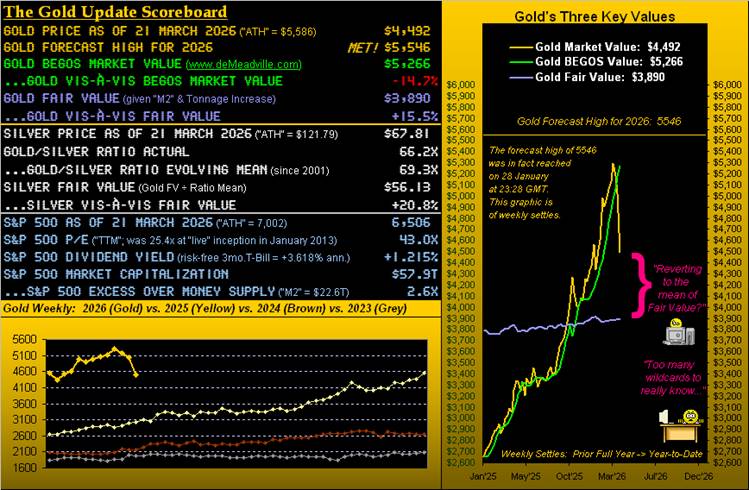
We’ve felt a bit of a lone wolf year-to-date in duly citing Gold’s overbought state. However of late, the mighty metal’s market participants have finally been grasping Gold’s dire strait. For en route to settling the week yesterday (Friday) at 4492, price from its All-Time High of 5586 — a mere 36 trading days ago on 29 January — is down -19.6%.
Not surprisingly in turn (and as promptly posted Wednesday on “X” @deMeadvillePro), Gold’s 14-week run of being parabolically Long saw such stance flip to Short. Here ’tis, the rightmost first red dot as encircled:
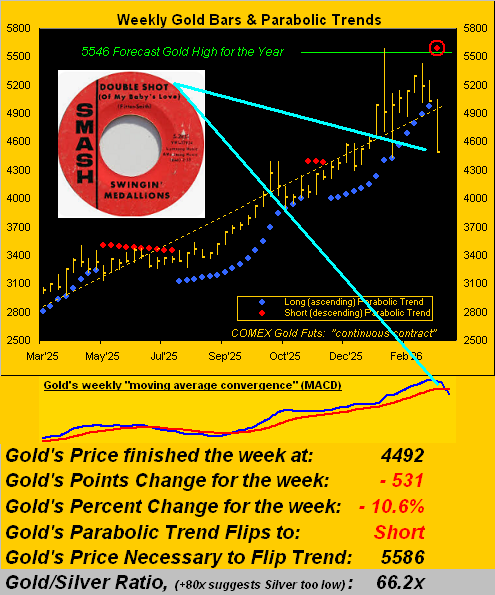
But wait, there’s more: note the above graphic’s being embedded with the now negatively-crossed “moving average convergence divergence” (MACD), the momentum of the blue line having powered down below the red line. We’ve thus now adversity by both the parabolics and momentum: hardly the ![]() “Double shot of my baby’s love”
“Double shot of my baby’s love”![]() we relish romancing for Gold, (hat-tip The Swingin’ Medallions, ’66).
we relish romancing for Gold, (hat-tip The Swingin’ Medallions, ’66).
“But negative MACDs on the weekly haven’t been that bad, right mmb?”
Squire, in looking at any broad-term chart of Gold from the year 2019-to-date, price has been in rally mode, (the current overvaluation downside lurch notwithstanding). Indeed, the price of Gold started 2019 at 1285 and at 4492 today is an impressive 3.5x that opening price of just over seven years ago. By comparison, the S&P 500 opened the same year at 2477 and is now 2.6x higher at 6506. And yet throughout when specific to these two markets, the FinMedia’s focus has essentially been 99% on the S&P and 1% on Gold. Oh well … perhaps they’ll figure it out someday.
Despite that, again as above graphically described, Gold has just taken a double shot of technical adversity per the weekly MACD and parabolics.
“Which, mmb, begs the usual question of ‘How low is low?’…”
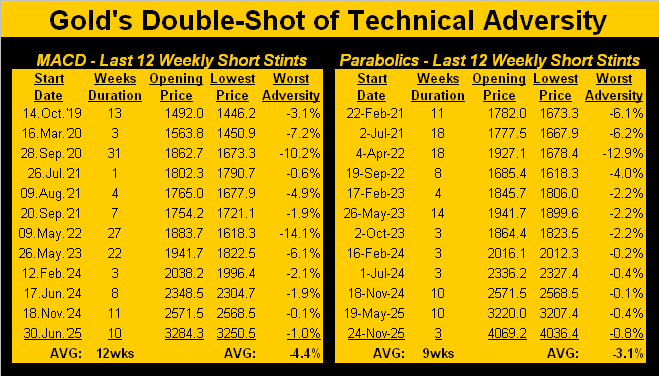
The answer being, Squire, that none of us know. Yet, we’ve history as a hint as to how low Gold may go. The following two-panel table of weekly stints displays Gold’s worst adversity for the last 12 MACD Short signals on the left and for the last 12 parabolic Short signals on the right. ‘Tis important to note that given Gold’s bold performance, adversity certainly from 2023-to-date has been comparatively minimal. And whilst “average” hardly is “absolute”, at the foot of each panel is the average Short weeks’ duration before flipping back to Long: 12 weeks for the more ponderous MACD and 9 weeks for the slightly swifter parabolics. Thus purely within the vacuum of “average” — and assuming the yellow metal opens this Monday ’round where now ’tis at 4492 — precisely hitting the MACD’s -4.4% decline would put Gold at 4294 within 12 weeks, or by the parabolics a -3.1% decline down to 4353 within 9 weeks. ‘Course, given Gold’s expected daily trading range is presently 167 points — let alone the weekly being 340 points — price could touch such adversity in a single day. Here’s the table either way:
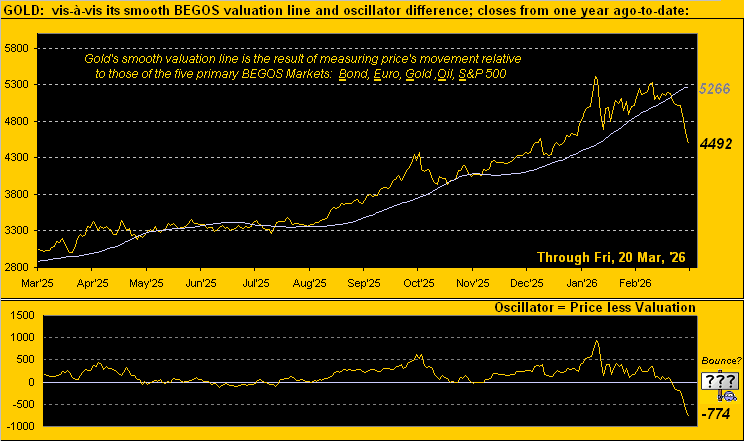
All such negative nattering aside, there is good news: Gold by the opening Scoreboard is now -14.7% below its BEGOS Market Value of 5266, which is a “near-term” view versus the “long-term” Fair Value level of 3890, (above which present price is +15.5%). Obviously it remains to be seen if Gold truly is en route to fully reverting to Fair Value; but strictly by BEGOS, Gold for the near-term moment is undervalued. Thus we wouldn’t be surprised a wit to see Gold buyers come bollocking in for a bounce on Monday, prematurely as they may be given the double-shot of technical adversity. Regardless, here’s our year-over-year graphic of Gold, now -774 points below its BEGOS valuation:
Bouncing just fine in the meantime is the Economic Barometer. Taking in 13 metrics this past week, just four were worse period-over-period, especially January’s “shutdown-delayed” New Home Sales which missed consensus by the worst margin since those for April 2022 and clearly were worse than those for December, such month itself revised lower as well. Still, (albeit for two months later), March’s National Association of Home Builders Index beat consensus and improved over February, which too was revised higher. So building, but not buying? On verra… Here’s the Baro:
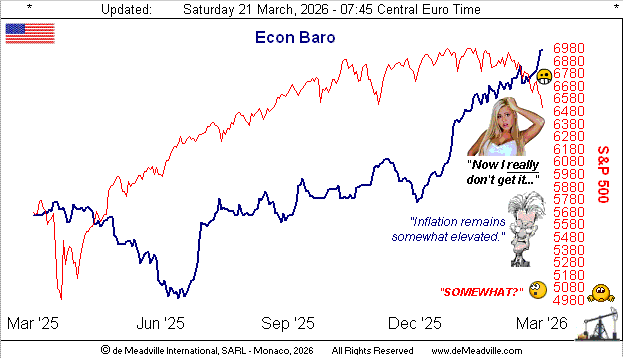
Yes, the StateSide economy appears quite fine, although the economic effects notably on the expense and availability of Oil per the war have yet to ripple into reported metrics. That high in the above graphic for the Econ Baro, (which we remind you WestPalmBeachers down there is an oscillator rather than an index), is at its loftiest level since 02 May 2024. Too, per last Wednesday’s Federal Open Market Committee Policy Statement: “…economic activity has been expanding at a solid pace.” Therein however, we view the sentence “Inflation remains somewhat elevated.” as an understatement.
Further, the S&P 500 today at 6506 is -7.1% below its 7002 record high, Dow Jones Newswires yesterday referring to stocks as being “pummeled”; (the children’s writing pool there there doesn’t know what “pummeled” looks like). Moreover, the S&P remains scarily high, its price/earnings ratio settling the week at 43.0x, the exact formula for which remains unsolvable by “AI” (Assembled Inaccuracy).
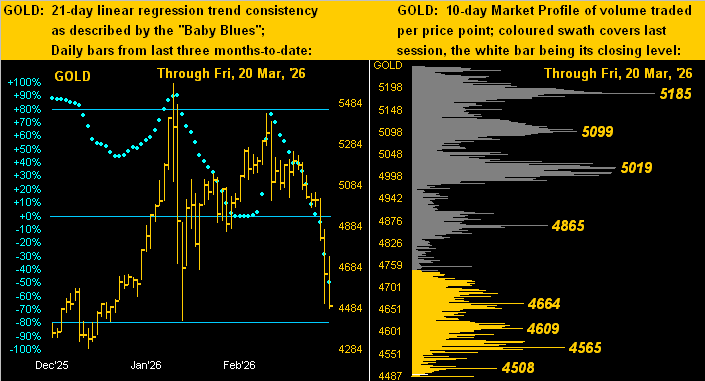
But directionally accurate as ever for Gold are our baby blue dots of linear regression trend consistency as depicted below at left across the past three months. And whilst those “Baby Blues” continue to descend, the lower leftmost cluster of daily bars from last December (4581-to-4284) into which Gold has now penetrated can be structurally supportive. As for the 10-day Market Profile at right, present price barely shows way down there as the wee white bar:
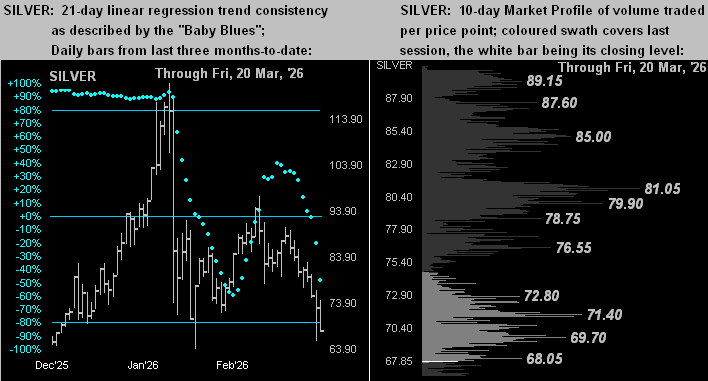
Per earlier mention, whereas Gold from its 5586 All-Time High to here (4492) is -19.6%, Silver from her record high of 121.79 to here (67.81) is off a whopping -44.3%, and yet by the opening Scoreboard still is +20.8% above her Fair Value of 56.13. However, Silver’s December-through-January rise was so vertical, that we see (below left) her “Baby Blues” essentially being “painted on the ceiling” prior to her wheels coming off into February and March. Too, as is Gold, Silver is buried near the bottom of her fortnight’s Profile (below right). From her peak, Sister Silver’s loss has been deprivative, yet still she’s expensive!
Three weeks into the war, we’ve waxed regularly about the usual geo-political Gold “spike n’ plunge”, in so noting that ’tis a random exercise to try and regress a value for Gold based upon geo-politics. After all, since President Nixon’s nixing of The Gold Standard back on 15 August 1971, our 55-year regressing of Gold to the U.S. money supply has served well for valuing the yellow metal, even as its own supply has more than doubled since then. But the following thought has occasionally come to mind, (and doubtless same to many of you, too):
What if — to pay off the StateSide federal debt of now $39T — the Fed merely made an accounting entry of same, and ’twas distributed to all the creditors? To be sure, the “M2” money supply would leap 2.7x from today’s $22T to some $61T. Inflation would become hyper-impalpable. And were it to happen, say, over this weekend, Gold having settled Friday at 4492 would open Monday at 10,606 (by Fair Value precision) … just in case you’re scoring at home. “Got Gold?”
In summary, we offer this from the “Don’t Be That Guy Dept.”: Gold’s double-shot of technical adversity may see price work further low, but to let go of your Gold would be a bad blow!

Cheers!
…m…
www.TheGoldUpdate.com
www.deMeadville.com
and now on “X”: @deMeadvillePro
deMeadville. Copyright Ⓒ 2010 - 2026. All Rights Reserved.
About the author
