
“The trend is your friend.” ‘Tis a time-honoured truism of liquid markets. And as has basically been the case for these past two months — after Gold in mid-winter flirted about in the 5000s — its “trend” on balance has been down.
Yet herein a week ago, even as Gold’s weekly parabolic trend remained Short (as still ’tis) and 21-day linear regression trend remained negative (as still ’tis), we began to wax at least a wee bit bullish. For as ’twas pointed out: Gold’s baby blue dots of regression trend consistency — whilst also still in negative territory — were nonetheless beginning to rise. And you long-time readers know the drill: “Follow the ‘Blues’ instead of the news, else lose yer shoes.”
Accordingly so, the precious metals’ “Baby Blues” began turning upward from the open on 07 May with Gold in turn recording a diminutive +1.7% gain from 4702 to 4783 this past Tuesday … and Silver from 77.83 to 90.11 this past Wednesday, a sterling gain of 15.8% in just five days. Here are the three months of daily bars for Gold on the left and for Silver on the right, the noted respective rallies per each metal’s green line:
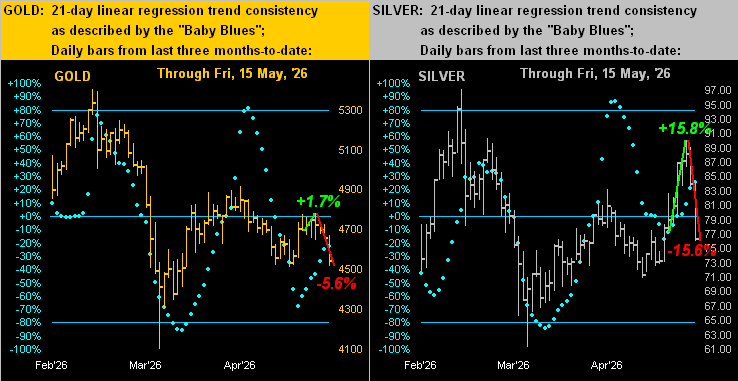
But as the balance of this past week further unfolded per the red lines, there was not enough “grunt in the lump” (motor-racing expression) to maintain what now in hindsight (as herein queried a week ago) was indeed a “relief rally”. For both metals, their overriding weekly parabolic trends have remained Short throughout with Gold sinking into settling yesterday (Friday) at 4544, down as much as -5.6% from its rally peak, and Silver at 76.30, well-down -15.6% from its like peak. As well, we’ll see if the “Baby Blues” too are to lose.
“Well, that’s not a very friendly trend, mmb…”
Squire, it depends upon what side of the trade one is. Surely for the Gold Bulls, downtrends are a period for patience, perhaps to initially (hat-tip charter reader THR) “take some chips off the table”. But for the smart alec Shorts, they fawn upon downtrends as friendly until they all get hoovered away within the next dominant up-leg. (As we ad nauseam quip, “Shorting Gold is a bad idea”).
As to “The Why”, the conventional wisdom of “Dollar strength” gets a degree of just due: the Dollar Index (aka “Dixie”) traded up to its highest level yesterday since 01 April (no foolin’) of 99.245, and there’s room to further rise a bit more to at least 99.400 which would close the 99.400-to-98.975 technical down gap created back on 08 April.
For those of you scoring at home, too much numerical detail perhaps; but the Buck has been getting the bid, and rightly so: because surely the Federal Reserve’s Open Market Committee come their 17 June Policy Statement “ought” vote to raise their Bank’s Funds rate. We say “ought” as the pressure from the Executive Branch not to so do shall be palpable, (as we X’d [@deMeadvillePro] last Wednesday). Welcome to the head of the Fed, Chairman Kevin “The Warrior” Warsh: have a nice term in the political marsh.
Raise rates indeed. For better than a year we’ve herein suggested that “to raise” is eventual if not imminent, even as the FinMedia and Wall Street have worn blinders throughout in perceiving “how many times the Fed will cut rates this year”. Wrong.
Honestly folks, at times we feel as if we’re the last remaining analytical entity that engages in actually doing the math. And the math affirms inflation really and truly is now on the march. Whilst we still await April’s “Fed-favoured” inflation gauge of Personal Consumption Expenditures (due 28 May), the month’s reported measures at both the retail level (Consumer Price Index) and leading wholesale level (Producer Price Index) came in even further above the Fed’s desired +2% bevel. Why, the following chart of annualized inflation for the past 12 months has “RAISE!” written all ’round it!
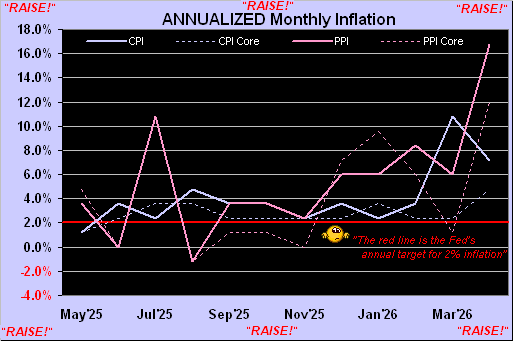
And as is the rule (albeit 2004-2006 was an exception), higher rates make the Dollar more attractive at the conventional-wisdom expense of Gold, (which simplified for you WestPalmBeachers down there means Gold goes down when rates go up). ‘Course, we all know that “Big Oil” et alia are getting the blame; yet inflation was already on the move pre-war, and moreover by the above graphic — assuming that neither do you eat nor drive — the “core” rates themselves are way above the Fed’s targeted +2% shelves. ![]() “Oh Well”
“Oh Well”![]() –[Fleetwood Mac, ’69].
–[Fleetwood Mac, ’69].
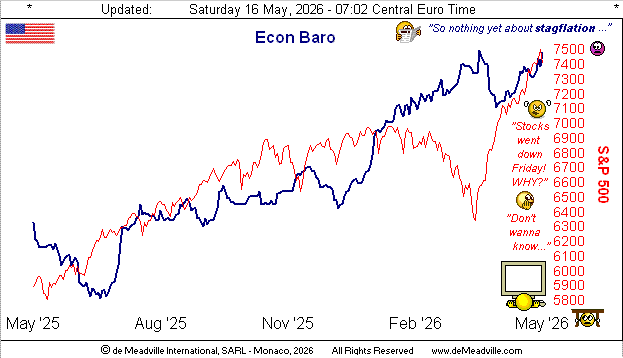
Too, we’ve the Economic Barometer, for which nine of last week’s 15 incoming metrics improved period-over-period, notably therein Industrial Production for April at +0.7%, its month-over-month swing (from -0.3% in March) the best since that for August 2024. But March’s Business Inventories backed up quite a bit for a second consecutive month. Is the moving of product slowing given inflation is growing? (Do we dare again utter the “s” word?) Perhaps not just yet as the Baro is still uptrending:
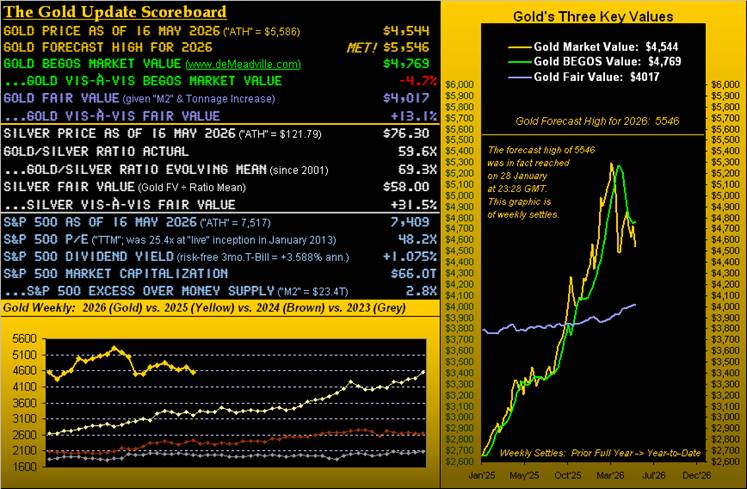
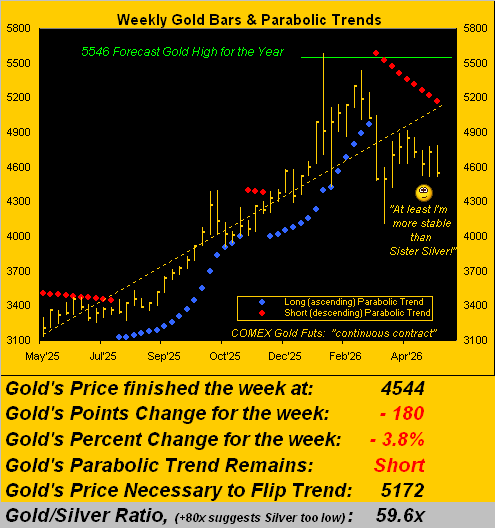
Still, Gold is defying (or at least so trying) its downtrending. To Gold’s weekly bars we go from a year ago-to-date, the red-dotted parabolic Short trend having now completed a ninth week. To be sure, this past week’s net loss of -3.8% was price’s worst since that ending 20 March, indeed the third weakest of the 20 weeks year-to-date. But again, in looking at the rightmost bars, price seems more stable than that through what Silver has suffered. Still, today at 4544, Gold is -628 points beneath next week’s flip-to-Long level of 5172 as noted. And although Gold’s expected weekly trading range is still an ample 329 points (the daily being 107 points), price likely again needs at least two firm up weeks to flip the trend from Short back to Long:
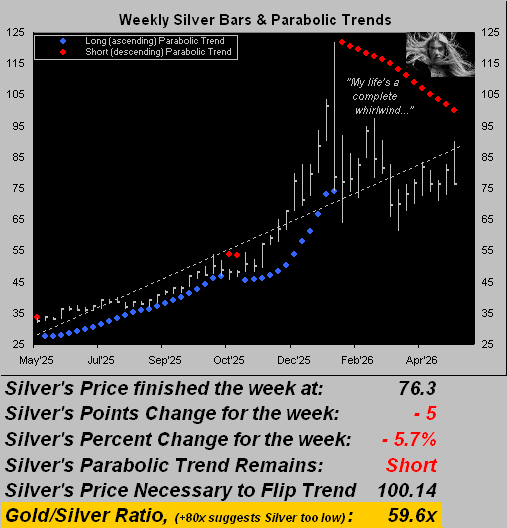
Apropos of mentioning Sweet Sister Silver, here too is her like year-over-year graphic. Silver being far more volatile than Gold, her past week’s net loss of -5.7% comparably ranks sixth-worst so far in 2026, and her parabolic Short trend is now 15 weeks in duration. Poor ol’ whirlwind Sister Silver!
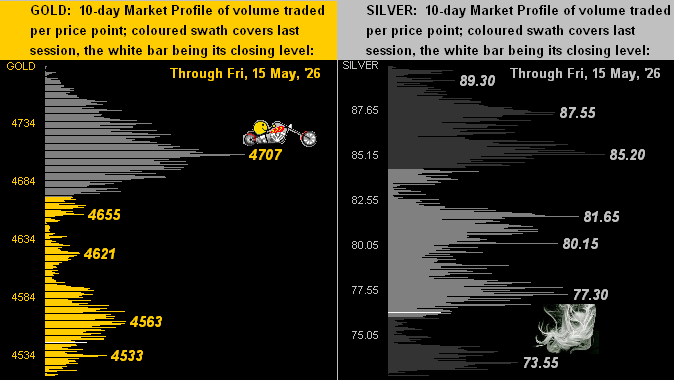
And so to the 10-day Market Profiles we go for Gold (below left) and Silver (below right). For the yellow metal, clearly 4707 has been the volume-dominant — now resistive — price of the past two weeks … oooh steady on there, biker boy. For the white metal, let’s face it … ’tis been a couple of bad-hair days. Temporary as they may be, these have been rather unfriendly trends of late:
Here’s how it all stands for Gold in the stack.
The Gold Stack (continuous contract pricing):
Gold’s All-Time Intra-Day High: 5586 (29 January 2026)
2026’s High: 5586 (29 January)
Gold’s All-Time Closing High: 5411 (28 January 2026)
The Weekly Parabolic Price to flip Long: 5172
10-Session directional range: up to 4983 (from 4510) = +273 points or +6.1%
Gold’s BEGOS Market Value (from our opening “Scoreboard”): 4769
10-Session “volume-weighted” average price magnet: 4667
Trading Resistance: Market Profile notables: 4563 / 4621 / 4655 / 4707
Gold Currently: 4544, (expected daily trading range [“EDTR”]: 107 points)
Trading Support: per the Market Profile: 4533
2026’s Low: 4100 (23 March)
Gold’s Fair Value per Dollar Debasement, (from our opening “Scoreboard”): 4017
The 300-Day Moving Average: 3980 and rising
The 2000’s Triple-Top: 2089 (07 Aug ’20); 2079 (08 Mar’22); 2085 (04 May ’23)
The Gateway to 2000: 1900+
The Final Frontier: 1800-1900
The Northern Front: 1800-1750
On Maneuvers: 1750-1579
The Floor: 1579-1466
Le Sous-sol: Sub-1466
The Support Shelf: 1454-1434
Base Camp: 1377
The 1360s Double-Top: 1369 in Apr ’18 preceded by 1362 in Sep ’17
Neverland: The Whiny 1290s
The Box: 1280-1240
Of non-geopolitical interest in the ensuing week is the Wednesday release of the FOMC’s 28/29 April Meeting Minutes. A bit more hawkish than usual perhaps? We’ll see who’s been really paying attention to the math. And Friday brings for April the Conference Board’s Leading (i.e. “lagging”) Indicators, which have not mustered a positive reading since last July, even as the Econ Baro has essentially risen throughout. ‘Course, ’tis said The Board can go a bit “woke” in its assessments…

Go with the Gold!
Cheers!
…m…
www.TheGoldUpdate.com
www.deMeadville.com
and now on “X”: @deMeadvillePro
deMeadville. Copyright Ⓒ 2010 - 2026. All Rights Reserved.
About the author
