
‘Course, Gold’s year-to-date gain was already gone back on 23 March, only to have in part recovered. But: bang on cue following last week’s piece “Likely Lower Levels for the Precious Metals“, both Gold and Silver began this past week with three consecutive losing days. Into Wednesday’s lows, the yellow metal’s week had declined by as much as -4.3% and that for the white metal by as much as -6.3%.
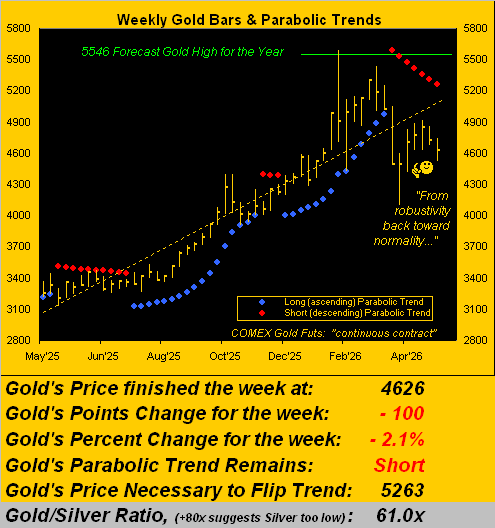
Fortunately, the balance of the week mitigated much if not all of the selling, Gold settling yesterday (Friday) at 4626, “just” -2.1% net for the week, and Silver at 75.84 for a week’s net wee gain of +0.2%. However, might technical pullback further ensue? This calls for further review as herein we’ll do.
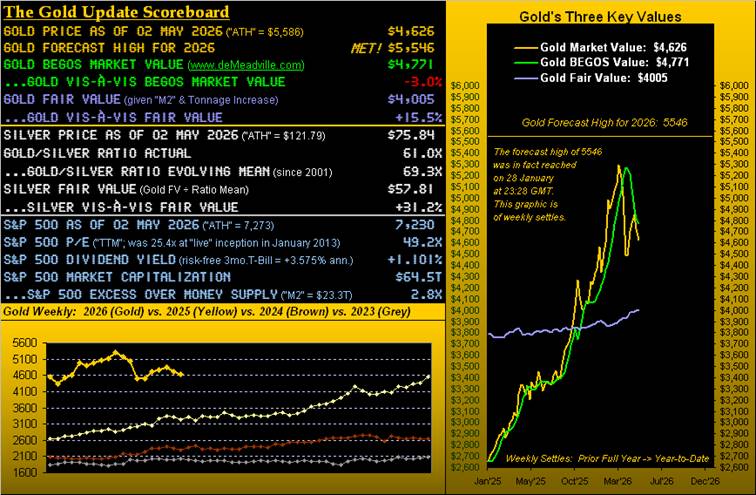
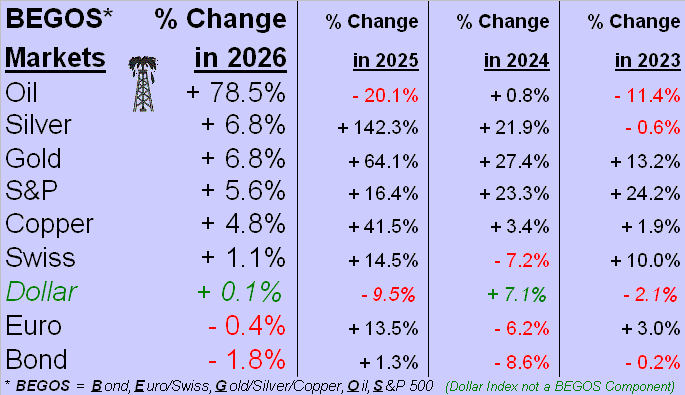
Either way, as we commence the year’s second quadrimestre, the precious metals are — after “Big Oil” — still on the balance of the podium, both now up a like amount to each other per our year-to-date BEGOS Markets Standings. This in spite of come 23 March, as noted Gold had given up the entirety of the year’s gain from 5586 to 4100, a nearly -27% drop at which point price for 2026 was down more than -5%. Yet that was then, this is now:
‘Course, ’tis fair to say that both precious metals have given back the lion’s share of their year-to-date gains: come 29 January, Gold was +28.9% and Silver (deep breath) +71.6%. But by their respective opening Scoreboard Fair Values (Gold’s being 4005 vs. present price of 4626 and Silver’s being 57.81 vs. present price of 75.84), such excessive overvaluation has been unwinding. Below, specific to Gold by its weekly bars from one year ago-to-date, the red-dotted Short trend has just completed its seventh week, (price having started such stint from 5010):
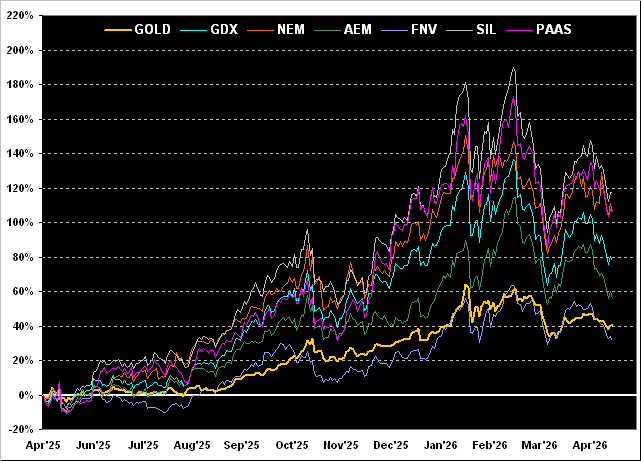
And per usual as ’tis month-end (plus one trading day in May), we’ve our “Live by the Leverage, Die by the Leverage” year-over-year chart of Gold’s percentage track vis-à-vis those of key metals equities. Thus from most-to-least we’ve the Global X Silver Miners exchange-traded fund (SIL) +118%, both Newmont (NEM) and Pan American Silver (PAAS) +106%, the VanEck Vectors Gold Miners exchange-traded fund (GDX) +78%, Agnico Eagle Mines (AEM) +56%, Gold itself +40%, and Franco-Nevada (FNV) +32%. (And those “lower right shoulders” are not looking very promising…). So: is Gold en route back to Fair Value (4005)? The trend is one’s — er uh — friend…
Too, trading range compression has continued. Gold’s trading range this past week was 224 points, second-narrowest of the last nine, as the EDTRs (“Expected Daily Trading Ranges”) for both precious metals have become slimmer still per the next graphic, (for which we remind you WestPalmBeachers down there this is not price direction; rather ’tis expectation of daily price range):
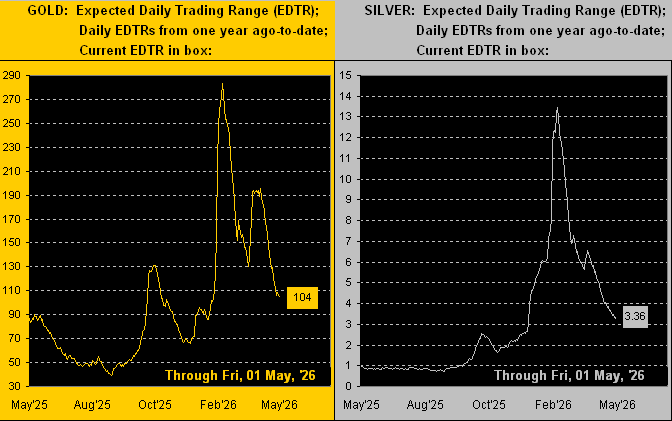
As thereon depicted in the two boxes, Gold’s EDTR going into Monday is now 104 points, only 37% of the expectation for 283 points back its peak on 09 February, and that for Silver is now 3.36 points, just 25% of the 13.46 sought for that same date. As to achieving/exceeding the EDTRs, across the past 28 trading days, Gold has only so done six times and Silver seven. Also notable is a reduction in trading activity: Gold’s average daily contract volume in April was but a scant 65% of that for March, and for Silver ’twas 76%. Cue Pink Floyd’s: “The Narrow Way” –[’69].
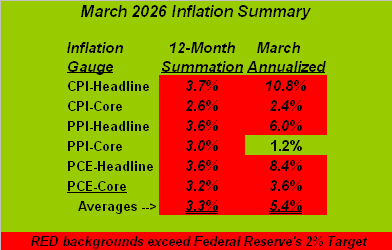
Thus for the precious metals we’ve narrowing trading ranges and reductions in volume. Query: might the Fed have the metals spooked, indeed waiting for what (by the math) we deem as inevitably higher FedFunds interest rates? This past week, the Federal Reserve’s Open Market Committee again voted to maintain its current 3.50%-3.75% targeted rate range as it has since last 10 December (through three subsequent meetings). As is universally recognized, the Fed seeks disinflation of inflation back down to 2%. But per the completed Inflation Summary Table for March, we’re still going the wrong way, the underscored two averages back in February having been respectively 2.9% and 5.0%. Now look at them:
“And the metals don’t like Fed rate hikes, right mmb?”
As a rule of thumb, Squire, that is generally true, or certainly so is the conventional wisdom, (even as both Gold and FedFunds rates rose together from 2004-2006). Either way, there are 32 trading sessions between now and the next FOMC Policy Statement (17 June), and a lot can happen en route. Do mind the website’s “Gold” and “Silver” pages, (especially if you’re scoring at home).
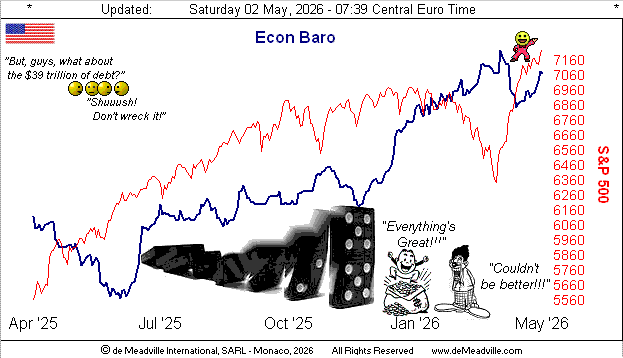
Indeed whilst minding this somewhat cautionary state of Gold, to look at the StateSide economy and S&P 500, everything’s right with the world! The Economic Barometer staged a week of recovery, with 10 of the 16 incoming metrics bettering their period-over-period results, notably so The Conference Board’s April reading of Consumer Confidence, plus March’s Personal Income, Spending, Durable Orders and Housing Starts, whilst the S&P continued to make record highs.
“But, mmb, there’s something not right about that…”
Squire, as said Alice, “curiouser and curiouser”. ‘Tis exclaimed through the FinMedia that this ongoing Q1 Earnings Season is “spectacular!” ‘Course, that depends on how one looks at it. To be sure, of the 297 S&P 500 constituents having thus far reported, 79% have upped their bottom lines from Q1 a year ago, a solid above-average pace of improvement. But because the S&P itself keeps rising, the price/earnings ratio (now 49.2x per the opening Scoreboard) remains far above ultimate acceptability, there being practically no yield left in the Index (1.101%) as opposed to the “risk-free” three-month annualized U.S. T-Bill (3.575%). But as we’ve on occasion quipped, saying at the cocktail party that you invest in treasuries instead of stocks isn’t very sexy; rather ’tis boring: “Yeah? We’ll I own Nvidia, man, ’cause I’m like sooo smart!” Good for you, “man”. (Let’s see how that 40.2x NVDA yieldless P/E works out for ya). Here’s the Baro (blue line) from a year ago-to-date along with the sky-high S&P:
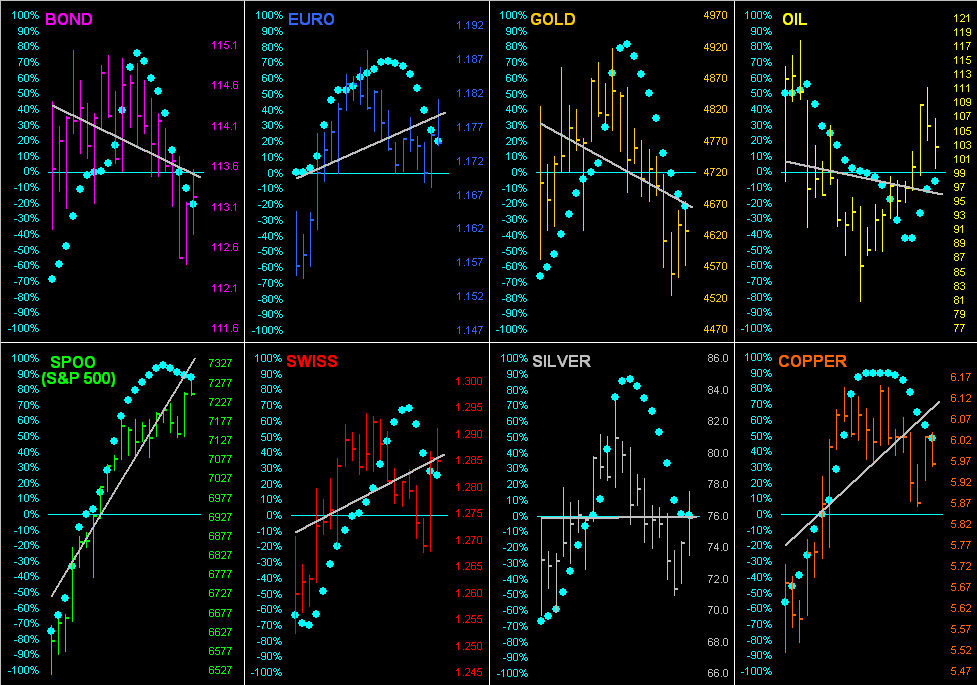
Again, it being month-end, ’tis time to go ’round the horn for all eight BEGOS Markets by their last 21 trading days (one month) including each component’s grey regression trendline and our famous “Baby Blues”, the dots which depict the day-to-day consistency of the trendlines. Such trend for Gold clearly is negative, whereas for Silver ’tis momentarily flat. Obviously that for the S&P 500 (“SPOO”) is in steep ascendence, albeit upon its “Blues” breaking below the +80% level, the next “sell” shall be underway:
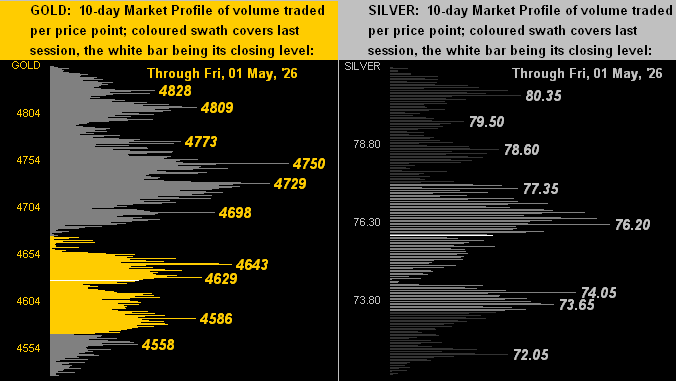
Now we’ve the 10-day Market Profiles for Gold on the left and for Silver on the right. The yellow metal is currently nestled in the lower third of its Profile, basically in the 4650-4500 range. As for the white metal, her nearby range spans from 77.35 down to 73.65, the labels for both metals being the levels with the highest trading volumes in those price areas:
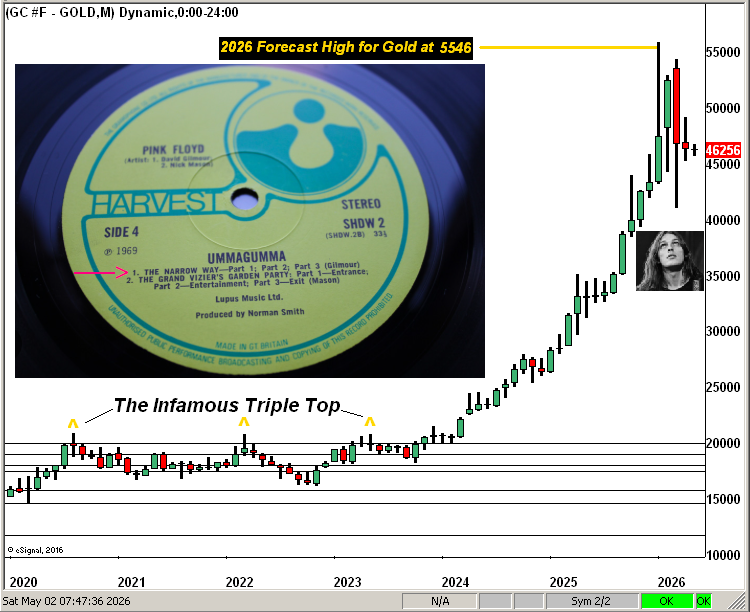
And here we’ve the Gold Structure by the month since the year 2020, (again featuring the Pink Floyd piece as afore-referenced). The right-most “candle” is only the first day for May; however the preceding April candle clearly shows the trading range as having compressed. Yes, David, ’tis narrowed a bit up there:
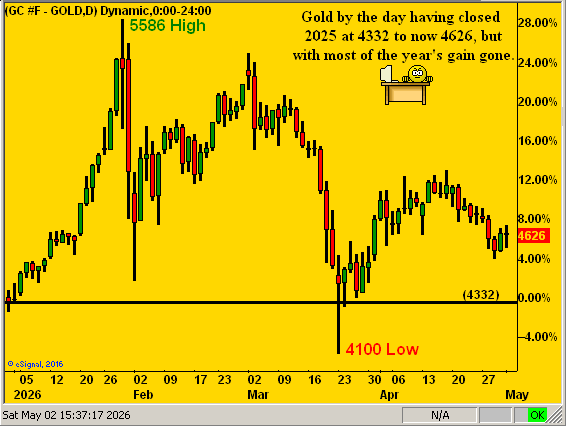
Thus in further review, Gold has given back most of what had been a substantive gain by 29 January of 5586 (+28.9%) to now a vastly reduced +6.8%, albeit having since nicely recovered from March’s 4100 low. To wit, this day-to-day graphic of Gold’s percentage ride since the 4332 (black line) close in 2025, the “lower highs” of both 02 March and 17 April giving at least technical cause for concern:
However, we do not take fundamental pause. Yes, Gold is currently +15.5% above the Gold Scoreboard’s Fair Value of 4005, and could well revisit that level. But hardly shall we allow debasing currency us dishevel!
Cheers!
…m…
www.TheGoldUpdate.com
www.deMeadville.com
and now on “X”: @deMeadvillePro
deMeadville. Copyright Ⓒ 2010 - 2026. All Rights Reserved.
About the author
