
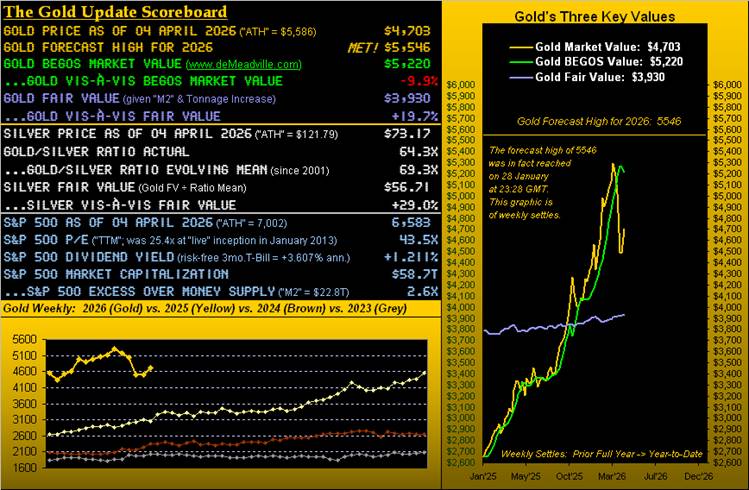
One quarter (plus two days) of the 2026 trading year is in the books, replete with really record-setting Q1 volatility for Gold, price having settled its week on Thursday at 4703 as we above see.
For an otherwise “non-yielding, archaic, ho-hum” hard currency, Gold in Q1 traced a record -1,486 point-range from the recent All-Time High of 5586 (29 January) down to 4100 (23 March), indeed a -26.6% plummet across a mere 37 trading days. Comparably, this century’s second-largest Q1 trading range was +537 points (+20.5%) just a year ago; or second-best percentage-wise, Gold in 2009 amassed a +25.7% low-to-high Q1 run, (albeit by points ’twas “only” +206 from 802 to 1008).
Yet through such rampant Q1 volatility for 2026, we’ve this amazing view from the ” ‘Tis Far Too Early to Blow One’s Own Horn Dept. “
“Oh no, here yer gonna gloat, mmb…”
Now just relax, Squire, and instead recall this opening sentence from our first missive of 2026 (03 January) which read as follows:
- “5546 is our forecast Gold high for 2026.”
‘Twas then followed a number of paragraphs deeper into the piece by:
- “… the potential low coming in at 4136 …”
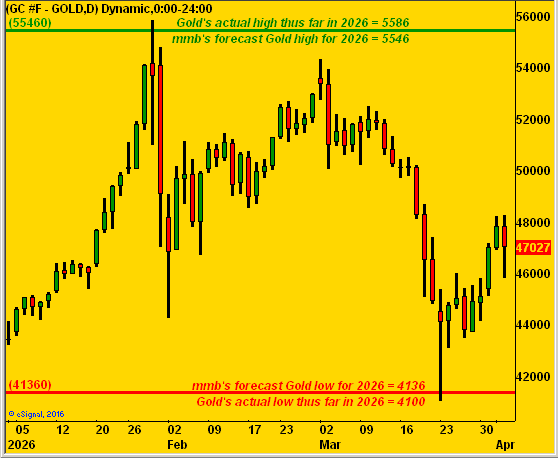
Here is daily Gold year-to-date (63 trading days); duly note therein the labeled green and red lines:
“Yeah but ya gotta think that range is gonna get busted, mmb…”
“Think” is your key word there, Squire. Unknowns abound with 75% of the trading year still in the balance. To wit: next week’s busy economic calendar shall complete our inflation data for February and it doesn’t look Fed-favorable one wit. Energy prices are on the move to the extent we see the FinMedia (finally) having figured out the Federal Reserve may actually have to raise rates as the year unfolds. “Whoopsie!” There’s your Gold negative for lower lows, albeit as we’ve historically herein shown, Gold can rise in stride with rates, (recall 2004-2006). ‘Course if instead money need be created by the Fed to pay back that to which the U.S. has been lent, there’s your Gold positive for higher highs: recall our close from two missives ago:
- ” What if — to pay off the StateSide federal debt of now $39T — the Fed merely made an accounting entry of same … the ‘M2’ money supply would leap 2.7x from today’s $22T to some $61T … [and Gold would be] at 10,606 (by Fair Value precision) … ‘Got Gold?’ “
Moving right along… we just mentioned energy, which given the war has knocked the precious metals from their long-running spot atop our BEGOS Markets Standings. Here’s the table year-to-date, (and no, that percentage gain for Oil is not a typo):
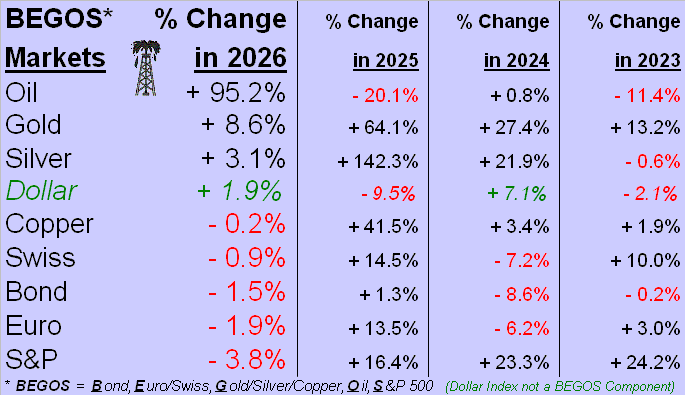
Still, both Gold and Silver are on the podium. But clearly the S&P 500 being -3.8% is certain to cause chaotic confusion for the “stocks only go up” crowd. The chilling news for such “marked-to-market millionaires” is that across the past 50 years, (which for you WestPalmBeachers down there is from 1976 through 2025), the S&P has netted 24% (i.e.12 years) that were negative … but there’s been only one down year in the past seven. Think the S&P is overwhelmingly due for a down year, or two? Reprise Murray Head from back in ’75: ![]() “Say it ain’t so, Joe”
“Say it ain’t so, Joe”![]() . Have a great day.
. Have a great day.
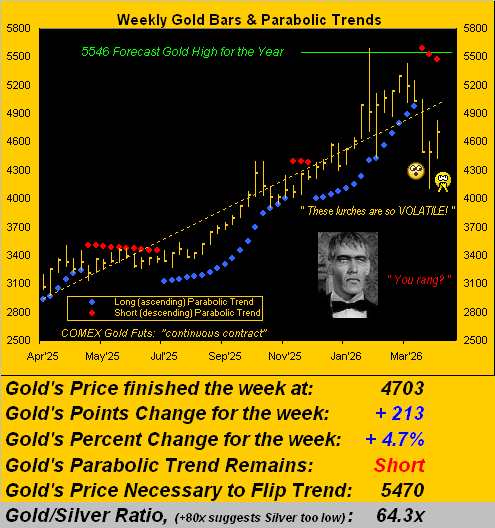
To be sure, Gold’s days are vehemently volatile, indeed as are its weeks per the following year-over-year graphic. The expected weekly trading range for Gold is now 369 points, the daily alone being 196 points. Either way — of which there’s been a lot — the red parabolic Short trend has completed a third dot. But at least Gold’s four-week losing streak is complete, this past week’s +4.7% gain a welcome treat. Moreover, Gold is still “textbook oversold” through the past 13 trading days; that would resolve upon Gold swiftly closing above 4797. ‘Course, by the opening Scoreboard, Gold is nearly -10% below its BEGOS Market Value (5220), but ’tis practically +20% above Fair Value (3930).
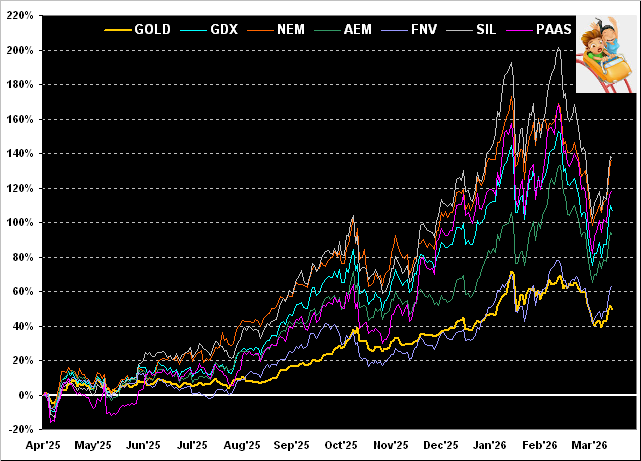
Let’s stay year-over-year in going to our graphic of Gold’s percentage track vis-à-vis those of key metals’ equities. Thus from this time a year ago, Gold has gained +49%, whereas for the leverage-driven equities we find Franco-Nevada (FNV) +64%, Agnico Eagle Mines (AEM) +93%, the VanEck Vectors Gold Miners exchange-traded fund (GDX) +107%, Pan American Silver (PAAS) +118%, Newmont (NEM) +136%, and the Global X Silver Miners exchange-traded fund (SIL) +137%. Quite the roller coaster for the equities boaster!
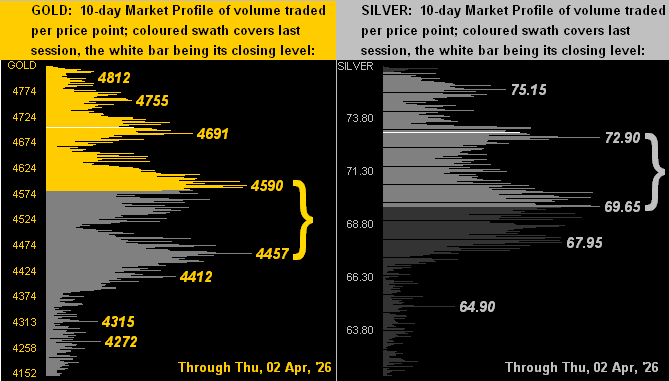
The precious metals’ wild ride is further exemplified by our 10-day Market Profiles for Gold on the left and for Silver on the right, both boasting a big bracket gap. Just a friendly reminder that gravity does work:
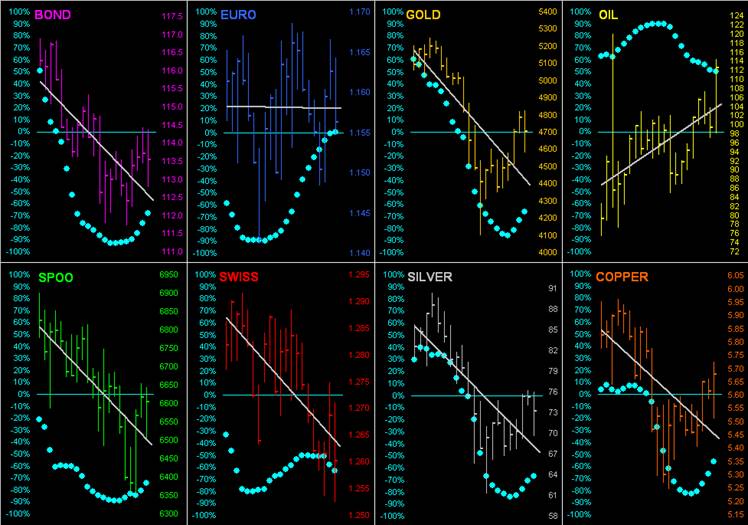
Whereas the above Profiles encompass this last fortnight, let’s too go ’round the horn across the past month by the daily bars for each of our BEGOS Markets. Notice that — again save for Oil — the balance of the bunch have negatively-sloped grey regression trend lines. Also, as regular website viewers know, the baby blue dots depict the consistency of the respective trends. And per the maxim “Follow the Blues instead of the news, else lose yer shoes”, the rising “Baby Blues” for both Gold and Silver are indicative of their respective downtrends becoming less consistently so as the trendlines become more shallow. We thus may see still higher metals’ prices in the ensuing week:
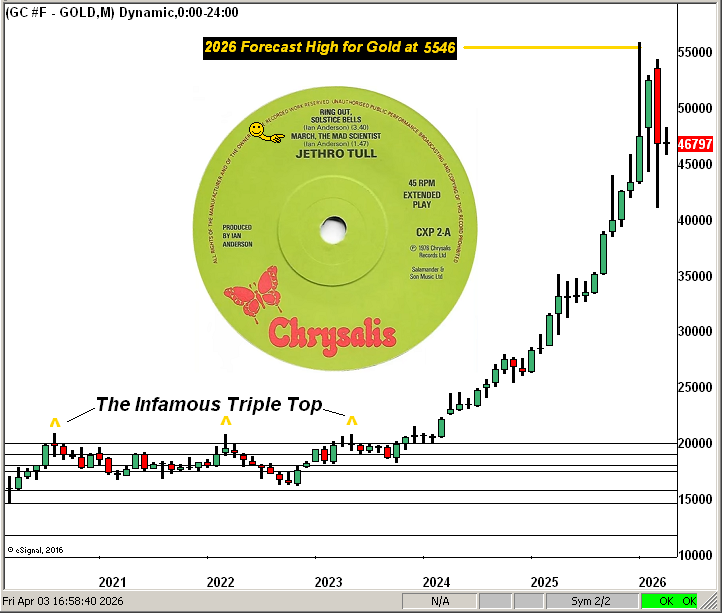
Now again, it being month-end, ’tis our own trend to present Gold by its monthly bars since 2020. And per ![]() “March, the Mad Scientist”
“March, the Mad Scientist”![]() by Jethro Tull from 50 years ago, this past March for the Gold bulls was maddening. ‘Tis the second right-most “candle”, which as jarringly red as it appears, finished March well off the aforementioned 4100 low. Then the right-most wee “doji” is this April’s two trading days pro tanto, (a little Latin lingo there). Here’s the whole show:
by Jethro Tull from 50 years ago, this past March for the Gold bulls was maddening. ‘Tis the second right-most “candle”, which as jarringly red as it appears, finished March well off the aforementioned 4100 low. Then the right-most wee “doji” is this April’s two trading days pro tanto, (a little Latin lingo there). Here’s the whole show:
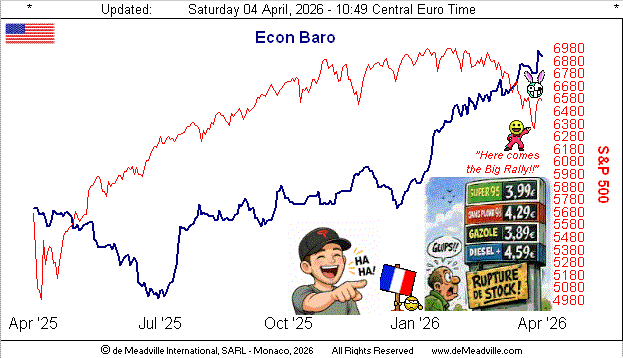
As for the Economic Barometer — on balance in ascent since last July — ’twasn’t too much of a surprise yesterday (Friday) to see the best Non-Farm Payrolls creation since March a year ago. ‘Course, the growing economy in tandem with increasing prices doesn’t auger well for a FedFunds rate cut anytime soon, with instead perhaps (as noted) a rate rise should energy prices further fuel inflation. On this side of the pond, petrol is getting pretty pricey. We’re told that just down the coast in San Remo, its four filling stations went dry last week. Meanwhile StateSide, the past week’s stream of 13 incoming Econ Baro metrics found eight having improved period-over-period, notably including (in addition to March’s job growth) February’s Retail Sales. Here’s the picture from a year ago-to-date, the Baro in blue and S&P 500 in red, (and as earlier shown, year-to-date in the red):
All that said, next week is the commencement of Q1 Earnings Season. You’ll recall those for Q4 found 71% of the S&P’s reporting constituents having improved their bottom lines from the like quarter a year earlier. Can such above average pace be maintained? The Baro suggests yes, but an ongoing energy crisis can eventually erode earnings. ‘Course as we oft quip, if earnings today were properly used as an equities’ valuation tool, the S&P would be half its current level, (the current price/earnings ratio still a whoppingly high 43.5x). But: ’tis different these days (until ’tisn’t).
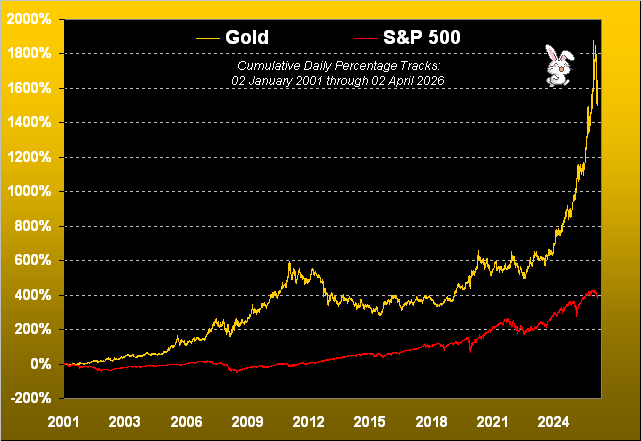
In the meantime — for those of you scoring at home — the S&P 500 (pre-yield) is +399% century-to-date (or with yield, nearly +500%); the yieldless relic — vehemently volatile Gold — is +1,618%.
So what’s in your bunny basket?
Cheers!
…m…
www.TheGoldUpdate.com
www.deMeadville.com
and now on “X”: @deMeadvillePro
deMeadville. Copyright Ⓒ 2010 - 2026. All Rights Reserved
About the author
