
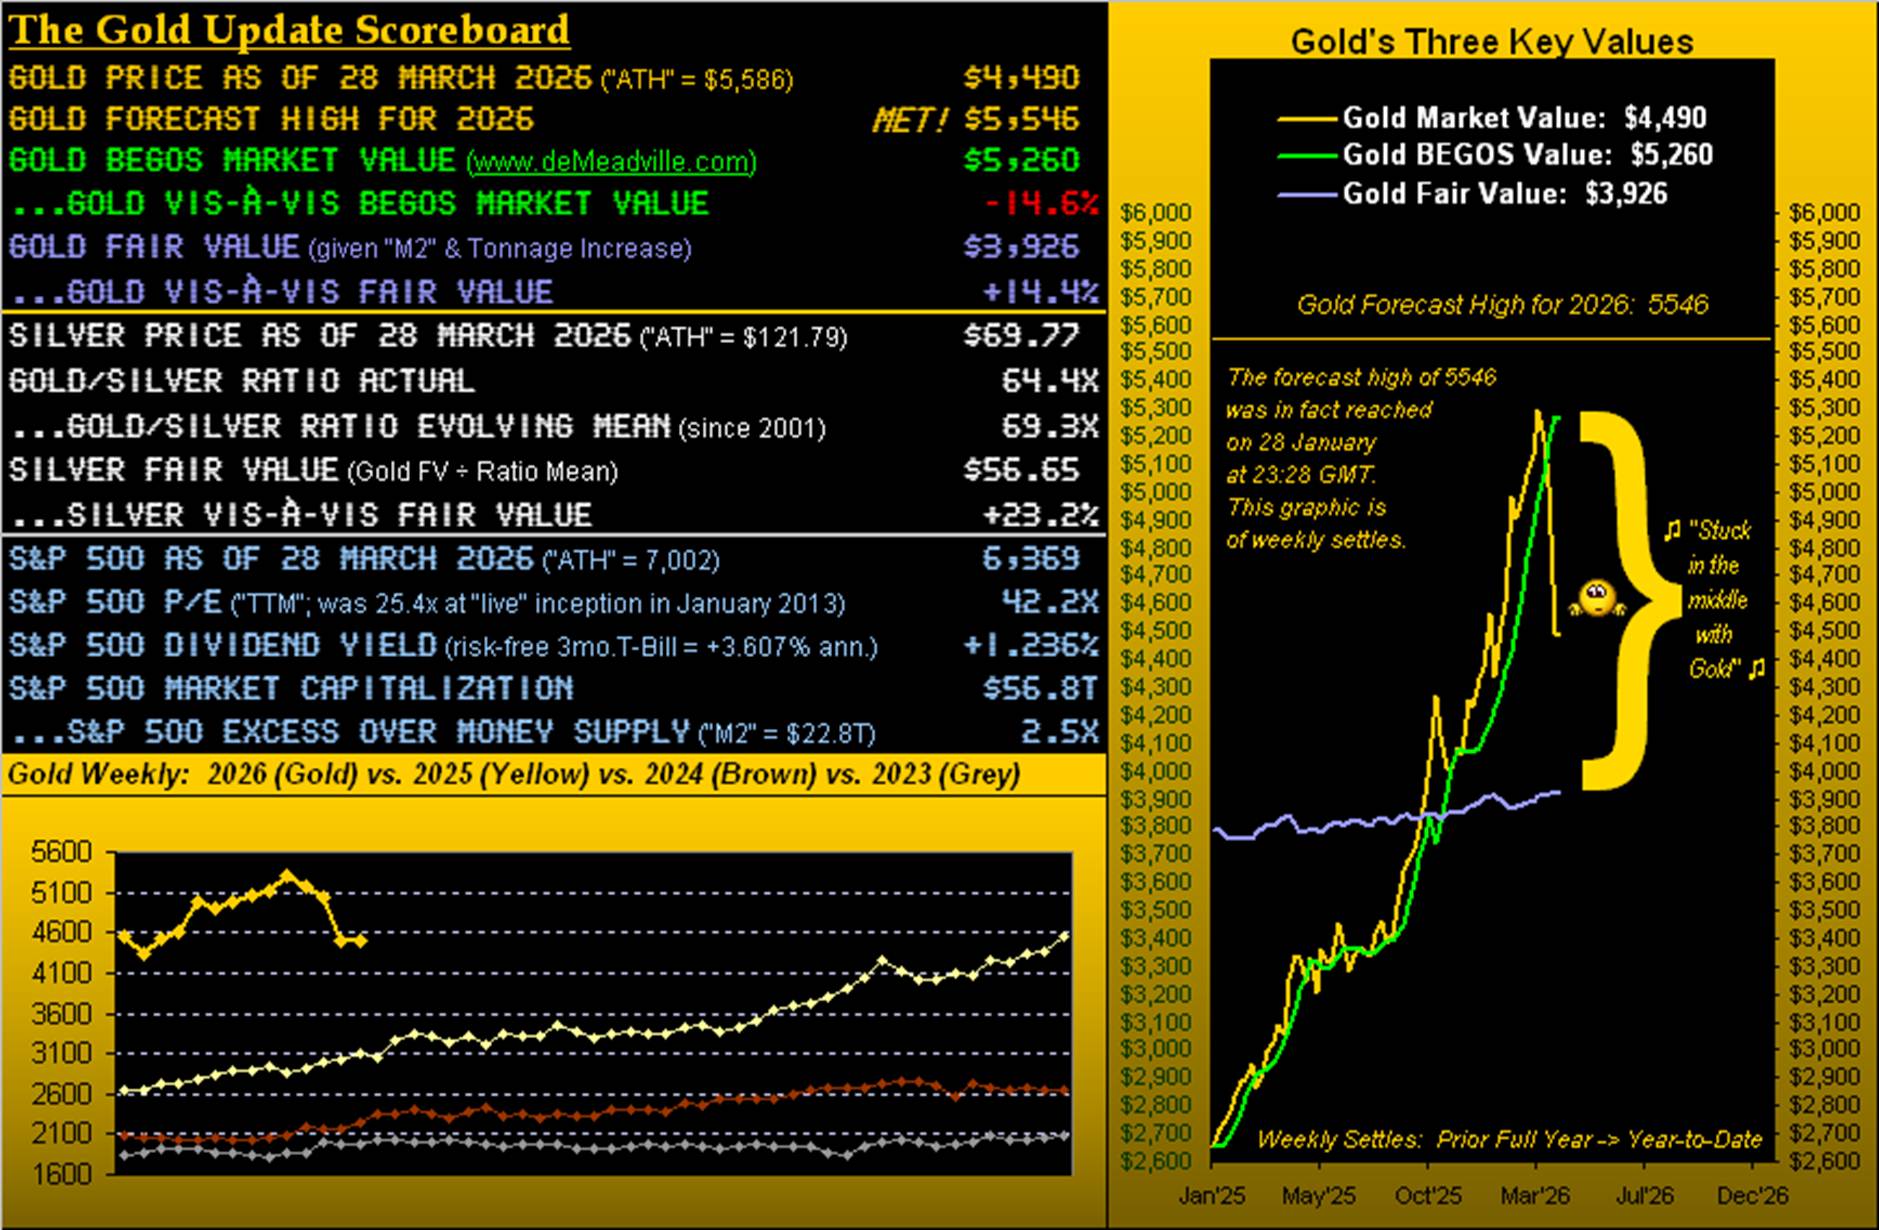
In two trading-days time, 2026 shall be 25% complete. And as was calculated back at New Year, our expected yearly trading range for Gold in 2026 came to 1410 points between the low and high. Or by percentage range, were the low to come first, the high would later be +34.1% above the low, else if vice-versa, the low -25.4% below the high, (the latter directionally being the case year-to-date).
But so far through not quite three months, the range has already surpassed our expectation in spanning 1486 points, or -26.6%, from the 29 January high of 5586 down to the 23 March low of 4100. More on Gold’s extremes vis-à-vis what we had precisely forecast come next Saturday’s month-end/quarter-end piece; (a shameless plug, that).
To be sure, from the “Means Reversion Dept.” — barring your having slept through last Monday’s trading session — that day’s low of 4100 was a “mere” +5.4% (+210 points) above Fair Value of then 3890. We say “mere” as by Gold’s All-Time High of 5586, price at that instant was +43.0% (+1681 points) above Fair Value of then 3905; (the latter has since slipped a tad given the immaterially periodic refining of the money supply).
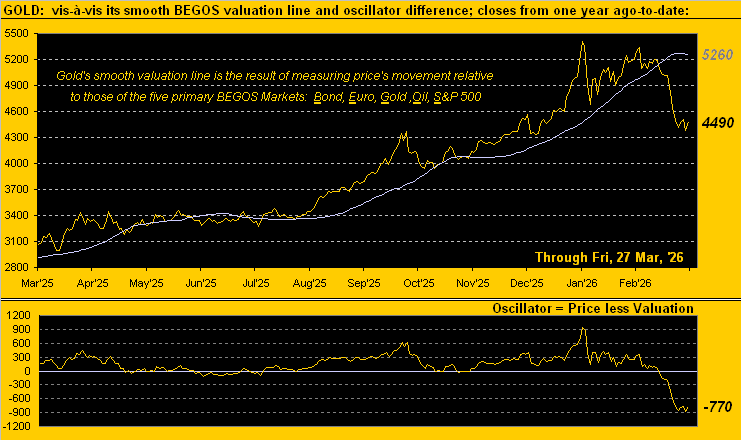
Either way, in settling the week yesterday (Friday) at 4490, Gold per the above opening Scoreboard is now fundamentally +14.4% (+564 points) above Fair Value, but technically is nearly an identical -14.6% (-770 points) below its BEGOS Market Value. Cue “Stuck in the Middle with You” –[Stealers Wheel, ’72]. Cue, too, Gold’s year-over-year track and — just now rolling over — smooth BEGOS valuation line per our proprietary view:
More commonly used by the investing/trading community at large are “textbook technicals”, our preferred cocktail comprised of John Bollinger’s Bands, blended with Relative Strength and infused with Stochastics. And such concoction now finds Gold as “textbook oversold” through the past nine trading days.
“But there’s new contract premium coming in, right mmb?”
Certainly so, Squire, as contract volume on Gold is rolling from April into June which adds +33 points of fresh premium to price (by the so-called “continuous contract”) as we go into next week.
‘Course such premium gets lost in the shuffle given just how broad Gold’s trading ranges have become: price’s expect daily trading range is now 193 points (updated nightly at the website), and the weekly is expected to trace 359 points.
That’s a lot of points. For example: to trade one COMEX Gold contract (by which you control 100 ounces of Gold) today requires initial margin of just $31,671; (for you WestPalmBeachers down there, that is called “leverage”). In the new week — assuming the range were to work out with your impossibly being perfectly price prescient in buying the exact low and selling the exact high (or vice-versa, albeit as we always say “Shorting Gold is a bad idea”) — you’d gain +359 points valued at $100/point, i.e. +$35,900 … which added to your initial margin would thus increase your account by +113% to $67,571. That’s within one week, just in case you’re scoring at home. (Disclaimer: get it backward and you shan’t be around anymore).
What hasn’t been around for some time in The Gold Update is one of our infamous pop quizzes. So let’s go with one. Ready?
- Gold just completed a fourth consecutive down week. When was the last time that happened? Extra credit: What is Gold’s largest weekly down streak so far this century?
“The last time, mmb, was in February 2023, right?”
Correct you are, Squire. And the for the extra credit?
“Ummm … there’ve been three streaks of seven weeks each in ’04, ’15 and ’16, yes?”
Folks, this is why Squire got the job. Spot on, mate. But let us not procrastinate, as we move on to the weekly bars from one year ago-to-date — which of late have not been looking so great — even as price yesterday settled well off the week’s low:
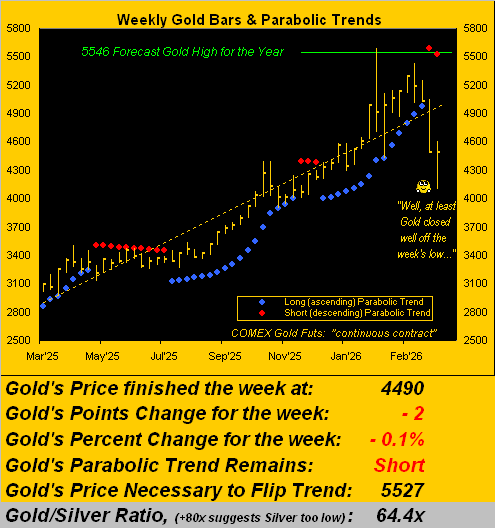
Yet, as therein noted, Gold’s fourth consecutive down week was only a loss of -2 points, as from the 4100 low, price bounced back to now 4490. Still, the distance from here to the ensuing week’s parabolic “flip-to-Long” price of 5527 requires a rise of +1037 points, nearly triple the expected weekly trading range (359 points). So realistically, the current red-dotted parabolic Short trend likely has at least a few more weeks to run.
Toward choosing a technical study for Gold, from the “Benefit of Hindsight Dept.”, the website’s Market Rhythms page currently depicts 28 studies (of 45 tested nightly) which meet the list’s qualifications. The best of that bunch up to now (through 10 tests) are Gold’s daily Parabolics: as the last 10 signals have alternated back and forth between Long and Short (careful), each trade “would have” achieved a minimum of 48 points of profit. ‘Course, you’re on your own with Market Rhythms as again, ’tis all in hindsight. Still, the webpage encompassing all our BEGOS Market Rhythms is updated each night.
Updated daily as well is the Economic Barometer, for which the past week was fairly muted: the Baro collected just eight incoming metrics of which three bettered their respective prior period. Positively, the StateSide Current Account Deficit for Q4 ($190.7B) was the lowest since COVID-stricken Q1 for 2021. As for the Baro’s weak link from last week, ’twas Q4’s Productivity revision from +2.8% down to +1.8%; (our ever-productive Squire hates it when that happens). Here it all is from a year ago-to-date, ahead of 14 metrics due for next week’s slate:
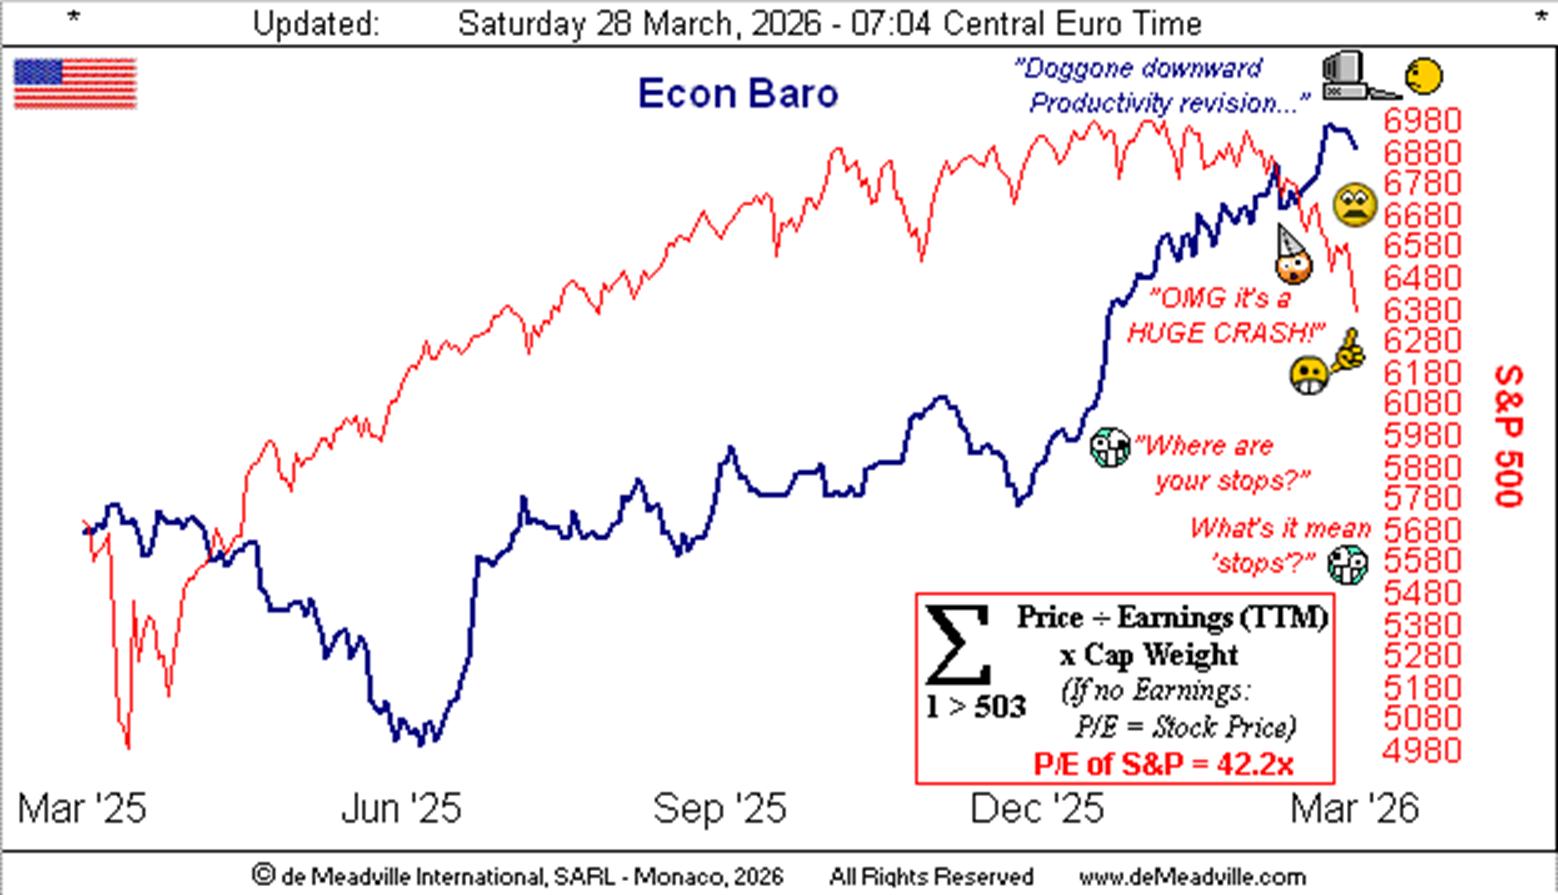
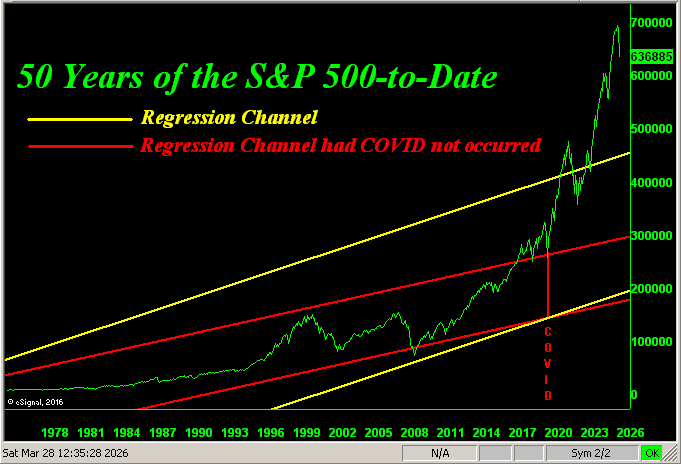
Therein too we see the S&P 500 which from its record high of 7002 (28 January) is today at 6369, a rather mild correction of -9%, and yet the price/earnings ratio is a ridiculously high 42.2x. ‘Course to market “newbies” and the children’s writing pools of the FinMedia, this recent sag is a cataclysmic crash. Therefore toward maintaining perspective, here is our updated chart of the S&P 500 across the past 50 years: note the current rightmost “world-ending” down hook. To be sure, war-elicited lack of energy can severely put the screws into the economy, meaning lower corporate earnings. Oh yes, ’tis been a good number of years since earnings were actually regarded as a valuation tool for equities. But perhaps the effects of the war shall bring common sense back to pricing, which per the following graphic would be between the yellow regression channel lines, (for as you well know, everything ultimately reverts to the mean):
Meanwhile, let us drill down into Gold. Here we’ve the following two-panel graphic of the yellow metal’s daily bars from three months ago-to-date on the left and 10-day Market Profile (by June contract pricing) on the right. Query: when Gold’s baby blue dots of regression trend consistency broke below +80% (price wildly overvalued up there), did you (to quote charter reader THR) “take a few chippies off the table”? In looking at the Profile, we see nearby support for Gold as labeled at 4457 with resistance at 4598:
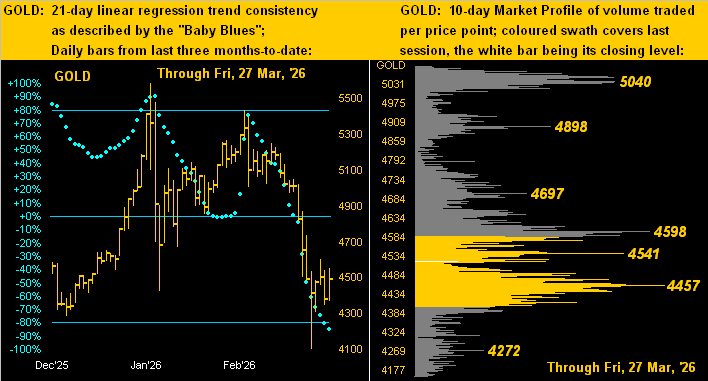
We’ve heard quite a bit of banter this past week about buying Gold sub-4000. But you know how that goes: whilst all await such desired level, price never gets there. That said, although a return by Gold to Fair Value (now 3926, itself in ascent these past nine weeks) would be an attractive entry/add level, we reprise the great Richard Russell: “There’s never a bad time to buy Gold!”
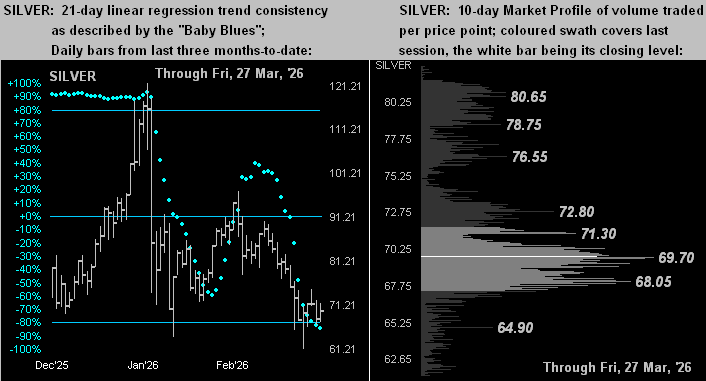
As to “poor ol’ Sister Silver” we can say the same as regards her “Baby Blues” (below left), their having broken the +80% axis back on 02 February. And by her Profile (below right), now priced at 69.77, the white metal is basically at her most volume-dominant level of the past fortnight (69.70 as labeled). As for Silver’s Fair Value? Per the opening Scoreboard she’s presently +23.2% above such 56.65 level:
So there we have it: Gold today at 4490 is nearly equidistant between its BEGOS Market Value (5260) which has just begun to descend, and its Fair Value (3926) which is in ascent. So as to where Gold travels near-term, whilst fundamentals remain the ultimate driver of price, the swifter technicals are negative in many respects. As noted earlier for guidance, Gold’s best trading studies are comprehensively tested every night in order to qualify at our Market Rhythms page. Regardless, as herein emphasized, Gold is basically at the midpoint between our two critically important valuation metrics. But in this case, being stuck in the middle clearly is good (dare we say) “Fortuna”!
Cheers!
…m…
www.TheGoldUpdate.com
www.deMeadville.com
and now on “X”: @deMeadvillePro
deMeadville. Copyright Ⓒ 2010 - 2026. All Rights Reserved.
About the author
