
Notwithstanding +23 points of fresh premium as COMEX Gold rolls from the June contract into that for August, there’s no mistaking price having formed a classic near-term double-top. Here ’tis:
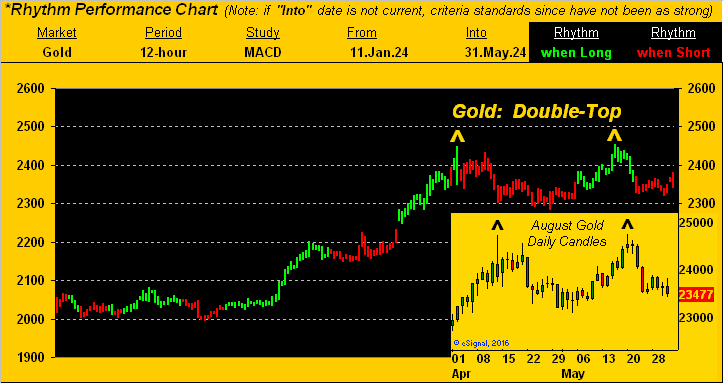
The above chart tracks Gold by its 12-hour bars from nearly the beginning of this year-to-date. (The inset at lower right is by Gold’s daily candles specific to the August contract for the past two months). And stark thereon is the double-top (both being chronological All-Time Highs) achieved at 2449 on 12 April and again at 2454 on 20 May. The rationale for displaying the double-top per 12-hour bars is — that by price’s 12-hour MACD (moving average convergence divergence) — such study presently ranks as Gold’s best Market Rhythm for taking signals followed by profit. Green bars indicate price when the MACD is Long and red bars when Short, the latter as you know being a bad idea; (profitability results of this study are included on the website’s current Market Rhythms list).
The key point of course is that double-tops in major markets are prime for selling (be it by humans or algorithms), which — in spite of our being broad-based bullish on Gold — has been our near-term bearish analytical slant given the abrupt downtrend from that 20 May All-Time High at 2454. Indeed since then, Gold has dropped (basis the June contract) from 2454 to as low as 2321 (-133 points or -5.4% in just eight trading days). Now by the August contract having settled yesterday (Friday) at 2348, should 2309 go, the 21 March high of 2263 ought come into play … just in case you’re scoring at home.
More importantly, what’s coming into play in the words of Bloomy last Wednesday is “Revived Hike Chatter”. For some irrational reason, the FinWorld just seems to be figuring that out now. However, we’ve regularly herein been musing since the start of this year about the Federal Reserve ~~perhaps~~ having to raise rather than cut interest rates. The difference between ![]() “Us and Them”
“Us and Them”![]() –[Pink Floyd, ’73] is simple: we do the math; the FinWorld parrot one another. And by the math, inflation remains on the move as below summarized in our April table:
–[Pink Floyd, ’73] is simple: we do the math; the FinWorld parrot one another. And by the math, inflation remains on the move as below summarized in our April table:
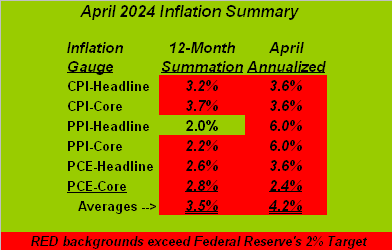
Therein are the three major measures of StateSide inflation: the Consumer Price Index (CPI), Producer Price Index (PPI) and “Fed-favoured” Personal Consumption Expenditures Price Index (PCE), all listed with both their headline and attendant core readings. The left column is each category’s 12-month summation and the right column is April’s data annualized. Now look at the two averages, bearing in mind the Fed’s inflation target is 2%: for the 12-month summation ’tis 3.5%; but for April’s annualized paces ’tis 4.2%. Which for you WestPalmBeachers down there means: “We’re going the wrong way…”
So is the StateSide economy. Recall our penning a week ago: “…the Baro looks to be lower still in a week’s time as stagflation creeps ‘cross the nation…” Cue Tag Team from back in ’93: ![]() “Whoomp! (There It Is)””
“Whoomp! (There It Is)””![]()
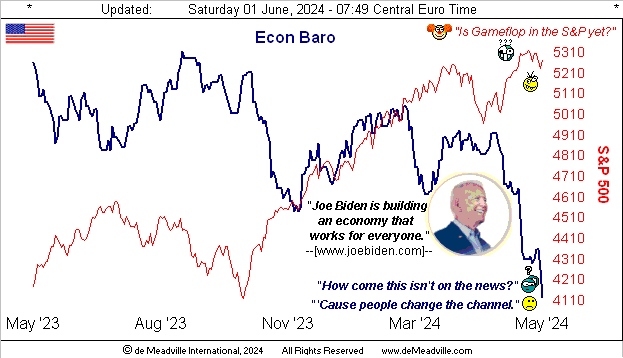
‘Course, the FinMedia are all excited — assuming you neither eat nor drive — that the Fed-fawned-over Core PCE for April was only 0.2%, (i.e. the annualized 2.4% in the aforeshown inflation table). Nevertheless: the economy by the Econ Baro is fading, whilst living costs are rising. Stagflation. To be sure: “revived hike chatter” may lend to near-term Gold negativity on the notion the Fed could actually raise rates; but the emboldened “S“-word firmly lends to broad-based Gold positivity given the need to print dough to keep everyone whole … especially should U.S. Secretary of the Treasury Janet “Old Yeller” Yellen yet again be yelling she’s short of funds to pay interest on the nation’s $34T in outstanding securities, (riskless though they are, right?).
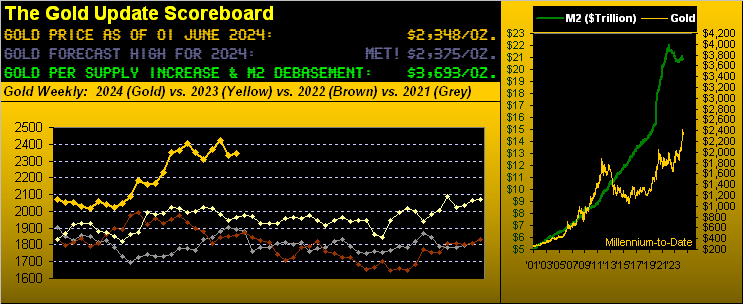
“So mmb, how can we visualize $34T?“
Simply by math, Squire. One Dollar bills lined up end-to-end take $2,276 to cover one mile. So, to line up $34T would cover 14,938,488,576 miles. The annual average distance from Earth to Neptune is 2,703,959,960 miles. Thus the “dollar distance” of $34T is 5.5x that distance to “Big Blue”; ’tis a lot of dollars.
Now it being month-end, we’ve still more graphic richness to present. And if memory serves, never have we seen the BEGOS Markets’ Metals Triumvirate dominate the Standings year-to-date: atop the framed podium — and ever-deservingly so — is Sister Silver, followed by Copper and then Gold. ‘Tis such a beautiful thing that we’re actually tearing up a bit:
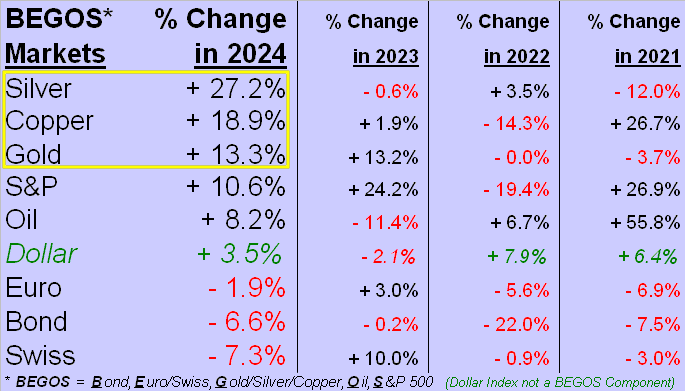
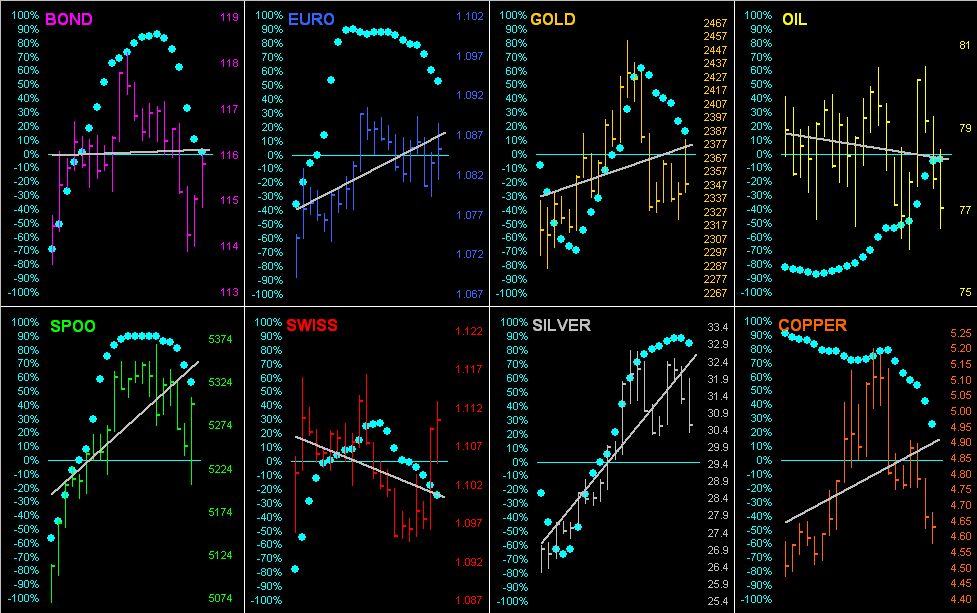
Whilst in vein (but never in vain) with our BEGOS Markets, drilling down into the past trading month (21 days) here are their bars with the ever popular “Baby Blues” that depict the day-to-day consistency of the grey trendlines. To wit, save (barely) for Oil, the Blues ’round the horn are in descent. And “when money is coming out of everything”, ’tis anticipative of the oxymoron “Dollar Strength”. That in turn hints at higher interest rates, albeit upon the Federal Open Market Committee’s Policy Statement a week Wednesday (12 June), their sitting-on-hands likely continues. Regardless, here’s the “What’s happenin’ now”:
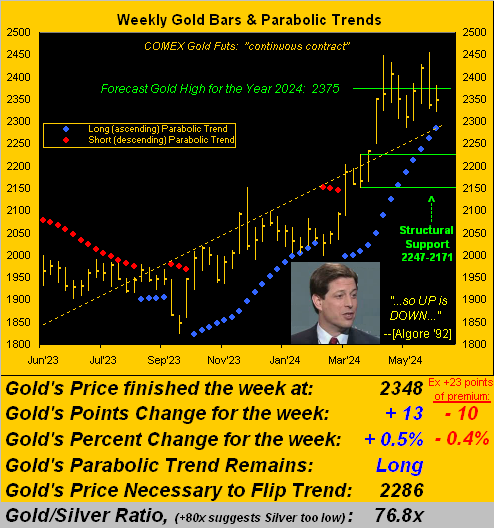
Specific next to Gold’s weekly bars, the rightmost one benefits from the aforementioned +23 points of August contract premium, (which over these next two months shall whittle away at a rate of about -0.5 points per trading day). Either way, this year ago-to-date “continuous contract” graphic is indicative of Gold having had a modest up week (+13 points) when in fact it had a modest down week (-10 points). But at the end of the day, given Gold’s EDTR (expected daily trading range) is now 36 points, that difference at best is noise. Note therein the blue-dotted parabolic Long trend (now 13 weeks in duration) shall flip to Short above the remindful 2247-2171 structural support zone:
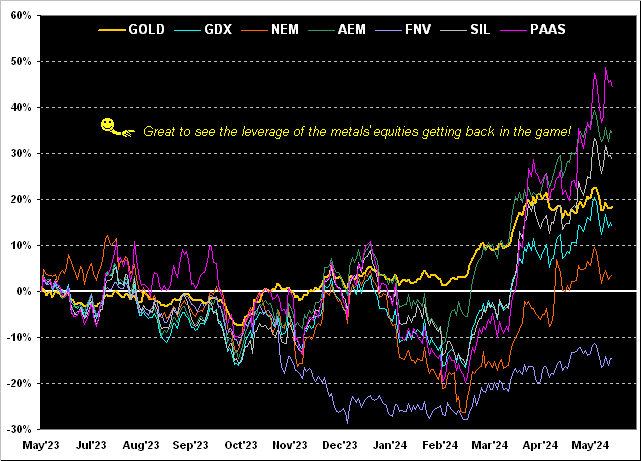
Staying with the year ago-to-date theme, our pro-metals’ equities readers are finally getting some desired vindication. In recent month-end missives wherein this like graphic appears, Gold oft has been ahead of its equites brethren. Yet now, ’tis getting out-performed by a few of the crew. From least-to-best by their percentage tracks we’ve: Franco-Nevada (FNV) -15% (but in a recent uptrend), Newmont (NEM) +3%, the VanEck Vectors Gold Miners exchange-traded fund (GDX) +14%, Gold itself +19%, the Global X Silver Miners exchange-traded fund (SIL) +29%, Agnico Eagle Mines (AEM) +34%, and Pan American Silver (PAAS) +44%. Suffer by leverage, but live well by same:
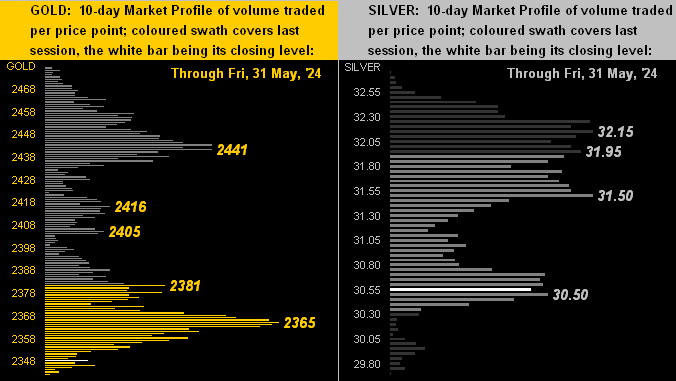
Meanwhile, similar to what we saw a week ago, by their respective 10-day Market Profiles price remains low in the stack for Gold (calibrated to the August contract) on the left and for Silver on the right:
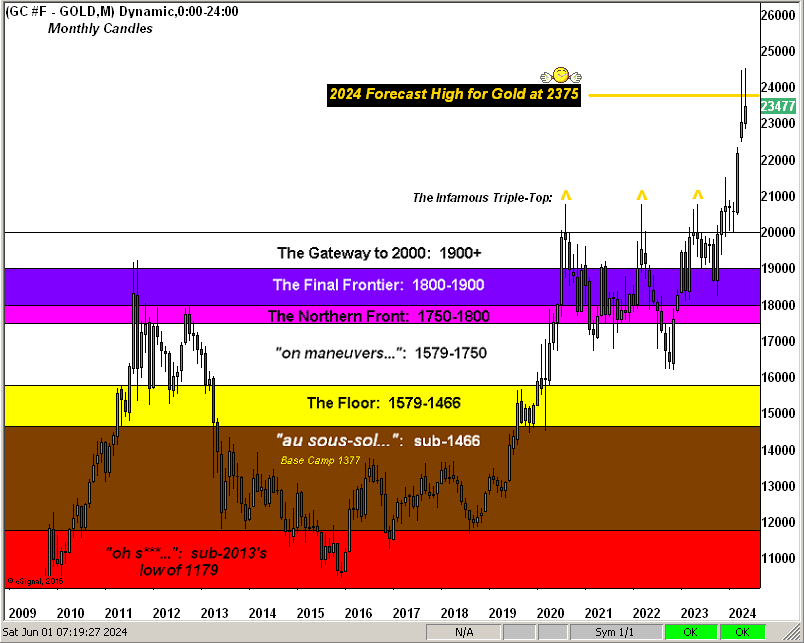
And as ’tis our wont to say, ‘twouldn’t be month-end without our big picture view of Gold’s stratified structure by the month across these past 16 calendar years:
To wrap: with each passing week, more and more internet information (or “bilge” if you will) builds toward financial end-times, part and parcel of which would include our “Look Ma, no money!” S&P crash. ‘Course this being big election years coinciding both on this side of the Pond (five-year Parliamentary) and StateSide (four-year Presidential), the hype of “Well, it’s the election, you know…” already is quite rife. But even were it not, the following macro-prudential fact remains: the S&P 500 is priced at nearly double its earnings support, whilst Gold is priced at nearly half its Dollar debasement valuation. And as we’ve demonstrated ad nauseum throughout 16 years of these weekly missives, price inevitably reverts to valuation. Therefore, near-term price plop or not: hopefully your Gold is well-guarded when sought!

Cheers!
…m…
www.TheGoldUpdate.com
www.deMeadville.com
and now on “X”: @deMeadvillePro
deMeadville. Copyright Ⓒ 2010 - 2024. All Rights Reserved.
About the author
