
Inflation finally proved the point I’ve been drumming, which is that it has been rising for months. The mainstream financial media missed all of that, but it did report that inflation came in quite a bit hotter than people were expecting. Because the lunatic stock market thought inflation was over and was expecting it to come below 3% for the first time in many months, the market got hit between the eyes with a stone and fell like a stone, too.
Stocks plummeted more than 500 points on the Dow. Bigger drops percentage-wise came in the S&P and NASDAQ. In one big plunge, the S&P fell well below its new 5,000 level, having held above that level for a mere two days before doing as I said it was likely to do:
When stocks break through a major barrier like this, they tend to settle down below it for awhile after.
That may well be it. The top may be in (though the delusions have proven indefatigable for months). Recent actions felt like a sea-change—like the way a top feels when Wile E. Coyote realizes he’s run out past the edge of real support.
Whether stock investors realize what this report really showed or not, it’s clear financial writers missed the most important revelations, so let’s dig into those.
Digging Deeper to find the truth that matters
If you keep digging beneath the simple fact that inflation headline numbers still came in lower for January than they had in December, you can find the troubling turn I’ve been talking about. The market was expecting the CPI headline number to finally fall beneath the 3% milestone (from 3.4% in Dec.) and settle at 2.9% for Jan. Instead, what the market got (and we all got) was a headline number of 3.1%. The market was not happy that it did not get to exhale a big “At last, we’re below 3%!” Most of recent market action was probably just that kind of superficial observation of a market getting persnickety about not getting what it wanted.
If the market sees deeper than that, it will know it got worse.
First, the headline inflation number graphed out like this:
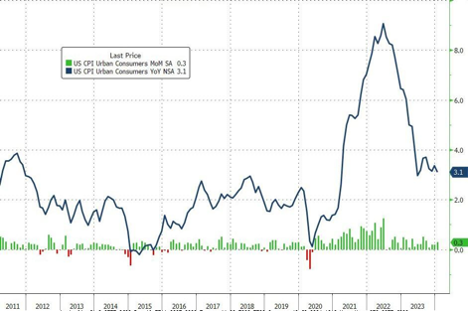
The end of that line clearly looks like the Fed’s battle against inflation has stalled out. It looks like things are subtly trending back upward as they bounce along a new floor.
But that’s just the good number—the one that most people pay attention to and the one that put in the best show. The numbers the Fed pays most attention to look worse.
I have noted for months now that one of the reasons inflation looks like it is going downward is people keep looking at the last twelve months where the fall in inflation is helped out by ten, eleven and twelve months ago when inflation was falling faster. So, the twelve-month average keeps falling because of how much those earlier months were falling—just falling at a slower rate.
Take a look at the three-month annualized rate or six-month annualized rate goin forward for each of the past few months, and things are getting worse each month because those figures don’t have any benefit from months when the Fed was actually getting somewhere. Here is what I mean:
The 3-month annualized rate of inflation actually rose to 4% now from 3.3% a month ago. The 6-month annualized rate rose to 3.7% now from 3.2% a month ago. In other words, if inflation keeps going as it has, each annualized period is getting worse because month-on-month inflation has been getting worse in small ways, as I’ve noted since summer.
Here’s one of the small ways it is getting worse, except that it is not small at all from the Fed’s point of view because it is happening in the numbers the Fed looks at most intently while the rest of us are fixated on the headline number.
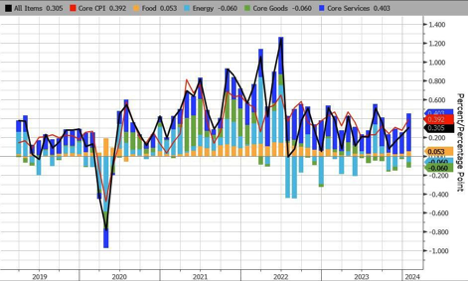
First, on the surface of those YoY numbers that tend to look better, Core CPI fell below 4.00% for the first time since May of 2021; however, the +3.86% YoY print was hotter than the 3.7% that the market expected, so the market was non-plussed about that. Not as non-plussed, however, as the Fed is likely to be because …
On a monthly basis, prices rose 0.4% MoM, which was the highest rise since April of last year. (The changes each month keep getting worse, and, as I’ve been saying, if you keep adding up worse month-on-month inflation, eventually, the new year-on-year numbers start looking worse, too.)
This is core inflation we’re talking about, which does not include food or energy. It does, however, include shelter, which I’ve said all along the way is a hugely lagging number, running a good year behind what is really happening; and shelter put in the worst showing of all components. The return to rising housing prices that happened many months ago is finally showing up in CPI. It’s not that shelter didn’t still slow a tiny bit, but that it was by far the highest component at a rate of 6.09% for rent and 6.15% for homeowners (compared to Dec. levels of 6.47% and 6.15% respectively). The rate at which the number is coming down however, became minuscule—almost impossible to see at the end of this graph:
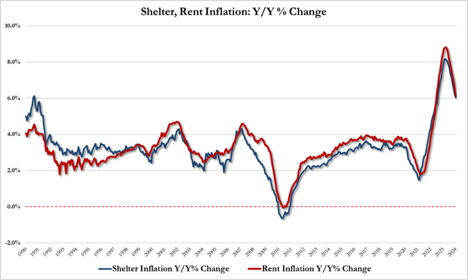
With a magnifying glass, you can see a turn in the blue line at its very tip, which was the change from last month to this. And those are the YoY numbers that have tended to look better than MoM numbers.
Looking at the MoM numbers, we see, again, that there is a clear new rising trend:
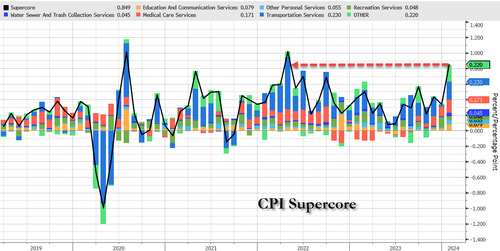
Now, however, we get to the really important number for the Fed—its favorite number:
SuperCore (Core CPI Services minus shelter) soared 0.7% MoM, which was the its largest leap since Sept. of 2022. That looked like this:
A BIG jump up.
And it looked bad as a YoY number, too:
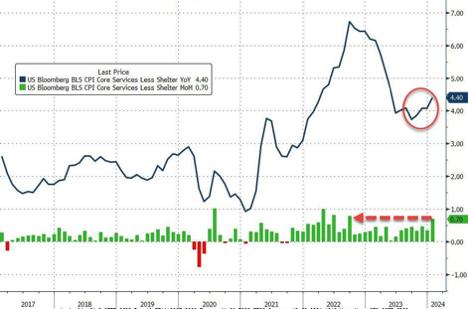
A clear upward turn in the number the Fed likes best.
So, it looks like that March pivot is pretty well blown out the door as inflation keeps holding the Fed's feet to the fire and burning up its backside, as I’ve said inflation would do. With the broken labor market cutting the Fed no slack as a gauge it also pays a lot of attention to, the Fed will have no excuse to do anything but continue to hold interest rates higher than banks can withstand for longer than they can withstand.
One would think this might be a stressful time for stocks and bonds which spent the last quarter betting otherwise on inflation and rate cuts. Still, a few tweaks of the leading algorithms and a few gurus to deliver a new narrative about how the Fed will pivot in June might get the old mojo back. The soothsayers will return to their soothing tomorrow; but surely it has got to be getting harder and harder to pretend reality doesn’t exist or to ignore all the parts of it that you don’t like.
For those shorting the market, it was a good day. Buy-the-dippers, on the other hand, got head-whacked with a tire iron. Zero Hedge, of course, pretended they saw all of this coming, even though they were one of the biggest proponents of a Powell pivot in March due to inflation falling and the economy probably getting ready to bust open.
I wouldn’t doubt the last part of that; but any return to easing when the banks go bust and the economy lies in ruin because of all the busts isn’t going to look any prettier than the start of the Great Recession for stocks.
Now ZH says,
CPI's hot, too damned hot! And being too hot, marked the death of hope for March rate cuts, forget May rate-cuts, at the moment the first cut is priced-in for June... and as of today's less than 4 rate-cuts for the whole of 2024 (in fact just a 50% chance of 4 cuts, conditioned on 3 cuts). As a reminder, in mid-January (a month ago), the market was pricing in 170bps of cuts in 2024, now its half that...
Yes, it is, and this the one publication that has been telling you everything that just became news for the past half a year and predicting it would come for over a year so you would know it was coming when nearly everyone was saying otherwise.
About the author


David Haggith is the publisher/editor-in-chief of The Daily Doom.
Economic, Social and Political News of Our Troubled Times -- a non-partisan daily collection of the most consequential stories about our complex times from multiple sources around the world plus daily editorials like the one you read here.
Liked it? Take a second to support David Haggith by subscribing on Substack!