
While events are still changing very rapidly, there is a chance that the war in Ukraine will lead to some of the highest rates of inflation in the United States of our lifetimes. Increases in energy prices resulting from supply shortages are likely to be the core, but much higher costs for food, fertilizer, and many basic commodities are also possible. There is also the issue of cyber attacks creating further supply shortages.
Making it worse is the problem that we already have inflation persisting at levels not seen since the 1970s. There are some very important lessons from this previous period of high inflation when it comes to what is currently happening, lessons that have either been forgotten or were never known in the first place.
A particularly important lesson is what the relationship can be between stock prices and inflation. Stock prices can look like they are setting new highs. But once we take inflation into account, the real value of stock investments can be setting new lows, even while the newspapers report a series of new highs.
In this analysis, we will look at the current S&P 500 since inflation began its recent surge in 2021 - and see something we have not seen in many years. What looks like respectable stock gains are in fact, stock losses, when inflation is taken into account.
We will then go back to the 1968 to 1982 period - the last time we saw persistent inflation this high - and we will find the hidden risk to the stock market that is not discussed by the media or those selling stocks. One of the worst secular bear markets in history occurred, with a 70% loss in purchasing power, but to this day very few are aware, because of the illusion of price gains that was really just the plunging value of the dollar.
This analysis is part of a series of related analyses, which support a book that is in the process of being written. Some key chapters from the book and an overview of the series are linked here.
Recent Hidden Stock Losses
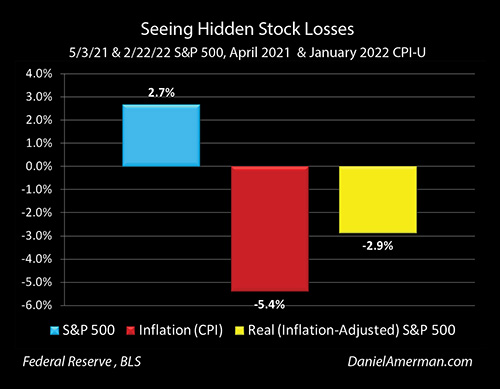 The blue bar in the graph above shows the percentage gain in the S& P 500 between May 3, 2021, and February 22, 2022, which was 2.7%. As far as how most of the world sees stocks, stocks were ahead for this period by almost 3%.
Until that is, we take inflation into account. As shown with the middle red bar, inflation reduced the purchasing power of the dollar by about 5.4% during that approximate period.
When we start with 102.7%, the ending value of the stocks, and we multiply times 94.6%, the ending value of the dollar, then we end up with a purchasing power for our investments of 97.1%. We didn't gain 2.7% - we lost 2.9%.
However as far as the IRS is concerned (related analysis link here), we didn't lose almost 3%, but we gained almost 3% - and taxes will be due on those gains. The U.S. government helps create inflation, and then it taxes us on our self-defense, on any attempts to just maintain our purchasing power, whether it be with stocks or gold.
We have not seen a relationship like this between stocks and inflation since the early 1980s - because inflation has not been this high for forty years.
(The dates above were picked to try to capture the change in inflation that occurred in 2021. As explored in the July of 2021 analysis linked here, the persistent change in inflation as reflected by the CPI began in May of 2021. The May 3rd start date for the S&P 500 in this analysis was the first business day of that month. The February 22nd end date for stocks was the last market close prior to the Russian invasion of Ukraine, so it cuts off any related market gyrations. The April 2021 CPI is used as the start for the inflation measure, as the May inflation had not yet occurred. The January CPI was used as the end for the inflation measure, as it was the most recent available as of the preparation of this analysis.)
How Inflation Hid A 70% Market Loss: 1968-1982
The danger is that once control is lost - it is very hard to bring inflation back under control. Indeed, history in the modern era in the United States does contain a very good example of what can happen to long-term investment returns when control has been lost over inflation and employment. Consider the following graph.
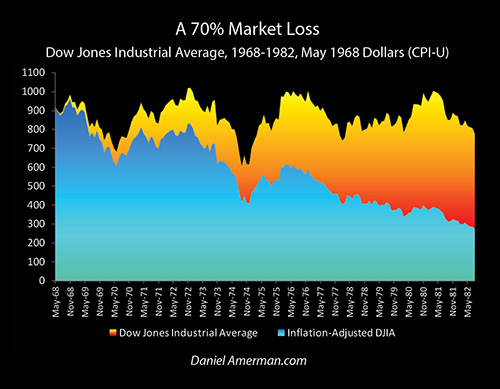
As shown in the yellow/orange (and moving to the DJIA), the Dow Jones Industrial Average reached 919 in May of 1968, and by August of 1982, had fallen to a level of 777, for a loss of 15%.
Many investors recall this "Lost Decade" for the stock market when the market stayed flat to somewhat down - moving sideways but never persistently up, and what is seen in yellow is consistent with that market perception.
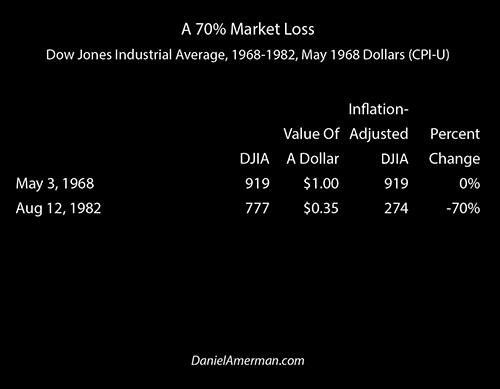
However, the reality is that a 15% loss in a long-term sideways market isn't what happened at all, not when we look at what a dollar would buy. That is, in 1982 the US dollar was only worth 35 cents compared to what it would have bought in 1968, because the dollar had lost 65% of its value to inflation.
As shown in blue in the graph, when we adjust the August 1982 Dow index of 777 to account for a dollar being worth 35 cents, then the real value of the Dow drops to 274. So when we consider the purchasing power of the dollar, then our stock portfolio wasn't flat, not even remotely close. Instead, it had dropped by a staggering 70% in fourteen years, from 919 to 274.
Now while this 70% decline in the value of what our assets would buy for us was entirely real, to this day many of us don't realize just how bad it was. That is because inflation in prices was hiding deflation in investment values. The 65% plunge in the value of the dollar "hid" most of the 70% plunge in the value of stocks, with most of the surface value of the Dow index by 1982 consisting of dollars that were worth far less than what they had been before.
This perspective from the 1970s could be vital for the 2020s as well. Many investors are concerned about the possibility of stocks plunging - but with high rates of inflation, stocks don't have to plunge in order to turn retirement or other long-term financial plans upside down. Stocks could be exactly where they are a decade from now, but if we've had another high rate of inflation over that time - the lifestyle that can be supported from them could be off by another 70%.
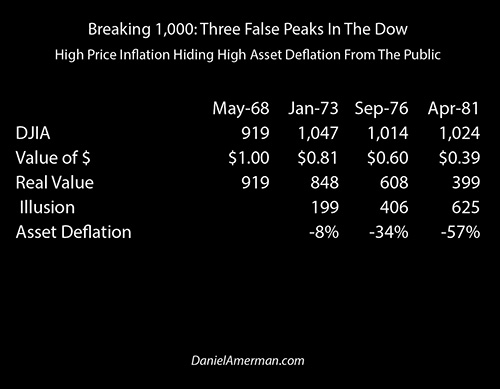
Three False Peaks & Inflation Hiding Deflation
Even though long-term asset deflation of 70% (in real terms) was the result of persistently high unemployment coupled with inflation, many investors and newspaper readers of a certain age may not remember the 1970s that way at all. Instead, they may recall three powerful bull markets when the Dow repeatedly flirted with the "magical" 1,000 mark. Each surge filled innumerable financial columns with the hopes that the good times and a long-term bull market had returned again, with those hopes being quickly dashed as the market repeatedly proved unable to sustain itself above the 1,000 level.
Perceptions don't change reality, however, which is that there never were three bull markets, but rather only an inflationary illusion fooling the public. Indeed when we look closely, instead of seeing three peaks, we will see three historical object lessons in how destroying the value of money can hide the destruction of the value of assets - and repeatedly fool the headline writers along with much of the investing public.
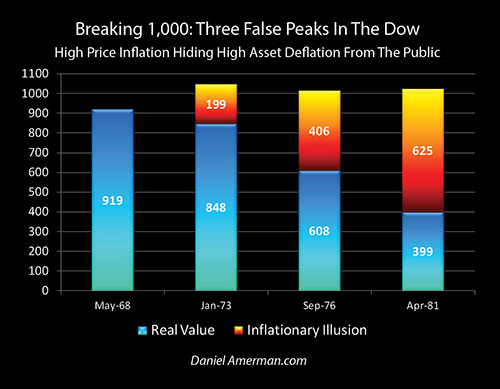
The cold reality of the Dow adjusted for inflation is shown in blue. There aren't three interim peaks, but merely a market moving steadily and powerfully down.
The "bull market" that peaked in January of 1973 when the Dow hit 1,047 - was in a reality a fall to Dow 848 (asset deflation in inflation-adjusted terms), that was masked by the dollar being worth only 81 cents when compared to May of 1968 (price inflation). Inflation had created an almost 200 point illusion in the Dow.
The "bull market" that peaked in September of 1976 at 1,014, really represented the Dow falling by over 300 points - translating to asset deflation of 34% - which was hidden from savers by the illusory profit created as a result of the dollar dropping in value by 40% (price inflation).
The cruelest illusion of all was the "bull market" of April of 1981 when the Dow finally reached 1,024. This is because the real value of the market had fallen to 399, and a 57% destruction of the purchasing power of investor assets was being entirely hidden by the 61% destruction of the value of investor dollars.
Fully understanding this relationship of simultaneous price inflation and asset deflation is absolutely essential for financial survival, because there is a reasonable chance that we may all be seeing multiple "bull markets" in stocks in the 2020s - but it won't necessarily work the way investors today think it will.
A Double Failure In Protection
The problematic relationship between stocks and inflation is not just confined to stocks. If stocks are having problems, then in classical investment theory, that is the time when the investor is supposed to be able to rely on the safety of their money market funds.
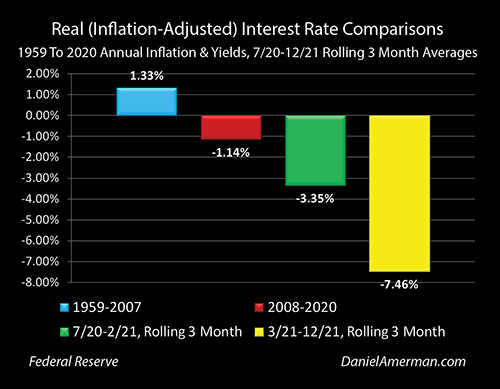
As shown above and explored in the analysis linked here, we also have a major problem with money in the bank, or savings in money market accounts. It looks like our money is all still there - but when we take inflation into account, it no longer is. We are instead currently losing real wealth at a quite rapid rate, even if it looks like our money is staying the same.
We're not currently getting diversified protection from inflation, but rather our investments are failing to protect on both sides. What the 1970s quite clearly show is that diversification to protect from market risk does not necessarily protect against inflation risk. Instead, both sides can lose together, and they can quite reliably lose together over the full course of a secular cycle of ten years or more.
There are solutions. Some of the very best can be found in "The Homeowner Wealth Formula" (link here), which shows how high rates of inflation were turned into wealth on a highly reliable basis throughout the 1970s and 1980s.
To see the solutions, we have to first pierce the illusions, and see what is actually happening with the purchasing power of our savings. The historical experience was a 70% long-term loss in real wealth that almost no one knew about it as it was happening - because it wasn't there on the surface, and the media (generally) was not talking about it. Instead, to this day we could have what could be called the fictional creation of the three bull markets.
The high rates of inflation are back. And so are the fictional bull markets. What history shows is that both could be with us for a long time to come. Hopefully, this analysis has been helpful to you in distinguishing between historical facts and common fictions.

This analysis contains the ideas and opinions of the author. It is a conceptual and educational exploration of financial and general economic principles. As with any financial discussion of the future, there cannot be any absolute certainty. While the sources of information and the calculations are believed to be accurate, this is not guaranteed to be true. This educational overview is not intended to be used for trading purposes, those making investment decisions should do their own research and come to their own independent conclusions. This analysis does not constitute specific investment, legal, tax or any other form of professional advice. If specific advice is needed, it should be sought from an appropriate professional. Any liability, responsibility or warranty for the results of the application of the information contained in the analysis, either directly or indirectly, are expressly disclaimed by the author.
About the author

Daniel R. Amerman is a Chartered Financial Analyst and the author of a number of books on finance and economics.
Mr. Amerman is a finance MBA with over 30 years of professional financial experience. As an investment banker he did groundbreaking work in the such areas as CMO/REMIC originations as part of portfolio restructurings for financial institutions, and the creation of synthetic securities for institutional clients. As an independent quantitative analyst, he has provided structural, analytical and mathematical verification services for investment banks, trust departments, and rating agencies.

This analysis contains the ideas and opinions of the author. It is a conceptual and educational exploration of financial and general economic principles. As with any financial discussion of the future, there cannot be any absolute certainty. While the sources of information and the calculations are believed to be accurate, this is not guaranteed to be true. This educational overview is not intended to be used for trading purposes, those making investment decisions should do their own research and come to their own independent conclusions. This analysis does not constitute specific investment, legal, tax or any other form of professional advice. If specific advice is needed, it should be sought from an appropriate professional. Any liability, responsibility or warranty for the results of the application of the information contained in the analysis, either directly or indirectly, are expressly disclaimed by the author.