
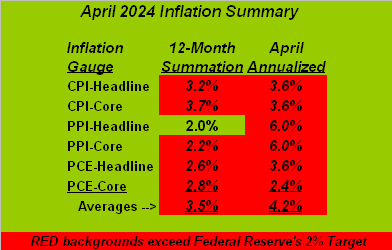
We start with inflation. Year-to-date we’ve diligently documented that ’tis nowhere near the Federal Reserve’s sought 2% target. And not that you need be reminded, but with May inflation readings commencing next week, let’s briefly reprise April’s inflation summary as herein presented a week ago. The data speak for themselves:
Now a week hence, Friday’s StateSide jobs report for May had “inflation” written all over it: per the Bureau of Labor Statistics, the pace of Hourly Earnings doubled from +0.2% in April to +0.4%; the net increase in Non-Farm Payrolls was the largest year-to-date and incorporates those higher wages; and yet (wait for it…) the rate of Unemployment nonetheless ratcheted higher from 3.9% to 4.0%! How does that happen? Cue the late great Bullet Bill King: “Holy Toledo!”
Query too, how does this happen? On Thursday, the Governing Council of the European Central Bank cut 25 basis points on each of its Deposit Facility, Main Refinancing Operations, and Marginal Lending Facility rates … even as the leader of their pack Mme. Christine “Risky” Lagarde stated that “domestic inflation remains high” despite increased confidence for a “disinflationary rhythm”, (which she shan’t find on our Market Rhythms page, but we digress…)
Still, the annualized pace of inflation on this side of the Pond increased from +2.4% in April to +2.6% in May. Regardless: the ECB cut, (following ten across-the-board rate hikes dating back to 27 July 2022).
The bottom line in our mind: the optics are the ECB cut rates not because ’twas the right thing to do, but rather because they’re expected to so do. Oooooh. And will that come back to bruise? Or shall the Fed dare follow suit? We think not (yet), but stayed tuned…
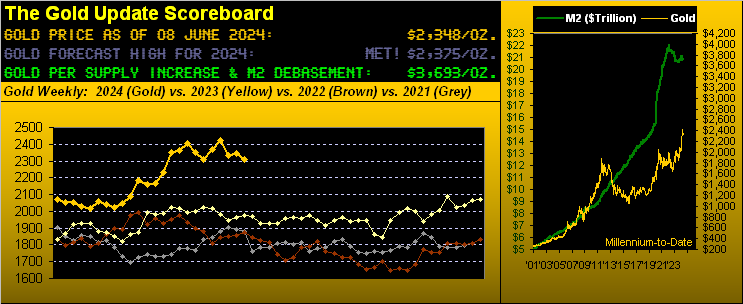
Still being bruised as anticipated is Gold: our near-term negative stance remains in force as it has been through the prior two missives. Per this week’s title “Inflation’s Strain Remains Gold’s Bane”, hardly can the Fed this coming Wednesday (12 June) release the rate reins. Moreover, that above table suggests — dare we say “obligatorily” — to tighten said reins. But then again, the Economic Barometer is getting comprehensively skewered. Near-term inflation may be restrictive for advancing Gold as it keeps any Fed rate cut on hold … but broader-term stagflation for Gold shall make its price bold! Cue Old Yeller: “Hey Jay? We need another Dollar mold!” To wit, the Econ Baro below:
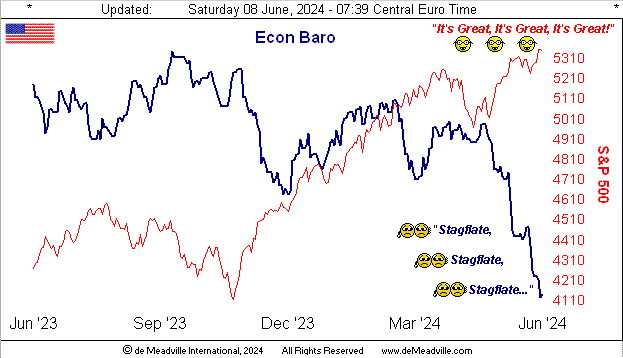
For the week just past, the Econ Baro took in 15 metrics of which just five garnered period-over-period improvement. Indeed measuring the Baro from its most recent peak ’round the S&P 5000 level, ’tis the worst 30-trading-day drop since that ending nearly 12 years ago on 05 July 2012, following which the FedFunds rate effectively remained at 0% for better than three additional years. Does history repeat? Inflation back then was continuously sub-2%. Not now, given the current FedFunds target range of 5.25%-5.50% So cut the rate and really stagflate, inflation further not to abate! Got Gold?
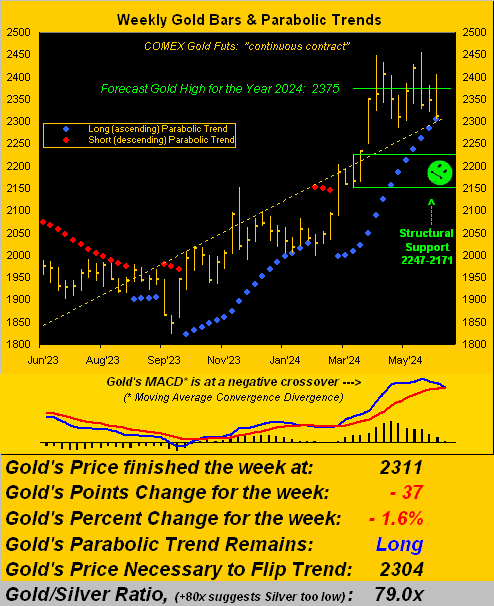
Admittedly as noted, our Gold view near-term is negative: fundamentally so with the Fed still on hold; technically so per our weekly chart below. To be sure, the year-over-year dashed regression trendline remains positive. But the rightmost blue parabolic Long dot shall pop given price’s plop. Too, as a special addition to this week’s graphic, we’ve inserted Gold’s weekly MACD as it is now negatively crossing to the downside, price having settled Friday at 2311:
“And even if, like you say mmb, that ‘Shorting Gold is a bad idea’, these MACD signals usually work, right?“
Historically ’tis true Squire. From April 2018 through today there have been for Gold 12 negative weekly MACD crossovers, the average downside follow-through being -93 points. Strictly within that vacuum from here at 2311, that bodes for 2218 which is nearly the center of the depicted 2247-2171 structural support zone. Upon the parabolic flipping from Long to Short, the average fall from there across the past five years is similarly -90 points. No, we’d rather price not go there, but such lower excursions Gold on occasion does fare.
‘Course for the Gold bull, hope springs eternal; otherwise, hardly would we be penning these weekly pieces. So fragile now is the state of the economy, the state of the stock market (“ridiculously overvalued” per a mainstream FinMedia piece a week or so ago), and the state of the world in many respects. Therefore Gold is the place to be! Indeed specific to stocks, here’s our honest “live” P/E calculation for the S&P 500 on the trailing twelve month basis; (for you WestPalmBeachers down there, “live” means right now):
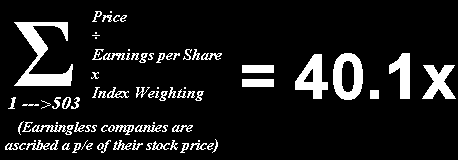
Not surprisingly however, upon querying AI for same, it replied: “The trailing twelve month Price-to-Earnings (P/E) ratio of the S&P 500 is currently 24.79.” More on such “Assembled Inaccuracy” in our closing wrap. Indeed contextually, the “live” P/E is now +58% higher that ’twas at its inception a dozen years ago. And for those of you scoring at home, you know “means reversion” always occurs. (Have a nice day).
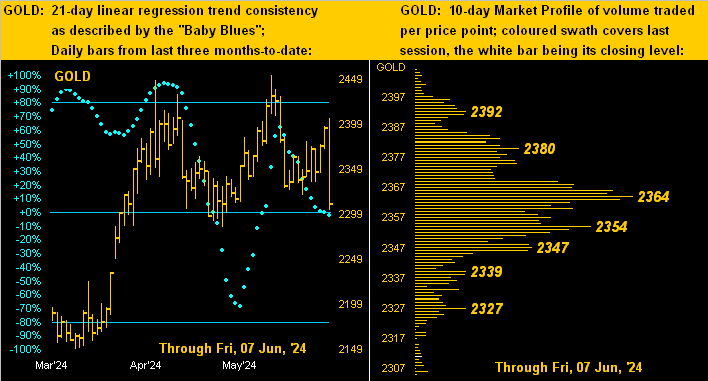
Not having a nice day Friday were Gold and Silver. First to the yellow metal which traced the entirety of its two trading weeks in a single session on Friday. High-to-low by both points (-103) and percentage (-4.3%), ’twas Gold’s worst trading day since last 04 December. ‘Tis why in Gold’s 10-day Market Profile (below right) every price bar is highlighted in Gold as they all traded. And with Gold’s “Baby Blues” of trend consistency now falling beneath their 0% axis (below left), this means the 21-day linear regression trend has confirmed rotating from positive to negative:
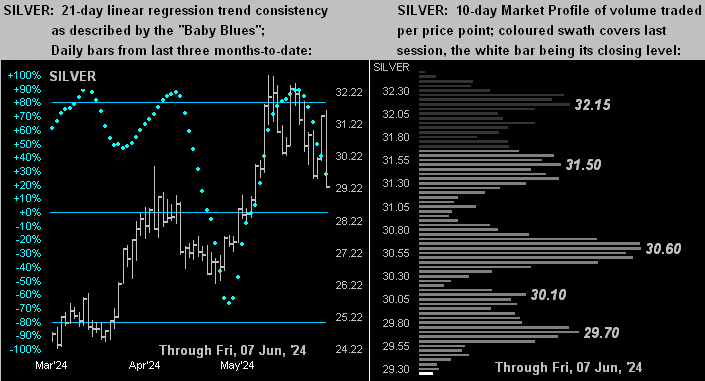
Second to the white metal, Sister Silver suffering Friday her worst high-to-low day (-2.45 points, -7.7%) since 02 February 2021. Below on the left are Silver’s daily bars from three months ago-to-date: her plunging “Baby Blues” (barring an unexpected upside Fed cut rocket shot) surely in the new week shall see her trend, like that already for Gold, also rotate from positive to negative. And below on the right is her 10-day Market Profile, price itself at the very base of the stack:
With the Federal Open Market Committee’s Policy Statement and Powell Presser due Wednesday, we’ll wrap with this from the “Retraction/Correction/Blew It Dept.” given reference to the aforementioned brilliance of AI.
In last week’s missive we performed quite the song and dance over how $34T might be “visualized”. And via proper math we concluded that $34T in One Dollar bills laid end-to-end essentially equated to 5.5x the distance from Earth to Neptune. However, we fell afoul of the cardinal rule not to depend on stoopid source material. Indeed, rather than scrounge round through a wallet-full of Euros in search of a stray One Dollar bill for our measuring tape, we instead queried: “How many One Dollar Bills laid end-to-end make one mile?” And now after further review following email spew, Assembled Inaccuracy didn’t have a correct clue. (So what else is new…)
Start with the wrong number … End with the wrong number! For the correct answer and proper use of brain function, we leave it to you StateSiders to get out a buck, your ruler, and do the math from there. And you’ll still find the number unfathomably impossible.
‘Course, near-term negativity notwithstanding, the one number to grab is Gold!

Cheers!
…m…
www.TheGoldUpdate.com
www.deMeadville.com
and now on “X”: @deMeadvillePro
deMeadville. Copyright Ⓒ 2010 - 2024. All Rights Reserved.
About the author
