
- America’s impaled stock market investors finally got a bit of a rally. Ominously, they seem far more concerned about stopping the Fed’s tiny rate hikes than stopping the growing number of homegrown terrorists who enjoy shooting their children.
- US stock market investors have devolved into welfare bums who live for QE handouts and negative interest rates provided by a central bank soup kitchen. Their madman president is a draft dodger who now ruins millions of Euro citizens with his relentless war mongering and sanctions… while promising that killing babies is how to reduce the inflation he creates.
- The US government is beginning to look like Caligula on steroids. Stock market investors cheer the madness and most horrifically… they seem eager for more.
- For a “just the facts, please” look at the action
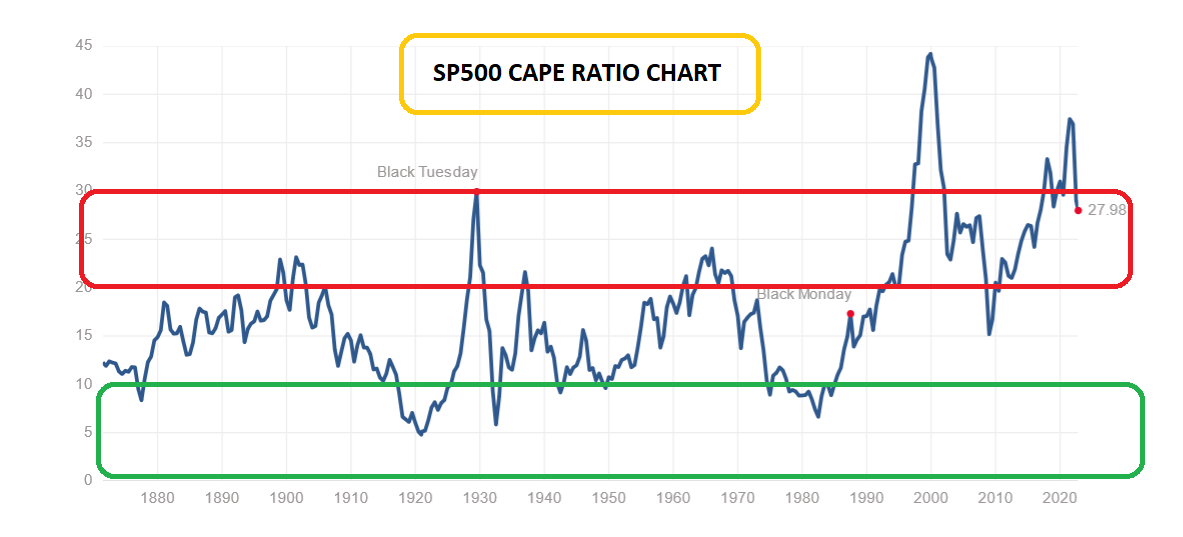 The SP500 CAPE ratio is in the historical stratosphere. It’s barely below the highs of 1929, yet the market is billed as “incredibly undervalued” by mangled investors who bought it at CAPE 25 and higher. The bottom line:
 - The US stock market hasn’t offered real value since the early 1980s, doesn’t offer it today, and is unlikely to offer any for the next decade or two.
- Please click here now. Double-click to enlarge. Is history about to repeat itself? Are the US stock market and then gold miners both poised for a modest rally, then a reaction, followed by an explosive move higher for the miners while the stock market tumbles?
- Please click here now. Double-click to enlarge. I’ve added the USO oil ETF to the chart. Oil is likely the key factor in determining whether history repeats again.
- It doesn’t matter if the Fed hikes rates. What matters is whether those hikes stop an inflationary surge or not, and oil is the main fuel of the world, so it is the main factor for inflation.
- A surging oil price in the face of Fed rate hikes could create institutional stock market terror and a history-making rally in the miners.
- Please click here now. Double-click to enlarge this daily oil chart. Oil broke out of a small bull wedge pattern and sits in the right shoulder zone of an inverse H&S pattern… but there’s no upside action.
- With the US mid-term elections about two weeks away, is it possible that the government is meddling in the oil market to stop a rally from happening?
- That’s unknown, and whether there’s government meddling or not, gold, silver, and the miners need oil to shoot over $100 to grease the wheels for a rally at least as big as the one that occurred early this year.
- Please click here now. Double-click to enlarge this weekly gold chart. I predicted a strong rally from about $1614 and that happened, but I suggested investors needed to be nimble. Here’s why:
- Most of what has been happening in terms of upside action for gold and the stock market is related to short covering by retail investors, leveraged hedge funds, and market makers.
- Friday was “OPEX” (option expiry) day for the SP500. Market makers have until tomorrow morning to cover short position hedges they bought against the put options they wrote for funds and retail investors.
- These short-term time horizons are partly why short-covering rallies tend to be so violent and short-lived.
- Please click here now. Double-click to enlarge this short-term gold chart. As gold arrived in the $1614 buy zone, I suggested an inverse H&S scenario was possible, and now the price is in the right shoulder “build” zone.
- A move under $1630 would put the pattern in jeopardy, and bring the enormous $1570, $1450, and $1400 buy zones into focus.
- Please click here now. Double-click to enlarge this CDNX junior resource stocks chart. There’s a bull wedge in play but there’s no upside action even with the stock market rallying violently.
- Many individual junior miners look better than the CDNX and are sporting superb bull wedge patterns with upside action and breakouts. At $199/year, my juniors newsletter offers good value for junior mining stock enthusiasts. I have an “inflation buster” special offer this week, which is just $169 for 15 months of exciting junior investing action! Click this link or send me an Email if you want the offer. Thank-you.
- Next, click here now. Double-click to enlarge. The GDXJ chart is incredibly bullish, but the right shoulder of the inverse H&S pattern is a bit mushy.
- Please click here now. Double-click to enlarge this SIL chart. There was a channel breakout, but since then price has just oozed along the top of the channel. The bottom line for the miners:
- Oil, oil, and yes… oil! The metals markets need oil to blast over $100 while Jay keeps hiking, to lay the groundwork for the next big meltdown in the US stock market…
- And the next big rally for gold, silver, and the miners!
Thanks!
Cheers
St
About the author
