
Executive Summary....
That was quite a week. The overthrow of the speaker of the House in Washington, the surprise job numbers, the surprise reaction of the markets turning sharply up following the job numbers, and, finally the outbreak of war in Israel/Mid-East. The attack in Israel came too late for the Scoop to comment on any market action. We won't see any market reaction until Sunday evening assuming there is a response. The US$ Index, gold and oil might all respond positively.
Our focus this week is on the massive amount of debt that the world has. The back-up in bond yields has created one of the worst bear markets ever in the bond market. Bank of America declared that bonds are in the greatest bear market of all time. The back-up is rivaling the bond market collapse of 1977-1981. That, save for a few players, there has not as yet been a major collapse. But the risks are rising that we could have an accident on par with the 2008 financial crisis. A black swan event that could threaten the global financial system.
Our chart of the week focuses on the surprise job numbers that came out Friday in both Canada and the U.S. Initially the markets fell as the US$ Index rose and bond yields rose. Then the market turned and soared upward both stocks and gold. It wasn't enough to save the week but it was a surprise to many. But will it last? Follow through is important. Bonds also settled down after the initial reaction. The closely watched 2-10, 3M-10 spreads continue to narrow suggesting while still a few months or so away the recession is getting closer. Long bond yields are rising faster than short rates. The Fed can control the short end of the yield curve but it is the bond market that signals whether things are good or not. And right now with long bond yields rising are signaling that things are not good.
Oil dropped sharply this past week on a sudden fear of drop in demand because of any coming recession. The market had also been overbought so while a pullback was expected the big almost 9% drop in oil prices this past week was a surprise. But will it last? It has the look of a sharp correction rather than the start of a prolonged bear. Gold reversed nicely on Friday to the upside but still had a down week. It was deeply oversold so a rebound rally was to be expected. Gold stocks remain grossly undervalued.
A potentially dangerous week given both the chaos that could emanate in the U.S. following the coup of the speaker, and the outbreak of war in Israel/Mid-East that has potential unknown market impacts. Given that the latter was a surprise it could be classified as a black swan event.
DC
“Statements by high officials are practically always misleading when they are designed to bolster a falling market.”
—Gerald M. Loeb, stockbroker, investment banker, founding partner of E.F. Hutton & Co., author of The Battle for Investment Survival that predicted the 1929 crash; 1899–1974
“Analyzing the chart is the easy part. Actually, doing what the chart says? That’s the tough part.”
—Ralph Acampora, called the Godfather of Technical Analysis, co-founder CMT Association, Altaria Wealth Management, Director of technical analysis, Prudential Securities, author of The Fourth Mega Market (2000), plus others; b. 1941
“When everybody thinks alike, everyone is likely to be wrong.”
—Humphery B. Neill, Investor, analyst, originator of the contrarian approach to investing, author of Art of Contrary Thinking (1954), plus others; 1895–1977
The bond market, or maybe more correctly, the debt market is huge when compared to the stock market. The global bond/debt market is over $300 trillion. Global stock markets are about $125 trillion. Yet, on a day-to-day basis, all we mostly hear about is the stock market. There are bond indices, but pundits rarely mention them. In Canada, there is the S&P Canada Aggregate Bond Index that tracks the performance of Canadian dollar-denominated investment-grade debt publicly issued in the Eurobond or Canadian domestic market. The U.S. has the S&P 500 Bond Index which tracks corporate bonds. There are a number of them, but they are not prominently listed. Substitutes are exchange-traded funds (ETFs) or bond mutual funds.
The most common debt instruments are bonds, both government (federal, state, provincial), corporate (financial and non-financial), and municipal, plus notes, which in the U.S. includes federal government debt instruments over one year to 10 years, treasury bills, debentures, money market instruments, commercial paper, mortgages, lines of credit (LOCs). We also have corporate, student, and car loans. There are many others.
When an economic crisis comes, it is usually centered in the debt market. Since 1970, debt crises that imploded include: the Latin American debt crisis in the late 1970s and early 1980s, the Savings and Loan crisis of 1986–1995 that saw one-third of U.S. S&Ls collapse, the Asian financial crisis of 1997, the Russian financial crisis of 1998 that resulted in the collapse of Long-Term Capital Management (LTCM) and almost brought down the global financial system, the sub-prime mortgage and financial crisis of 2007–2009, resulting in the collapse of Lehman Brothers, and the European sovereign debt crisis in 2009–2019, which included the Greek debt crisis.
There have been numerous financial and bank crises in other countries, including the U.K. in 1973–1975, Japan in 1986–1992, Israel in 1983, Finland in 1991–1993, Sweden in 1990–1994, Ecuador in 1998–1999, Argentina in 1998–2002, Turkey in 2001, Uruguay in 2002, New Zealand in 2006–2012, Iceland, Ireland, Venezuela, and Latvia as part of the 2007–2009 financial crisis, Spain in 2008–2014, Portugal, Ireland and Cyprus as part of the European debt crisis, Argentina (again) in 2018, China property debt in 2020–2023, Russia in 2022, and Sri Lanka and Pakistan in 2022. It is hard keeping tracking of them all.
In the U.S., we had the collapse of three large regional banks earlier in the year: SVB Bank, Signature Bank, and First Republic. Later, a number of other regionals saw debt downgrades. We hear constant rumours of more that could fail, as many believe the bank crisis is not over. Recently, the Social Science Research Network posted that they found some 186 U.S. banks that are at risk of failure or collapse due to high interest rates and a high proportion of uninsured deposits. Jamie Dimon, the CEO of JP Morgan Chase has warned that the world is unprepared for high interest rates and has for too long lived on an economic “sugar high.”
With interest rates rising and bond yields backing up, the U.S. 10-year treasury note has hit its highest level since 2007. The 30-year U.S. treasury bond is approaching 5%, also the highest since 2007. Naturally, that’s impacting mortgage rates as well, where the U.S. 30-year mortgage rate has reached its highest level since 2000. Deutsche Bank has noted that it has reached the 230-year average for the first time since 2007. Some articles in The Globe and Mail caught our attention. (“U.S. bond market signals the end of an era” – G&M October 2, 2023 https://www.theglobeandmail.com/investing/investment-ideas/article-us-bond-market-signals-the-end-of-an-era/#comments and “Why a rout in government bonds is worrying” - G&M October 4, 2023 https://www.theglobeandmail.com/investing/investment-ideas/article-why-a-rout-in-government-bonds-is-worrying/).
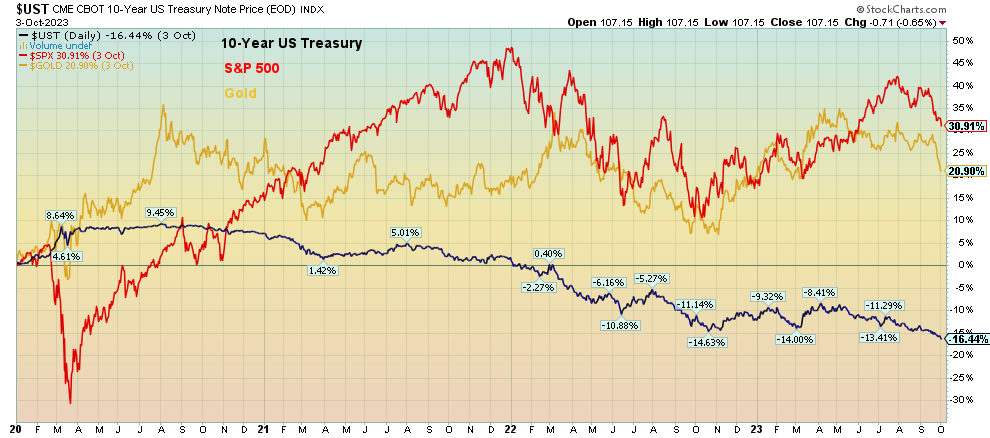
Performance U.S. 10-year treasuries, S&P 500, Gold 2020–2023
Source: www.stockcharts.com
Bonds, as represented here by the U.S. 10-year treasury note, have been the worst performer since 2020, down over 16%, while the S&P 500 has gained almost 31% and gold 21% in the same period. Since 2000, the performance is even more notable as the 10-year is up only about 12% while the S&P 500 is up 188% and gold up 536%. The gain on bonds and notes does not include the coupon. What we are witnessing, however, may be one of, if not the biggest, bond crashes in history, on par with the bond crash from 1977 to 1981.
The 10-year has jumped an incredible 775% in interest rate yields from that low in 2020. It actually sounds better if we state it in terms of price rather than yield. The 10-year has fallen about 24% in price terms (price moves inversely to yield). But when people take out loans or renew their mortgage they are not looking at or calculating the price. They are looking at the yield—and it is sticker shock. Translate that increase all across the spectrum in terms of instrument and term, and, whether we are talking about the U.S. or Canada, it’s the same.
Source: www.stockcharts.com
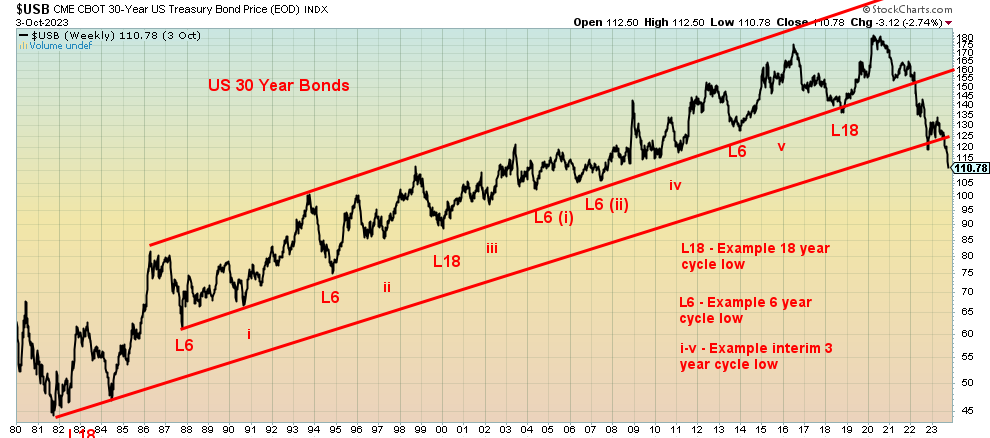
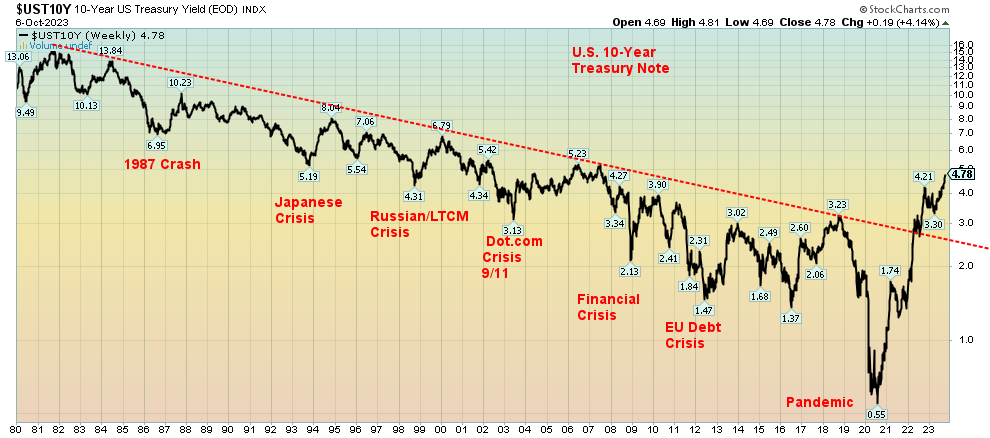
Long-term treasury bonds, represented in the chart above, have broken a 40-year uptrend line. The chart is represented in price as bond prices move inversely to yields. Below is the U.S. 10-year treasury note represented in yield. The 10-year has broken above a 40-year trendline. What that tells us is that the era of low interest rates is over. High interest rates are most likely here to stay. The well-followed 2/3-year, 6-year, and 18-year cycles suggest that a low (price, high yield) is due sometime in 2023 or 2024. It would be a 6-year cycle low from that last one in 2018 (L18). That was an 18-year cycle low. Given we have easily taken out those lows, we know we are in a new era of higher interest rates that could remain with us for some time.
Source: www.stockcharts.com
Leaving interest rates at or near zero for years (yes, mortgage rates were higher) created excesses. Zero interest-rate policy (ZIRP) and quantitative easing (QE) will do that. From roughly $100 trillion in 2000 to about $150 trillion by the time of the 2008 financial crisis, global debt now exceeds $300 trillion. Borrow, borrow, borrow. Mortgages, loans, student loans, car loans, commercial real estate loans, loans for stock buybacks, loans just to acquire assets, loans to finance consumer spending. For the most part, it wasn’t productive borrowing; instead, it was speculative borrowing and money was cheap. Throughout it, credit quality dropped to the point where in the U.S. upwards of 75% of U.S. debt is rated BBB (the lowest investment grade) or lower—meaning, it’s mostly junk. It’s no surprise then to discover that the iShares iBoxx Investment Grade Corporate Bond ETF (LQD) is down 30% from its high. Surprisingly, however, the SPDR High Yield Bond ETF (JNK) is down only 20% and the iShares iBoxx High Yield Corporate Bond ETF (HGY) is down 25%. However, all appear to be poised to drop further. Could a crash be coming?
The Fed, along with other central banks, bailed out markets during the 1987 crash, the Russian/LTCM crash, the dot.com, 9/11 crash, the global financial crisis, and the pandemic. Japan bailed out everybody during the Japanese crash of the early 1990s. The Chinese have followed during their own property crash and the EU bailed out everyone during the EU debt crisis. The alternative? A potential depression that could become a global depression. Bailouts, bailouts everywhere. ZIRP and even sub-ZIRP in the EU and Japan. Trillions of QE.
They may have saved the day during each crisis, but what occurred after each crisis and each bailout was more instability, which has become long-term. Can they bail out the next crisis? Or, since laws have been changed to substitute bail-outs with bail-ins, could bond holders become unwilling shareholders?
Global sanctions against numerous countries and the threat of global war are also causing instability. Does China really want to be caught holding in excess of $1 trillion of U.S. debt if somehow their current conflict actually ended up in war? Probably not, and the Chinese have been steadily selling U.S. debt ever since. China used to hold some $1.4 trillion of U.S. debt (treasury bills, notes, bonds) as part of their reserves. It is now down to $821.8 billion and falling every month. Over the past year, its holdings have fallen $116.8 billion.
It is not as if others have not picked up the slack. However, the buyers have been mostly other G7 countries and offshore banking in the Caribbean. We note that while China’s holdings were falling, Japan’s also fell about $84 billion over the past year. Japan has a currency problem that has been sinking rapidly. Canada has been a big buyer, up about $66 billion in the past year. Luxemburg, a major European banking centre, is up $42 billion. Overall, foreign holdings of U.S. treasuries are up $162 billion over the past year. But the U.S. has had to issue some $2.1 trillion of new debt during the period. Foreign holdings barely made a dent. Could this be part of the reason why yields are rising?
China, Holdings of U.S. Treasuries January 2000–July 2023
$Billions
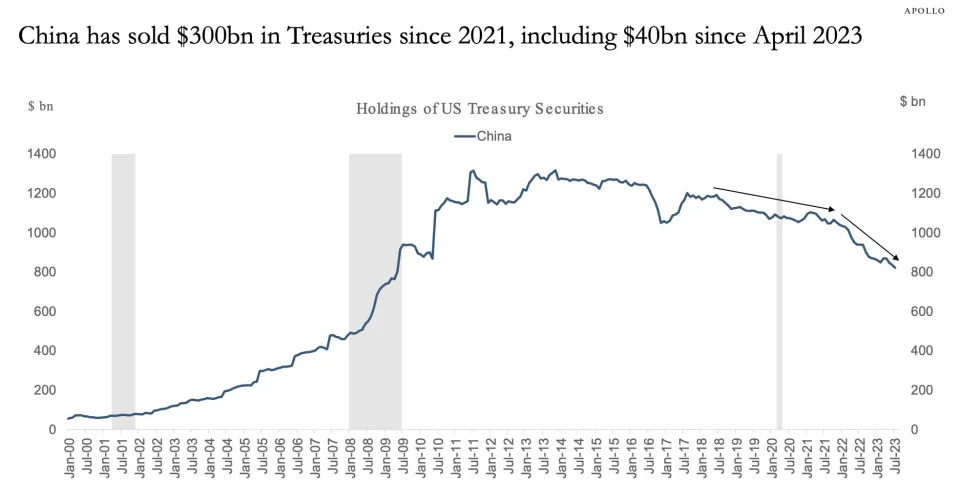
Source: www.yahoo.com, www.apollo.com, www.tikdata.treasury.gov
So, who bought it all? Intragovernmental holdings, meaning government agencies, picked up $253 billion. The Fed, along with the banking system and along with the shadow banks, or sovereign wealth funds would have picked up the rest, some $1.7 trillion.
The trouble that could lead to a debt collapse and liquidity crisis is just barely getting underway. Housing is rolling over, mortgage delinquencies are rising, delinquencies are rising on student loans, car loans, and more. Commercial real estate as been upset all year due to high vacancies. Corporations are now struggling to borrow as costs rise. The Chinese property market is in crisis mode, led by Evergrande. A number of sovereign countries are either bankrupt or teetering on the edge of bankruptcy, due to high debt costs and the fact that many have borrowed in U.S. dollars. With the US$ Index rising, it means their U.S. dollar loans are now more expensive to pay back. Their revenue is in the local home currency that has been falling vis-à-vis the U.S. dollar.
People are being forced to dump assets, but we haven’t yet hit the point where it has become a panic. A bond fund is out there that is in deep trouble because bond prices have fallen so far. It is all like a margin call, but instead of being for some individual at a brokerage firm it is margin call on the financial system itself. Leveraging is becoming deleveraging. As a result, asset prices (stocks, houses, and others) have further to fall as interest rates will stay higher for longer. Even the federal government, which controls the printing presses, is being pressured with higher interest rates as interest on the U.S. debt approaches $1 trillion. Multiply this throughout the financial system and you have a growing crisis. But is it in its infancy, a toddler, a tween, or a teenager?
The Fed, as are other central banks, is caught between a rock and hard place. If they raise rates further, it heightens the pain. If they lower rates, inflation could pick up once again. Yet the U.S. dollar keeps on rising. That is another problem.
We note that the CNN Business Fear & Greed Index is registering “extreme fear.” Maybe we should quote another old phrase—“Be afraid. Be very afraid.” (The Fly, 1986; said by Ronnie (Veronica Quaife) played by Geena Davis to Seth Brundle aka BrundleFly played by Jeff Goldblum and Tawny played by Joy Boushel).
US Job Numbers
Unemployment Rate U3 and U6
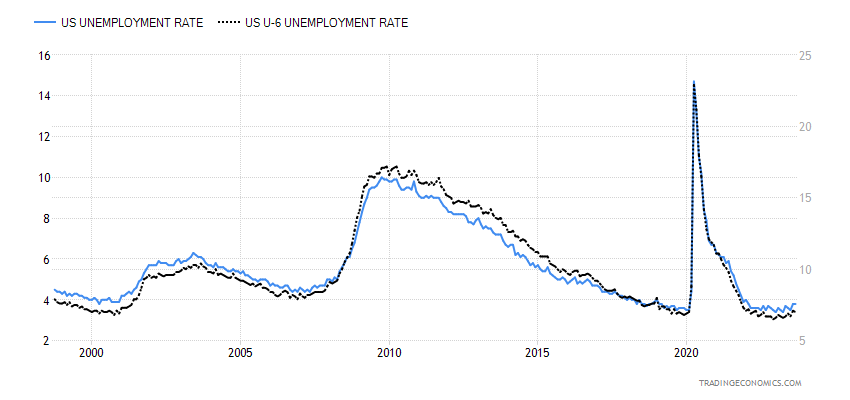
Source: www.tradingeconomics.com, www.bls.gov
Everyone was awaiting a reduced nonfarm payroll number, but instead we received a blowout number. It probably had more than a few saying WTF. Yes, the August nonfarm payroll came in at a stunning 336,000, when all they expected was 170,000. Canada’s was a blowout number as well, but we explore that one following our U.S. analysis. As if that wasn’t enough, they revised the July/August numbers upwards by 119,000. A surprising resilience to inflation and Fed tightening.
So, the response was as expected. Fear of further Fed rate hikes rose. Bond yields rose. The stock market fell because of fear of higher interest rates. The US$ Index rose. Gold fell—wait, gold didn’t fall. Okay, it didn’t go up, either, but silver was up and, in the early going, after the release of the nonfarm payrolls, the gold stocks were rising or at least steady. A positive response to negative news and a rising US$ Index. Then the surprise, markets reversed and shot sharply to the upside. A positive response to negative news.
The unemployment rate (U3) was steady at 3.8%, but U6 unemployment, which includes those who want to work but have given up searching, plus those working but wanting full-time employment, slipped slightly to 7% from 7.1%. We have not received an update from Shadow Stats (www.shadowstats.com) due to their computer problems. So, we do not have their unemployment numbers. The labour force participation rate was unchanged at 62.8%, while the employment population ratio was also unchanged at 60.4%.
Now come the numbers, which leaves our heads scratching a bit. The total population of those that could be eligible to work rose by 215,000. In a surprise jump, those not in the labour force leaped 546,000. The civilian labour force was up only 90,000 and the employment level also rose only 86,000. Those working full-time actually fell 22,000 while those working part-time rose 151,000. All are from the same source at www.stlouisfed.org, www.bls.gov.
The rise in part-time employment is not surprising, as the Bureau of Labour Statistics (BLS) (www.bls.gov) reported that leisure and hospitality added 96,000 jobs, food services and drinking added 61,000, and accommodation employment added 16,000. All except accommodation were above the average. Accommodation is still below pre-pandemic levels in 2020. Government added 73,000 and health care added 41,000. Other sectors saw lower gains or were relatively flat. But those jobs in leisure and hospitality and food services and drinking are primarily part-time jobs. They are also the first that could be shed in a downturn. The economy needs to create at least 100,000/month just stay even with the growth of the labour force. Notably, the numbers do not fully reflect the strike of the auto-workers nor much for the end of the Hollywood writers’ strike.
It is no surprise that bond yields rose, with the 10-year up to 4.90% and the 30-year over 5%. Traders are now pricing in another rate hike—if not at the October 31–November 1 meeting, then at the one on December 12–13. However, wages were subdued with hourly wages up 0.2%, below the expected gain of 0.3%, and year over year (y-o-y) up 4.2%, below the expected 4.3%. Inflation was last at 3.7%.
Average Hourly Earnings % Gain, Inflation Rate 2013–2023
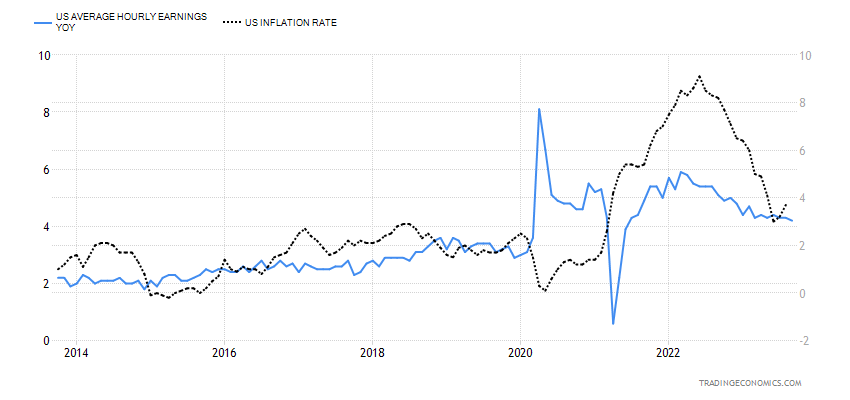
Source: www.tradingeconomics.com, www.bls.gov
From our perspective, what is interesting is that the bond market is doing the Fed’s job for it. As long as bond yields keep on rising, it takes some pressure off the Fed to hike. No surprise then that the closely watched 2–10 spread and the 3M–10 spread are coming down. To us, that means that a recession is getting closer. The continued divergences in what is being reported for nonfarm and other numbers like the labour force, full-time, part-time, etc. suggests to us that the overall labour market is not as strong as the nonfarm appears to suggest.
Canada Job Numbers
Canada Employed Persons vs. Unemployed Persons 2013–2023
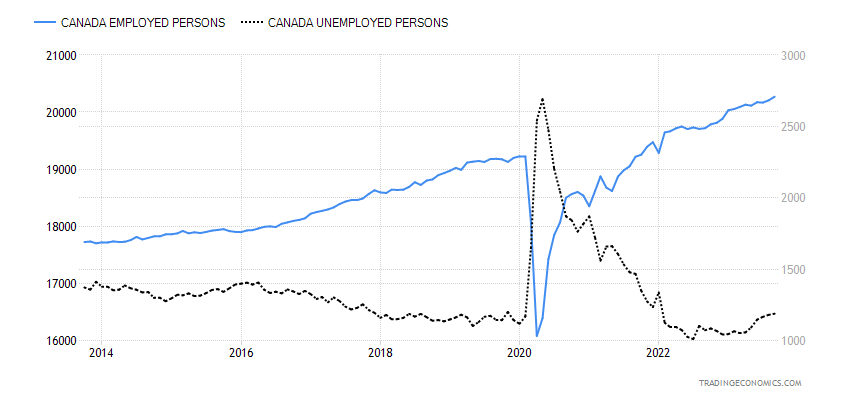
Source: www.tradingeconomics.com, www.statcan.gc.ca
The U.S. wasn’t the only one who reported a surprise big jump in employment. Canada did as well. Indeed, Canada crushed estimates, adding 63,800 jobs in September. The market had expected only about 20,000. In August they reported a gain of 39,900 jobs. Recession? What recession? A big chunk of the jobs was in transportation and warehousing at +19,000 and educational services at +66,000. Other sectors like finance, insurance, real estate, and rental and leasing fell 20,000 and, despite the need to build more housing, construction fell 18,000. Quebec and B.C. led the gains while Alberta fell.
The unemployment rate was unchanged at 5.5%, despite the number of unemployed rising to 8,100. But then the number for those employed also went up. The R8 unemployment rate, which includes discouraged searchers, plus the waiting group of involuntary part-time workers, fell to 6.9% from 8.2%. Full-time employment was up 15,800 while part-time employment rose 47,900. Part-time is now at a 1.5 year high.
Wage growth also jumped up 5.3% y-o-y, beating expectations of a gain of 5.1%. All this had traders in Canada starting to price in another expected BofC rate hike. The 2-year was last at 4.90% and the 10-year at 4.25%. The spread has fallen to 65 bp.
The labour force participation rate was 65.6%, up from 65.5% the previous month. That means more people are seeking jobs. All in all, this was a gangbusters report which puts a dent in thoughts that Canada is slipping into recession. Nor does it appear broken.
Markets & Trends
|
|
|
|
% Gains (Losses) Trends |
|
||||
|
|
Close Dec 31/22 |
Close Oct 6, 2023 |
Week |
YTD |
Daily (Short Term) |
Weekly (Intermediate) |
Monthly (Long Term) |
|
|
Stock Market Indices |
|
|
|
|
|
|
|
|
|
S&P 500 |
3,839.50 |
4,308.50 |
0.5% |
12.2% |
down |
up (weak) |
up |
|
|
Dow Jones Industrials |
33,147.25 |
33,407.58 |
(0.3)% |
0.8% |
down |
neutral |
up |
|
|
Dow Jones Transport |
13,391.91 |
14,807.73 |
(1.1)% |
10.6% |
down |
neutral |
up |
|
|
NASDAQ |
10,466.48 |
13,431.34 |
1.6% |
28.3% |
down |
up (weak) |
up |
|
|
S&P/TSX Composite |
19,384.92 |
19,246.07 |
(1.5)% |
(0.7)% |
down |
down |
up |
|
|
S&P/TSX Venture (CDNX) |
570.27 |
533.54 |
(4.5)% |
(6.4)% |
down |
down |
down |
|
|
S&P 600 (small) |
1,157.53 |
1,124.00 |
(2.4)% |
(2.9)% |
down |
down |
neutral |
|
|
MSCI World |
1,977.74 |
1,998.06 |
(2.2)% |
1.0% |
down |
down |
neutral |
|
|
Bitcoin |
16,531.31 |
28,006.41 |
4.0% |
69.4% |
up |
up (weak) |
neutral |
|
|
|
|
|
|
|
|
|
|
|
|
Gold Mining Stock Indices |
|
|
|
|
|
|
|
|
|
Gold Bugs Index (HUI) |
229.75 |
205.95 |
(0.4)% |
(10.4)% |
down |
down |
down |
|
|
TSX Gold Index (TGD) |
277.68 |
254.04 |
0.5% |
(8.5)% |
down |
down |
down |
|
|
|
|
|
|
|
|
|
|
|
|
% |
|
|
|
|
|
|
|
|
|
U.S. 10-Year Treasury Bond yield |
3.88% |
4.79% |
4.6% |
23.5% |
|
|
|
|
|
Cdn. 10-Year Bond CGB yield |
3.29% |
4.16% |
3.2% |
26.4% |
|
|
|
|
|
Recession Watch Spreads |
|
|
|
|
|
|
|
|
|
U.S. 2-year 10-year Treasury spread |
(0.55)% |
(0.29)% |
50.0% |
47.3% |
|
|
|
|
|
Cdn 2-year 10-year CGB spread |
(0.76)% |
(0.70)% |
17.8% |
7.9% |
|
|
|
|
|
|
|
|
|
|
|
|
|
|
|
Currencies |
|
|
|
|
|
|
|
|
|
US$ Index |
103.27 |
106.11 |
(0.1)% |
2.8% |
up |
up |
up |
|
|
Canadian $ |
73.92 |
73.30 |
(0.7)% |
(0.8)% |
down |
down |
down |
|
|
Euro |
107.04 |
105.85 |
0.2% |
(1.1)% |
down |
down |
down |
|
|
Swiss Franc |
108.15 |
109.88 |
0.6% |
1.6% |
down |
down |
up |
|
|
British Pound |
120.96 |
122.34 |
0.3% |
1.1% |
down |
down |
neutral |
|
|
Japanese Yen |
76.27 |
66.98 |
0.1% |
(12.2)% |
down |
down |
down |
|
|
|
|
|
|
|
|
|
|
|
|
|
|
|
|
|
|
|
|
|
|
Precious Metals |
|
|
|
|
|
|
|
|
|
Gold |
1,826.20 |
1,845.20 |
(1.1)% |
1.0% |
down |
down |
up |
|
|
Silver |
24.04 |
21.72 |
(3.3)% |
(9.7)% |
down |
down |
neutral |
|
|
Platinum |
1,082.90 |
881.50 |
(3.8)% |
(18.6)% |
down |
down |
down |
|
|
|
|
|
|
|
|
|
|
|
|
Base Metals |
|
|
|
|
|
|
|
|
|
Palladium |
1,798.00 |
1,163.10 |
(7.4)% |
(35.3)% |
down |
down |
down |
|
|
Copper |
3.81 |
3.63 |
(2.9)% |
(4.7)% |
down |
down |
neutral |
|
|
|
|
|
|
|
|
|
|
|
|
Energy |
|
|
|
|
|
|
|
|
|
WTI Oil |
80.26 |
82.79 |
(8.8)% |
3.2% |
down |
up |
up |
|
|
Nat Gas |
4.48 |
3.34 |
14.0% |
(25.5)% |
up |
up |
down (weak) |
|
Source: www.stockcharts.com
Note: For an explanation of the trends, see the glossary at the end of this article.
New highs/lows refer to new 52-week highs/lows and, in some cases, all-time highs.
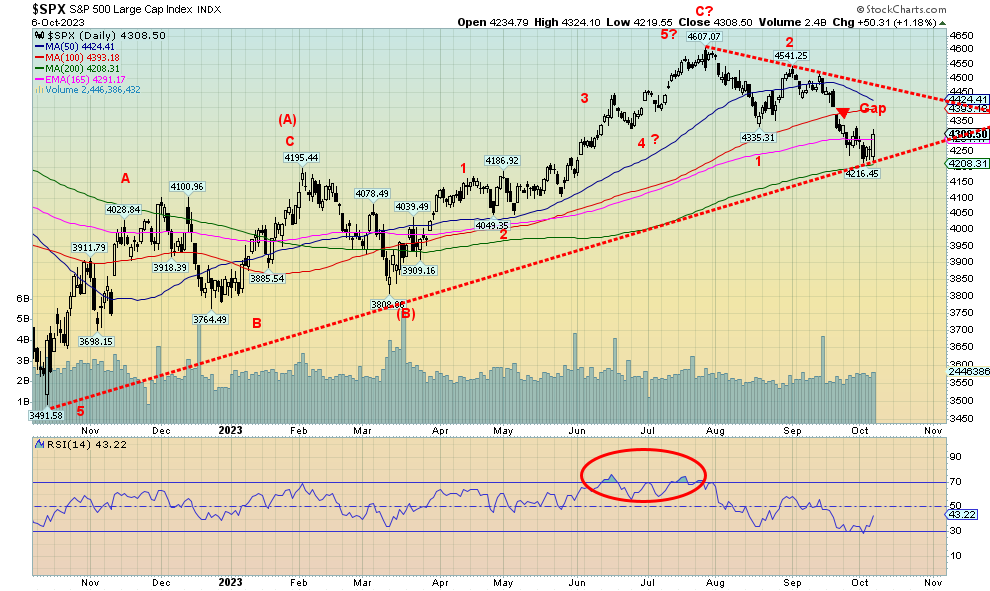
Source: www.stockcharts.com
Friday’s reversal action following the release of the September job numbers has the bulls pounding the pavement. Volume was good on the day, supporting the bulls’ thoughts that the correction is over. Sounds to us like that they may be getting bullish too quickly. That makes follow-through this week important. We are still looking at that gap between 4,375 and 4,401 to see if they can close it. If they do, then we could go higher. But if we fail the gap, then new lows below 4,200 loom.
On the week, the S&P 500 rebounded and gained 0.5%. The NASDAQ was up 1.6%. But the Dow Jones Industrials (DJI) lost 0.3% and the Dow Jones Transportations (DJT) was down 1.1%. The S&P 400 (Mid) lost 1.9% and the S&P 600 (Small) dropped 2.4%. That the Mid and the Small were down much more than the large cap stocks is not a good sign. A bull market requires them to lead. The S&P 500 Equal Weight Index fell 1.2% which is interesting considering that the S&P 500 was up. Once again, the market is being taken higher by a select few. The NY FANG Index rose 3.5% and Bitcoin was up 4.0% (go figure). The big gain in the NY FANG Index tells us where the gain for the S&P 500 and the NASDAQ came from.
In Canada, the TSX Composite fell 1.5% and the TSX Venture Exchange (CDNX) dropped 4.5%. In the EU, the London FTSE was down 1.6%, the EuroNext was off 1.4%, the Paris CAC 40 down 1.1%, and the German DAX dropped 0.9%. But the EU, led by Germany, is falling into recession. In Asia, China’s Shanghai Index (SSEC) was closed for the mid-autumn festival (can you imagine the NYSE closed for a week?). The Tokyo Nikkei Dow (TKN) fell 2.7% while Hong Kong’s Hang Seng (HSI) dropped 1.8%. Shanghai was closed but Hong Kong open. The MSCI World Index was down 2.2%.
Unlike the instant bulls that seem to appear following the reversal on Friday, we are not convinced this is over. We say that, even though while September is usually the worst month of the year, October is known for its crashes and bottoms. Crashes occurred in 1929, 1987, 1978, 1979, 1989, 1997, and 2008. But bottoms (bear killers) were seen in 1946, 1957, 1960, 1962, 1966, 1974, 1987, 1990, 1998, 2001, 2002, and 2011. If not October, then November. We still have time for both a crash and a bottom.
Hard to say what could cause a crash, but the ousting of the speaker of the house in the U.S. has some potential. A nasty fight for the top job could follow, with demands made as to what would get him (or her) elected (so far, a few have stepped forward). A few rebellious GOP members led by Matt Gaetz seem to have control and they are oblivious to the damage they might do. The biggest threat is the potential shutdown of government in November. One of the reasons McCarthy was overthrown was because he created a bipartisan bill to extend the shutdown into November. The new speaker would probably have to accede to their wishes to get elected. That could set the clock ticking towards a shutdown. Regardless of this, as long as there is no speaker, chaos could follow.
The U.S. economy seems to be still hanging in and inflation is coming down, although a small uptick is expected next week. Compared to other economies in the EU, Japan, and U.K., the U.S. economy is a darling and resilient. However, shocks could still appear like the speaker issue.
4,200 remains our breakdown zone. Resistance is seen up to 4,400. But if that gap can be closed, then we could be looking at higher levels including the July high just over 4,600.
With the breaking news of the outbreak of war in Israel it came too late to comment on or see what the reaction of the market might be.
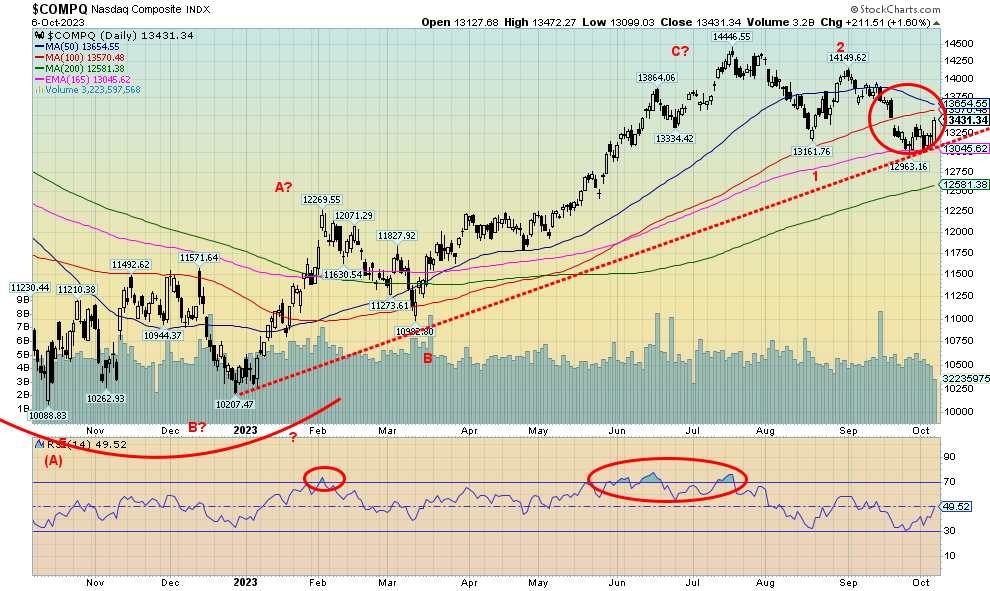
Source: www.stockcharts.com
The NASDAQ joined the reversal party on Friday with a 1.6% gain on the day. On the week, the NASDAQ was also up 1.6% so it made it all on Friday. So far, we appear to have found support at the 165-day EMA. We are still above the 200-day MA, currently near 12,580. The NY FANG index, which is part of the NASDAQ, gained 3.5% this past week. Good gains were seen for META, up 5.1%, Google, up 5.2%, Nvidia, up 5.2%, and Tesla, up 4.1%. Snowflake gained 4.7% while Advanced Micro was up 4.3%. Tech hopped again. What is going to be necessary this coming week is follow-through. So far, it wasn’t much of a corrective drop. We did take out the August low and the pattern appeared to suggest a decline to at least 12,170 or even 11,875. With a low of 12,963 we are not close. So, all this might be is a corrective wave to the upside that might stall out around 13,360. New lows below 12,963 would confirm we are headed lower towards first that 200-day MA near 12,580.
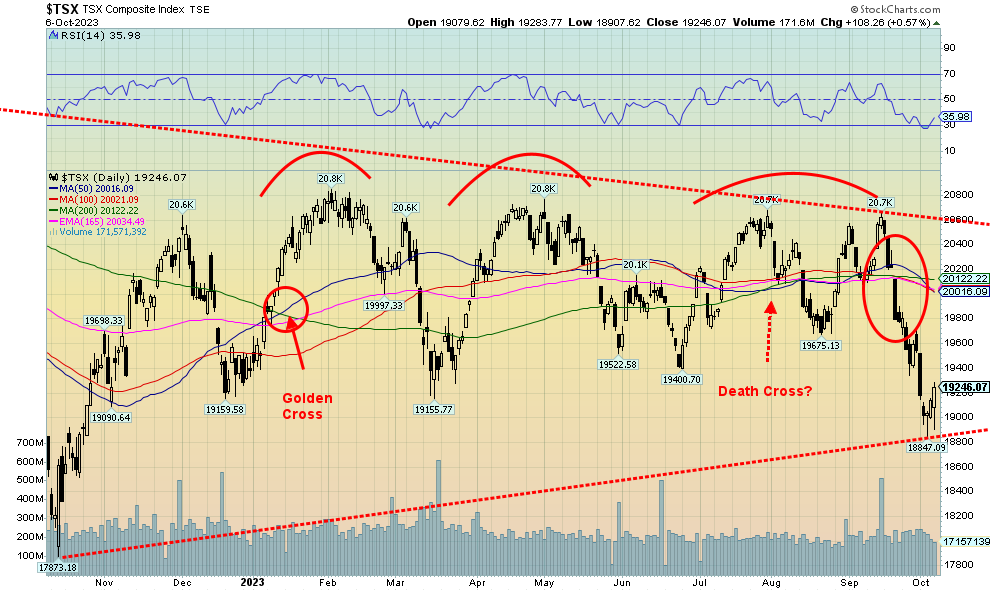
Source: www.stockcharts.com
The TSX Composite fell this past week, losing 1.5%. That’s the bad news. But following the stellar job numbers in both Canada and the U.S. the TSX rebounded, gaining about 0.6% on Friday. Have we hit a bottom? We are coming off a sub-30 RSI and bearish sentiment. The drop from that last high has been both swift and steep. From the September high we have fallen roughly about 8%. It only took 13 days. Is this a final plunge? Will we now rally and take out those series of highs seen over the past year? Or will we, after a corrective rebound that could take us back to the 200-day MA near 20,000, start falling again?
Of the 14 sub-indices it was, almost unanimously, a down week. Three indices rose—Consumer Staples (TCS), up 1.6%, Information Technology (TKK), up 0.8%, and Golds (TGD), up 0.5%. Leading the way to the downside was Energy (TEN), falling 4.8%. Health Care (THC) lost 3.6%. No other sub-index lost over 2%, although Materials (TMT) was close down 1.9%. Some weren’t far from unchanged with Telecommunications (TTS) and Utilities (TUT) both down 0.1%. The key Financials (TFS) lost 1.8%.
It's been a steep drop for the TSX Composite. The junior TSX Venture Exchange (CDNX) fared worse, losing 4.5%. The CDNX is down 17% from a high in May and 52% from its high in February 2021. Depressive market.
It’s hard trying to discern what this chart will do. On one hand, it appears very bearish and on the other hand, if we rebound and take out 20,300, we could be on our way to new highs. The odd topping pattern appeared to point to a fall to 17,500. Our low so far was at 18,847.
U.S. 10-year Treasury Bond/Canadian 10-year Government Bond (CGB)
Source: www.tradingeconomics.com, www.home.treasury.gov, www.bankofcanada.ca
Bonds have been crashing. Interest rates keep on rising. This past week the U.S. 10-year treasury note hit its highest level since 2007, at one point over 4.80%. The 30-year U.S. treasury bond touched briefly over 5% before settling back to 4.95%. The surprise job numbers on Friday helped push yields up. But, earlier in the week, the ISM Manufacturing Index came in better than expected at 49 vs. the expected 47.8. The JOLTS job openings also surprised at 9.61 million, well above the expected 8.6 million. Job quits were up as well, but not as much as the openings. Even factory orders surprised to the upside at +1.2% when they had expected a gain of only 0.3%. Weekly jobless claims came in at 207,000, but the market had expected 210,000. Better job numbers, better job openings, better manufacturing numbers, better factor orders. The U.S. is humming and that pushes yields higher and expectations of further rate hikes higher as well.
Despite the mini-rally on Friday after the job numbers (initial reaction was up, then it pulled back), we expect that rates might still go higher, but a pullback this coming week wouldn’t be a surprise. Markets are a bit oversold (price) or overbought (yield).
The big number out this coming week is the CPI on Thursday. Expectations are for a gain of 0.4% and y-o-y up 3.8% vs. last month’s gain of 0.6% and y-o-y of 3.7%. Oil prices plunged this week, but that won’t be noted in the CPI. The PPI is out on Wednesday and it’s expected to be up only 1.8% y-o-y.
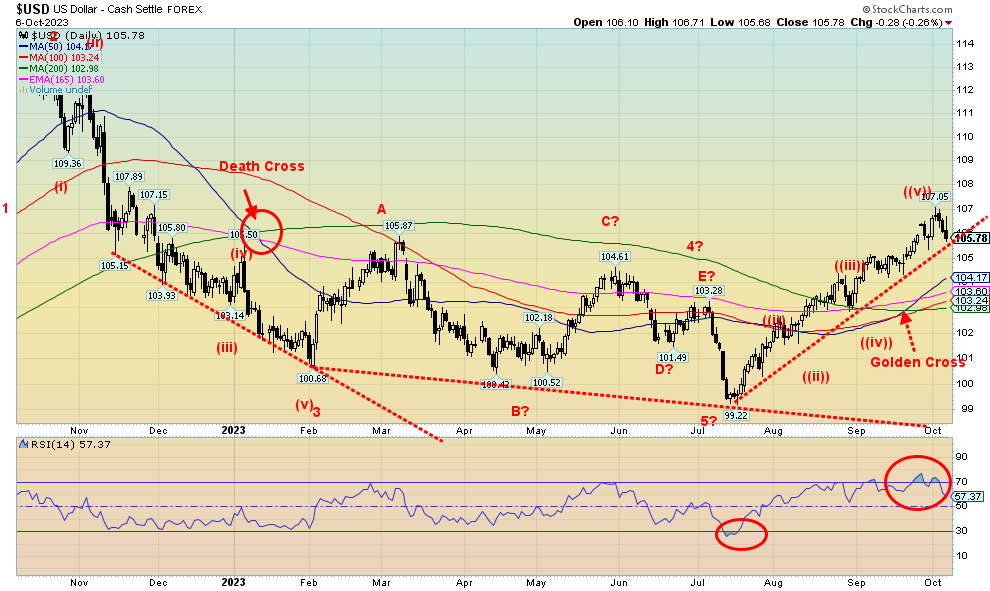
Source: www.stockcharts.com
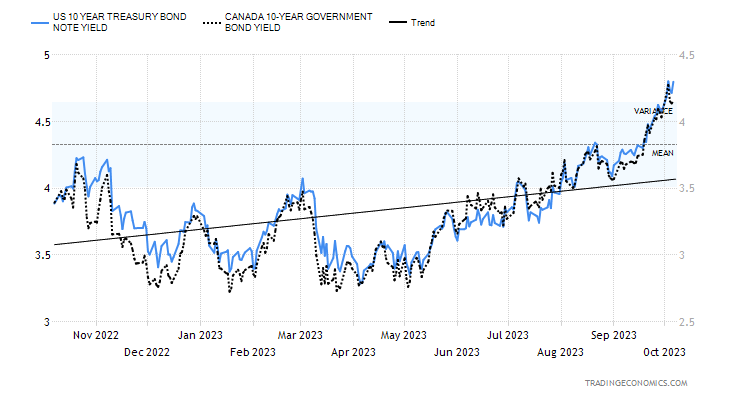
The US$ Index keeps on rising. Or has it topped? This past week the US$ Index made new highs for the move at 107.05, then reversed and fell on the week by about 0.1%. It currently lies at uptrend support. It is also coming off overbought conditions as the RSI had soared over 70 in recent days and even a few weeks. While the US$ Index wobbled, the other currencies were mixed. The euro rose less than 0.2%, the Swiss franc gained 0.6%, the pound sterling was up 0.3%, and even the Japanese yen managed to gain 0.1%. Only the Canadian dollar suffered, down 0.7%. The rise of the US$ Index has been premised largely on interest rate differentials.
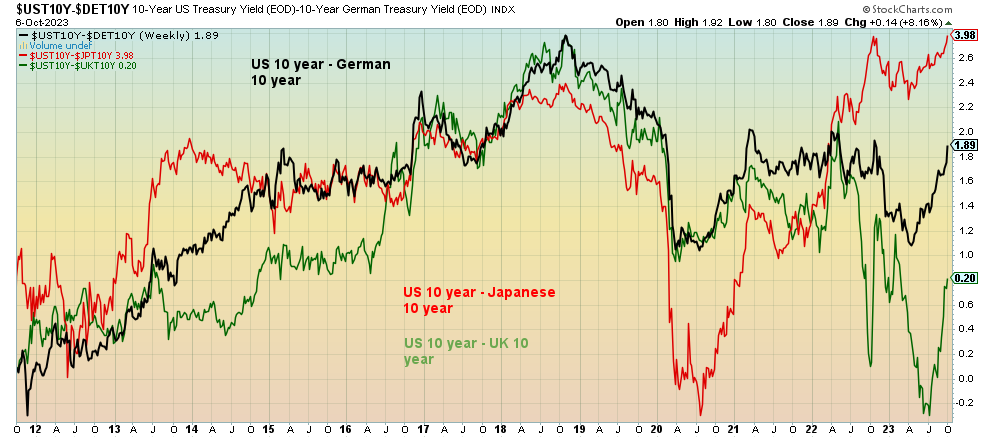
Our chart below is a small example of the interest rate differentials. It uses the 10-year, although the many others, particularly the 3 months, are more than viable to illustrate the point. In the chart the US 10 year is +1.89% higher than Germany, 3.98% higher than Japan, and 0.20% higher than the U.K. That plays with other major countries, including Canada and China. The result is funds flow out of those currencies to purchase U.S. dollars and buy U.S. treasury securities. If the US$ Index started to fall, that inflow might become an outflow.
We re-worked the Elliott wave count to suggest that possibly the US$ Index made its fifth bottom in July. Originally, we labeled the entire move since the early February 2023 low as a large ABCDE-type of triangle and the current up wave as our E wave. Instead, this implies we are embarking on a new uptrend, even as it might be due for a pullback. The ABCDE pattern is still not dead, but the triangle can only be confirmed by a breakdown now to new lows below 99.22. We note the golden cross (50-day over the 200-day MA) seen in September. But remember that the golden cross and its sister, the death cross, come later in the cycle and can be whipsawed.
Source: www.stockcharts.com
This past week’s new high and reversal with a lower closing off of overbought conditions is a sign we may have topped. If it is a just a pullback in a new bull move, we should find support at the meeting of all those MAs between 103 and 104. If we are breaking down, a breakdown under 102 could confirm the top and we’d embark on a new downtrend. We appear to have made five waves up from that 99.22 low, which would be in keeping with either a wave 1 up or an E wave.
Source: www.stockcharts.com
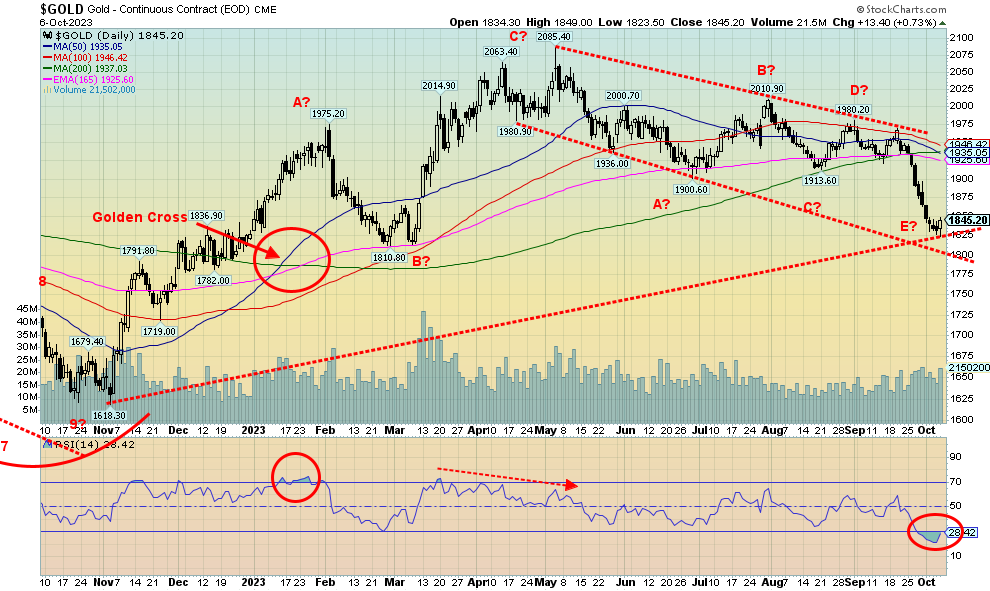
Gold had another miserable week, but the rebound on Friday following the job numbers is encouraging. We are also coming off extreme oversold levels with an RSI well under 30. Still, we are short of our channel line currently near $1,800. We had thought our next target was that level. We could still get there, but only if there is a break under $1,825.
Gold fell sharply for the second consecutive week, this time losing 1.1%. That’s left gold only up 1% in 2023. Silver dropped 3.3% and platinum fell 3.8%. Both silver and platinum are down on the year. Palladium dropped 7.4% and copper prices fell 2.9%. The gold stocks, however, outperformed with the Gold Bugs Index (HUI), down only 0.4% and the TSX Gold Index (TGD) up 0.5%. Are gold stocks leading the way?
Fear of rising interest rates, fear of the Fed hiking rates again, and a rising US$ Index all conspired to help push gold lower this past week. Not even geopolitical problems and the circus in Washington, with the historic ousting of the speaker, moved gold. Nonetheless, gold may be poised for a rebound. However, we wouldn’t be out of the woods completely until we take out $1,950. Just regaining $1,900/$1,925 would be an accomplishment. We appear to have made what appears an ABCDE-type of corrective pattern following that last high at $2,085. As we have noted, we have three good attempts up towards $2,090. Triple tops are extremely rare and more often than not we make new highs. Only a move above $2,100 would confirm that. As well, above $2,100 we believe would confirm our 7.83-year and 23.5-year cycle lows. Will that happen now? Or do we go until December and the December FOMC to find our final low?
We note that both the gold and silver ETFs reversed on Friday on high volume (GLD – SPDR Gold Shares, SLV – iShares Silver Trust). That too is a good sign. But follow-through this coming week is essential. As we note, regaining $1,900 would be the first essential accomplishment. Above $1,875 would also be positive. Sentiment is quite bearish, which is what one would expect given the steep decline (down $260 since the May high).
We are not getting our COT numbers from our usual or old source. We are sourcing COT numbers, but we have to do our own calculations and we have no history. We’re hoping to get our old source back. The gold commercial COT we calculate at 33%, which is up from a recent low at 29%. That’s at least a small positive. We’d prefer it over 40.
With a surprise reversal on Friday after the higher-than-expected U.S. job numbers, fear of higher interest rates and a rising U.S. dollar, it was rewarding to get the reversal. Follow-through is essential for this coming week.
Oddly both the US$ Index and gold might benefit from the outbreak of war in Israel.
Source: www.stockcharts.com
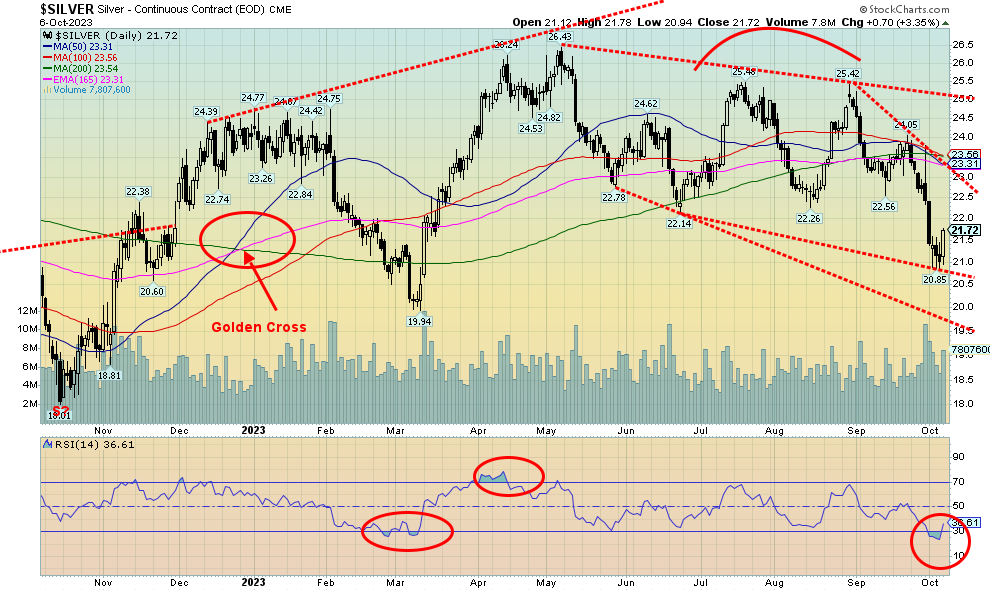
Like gold, silver slid this past week on fears of higher interest rates and a higher US$ Index. Silver fell 3.3%, the second successive weekly decline. Silver also made new lows for the fall, ending the divergence with gold. The good news is that silver rebounded nicely on Friday following the job numbers, up 70 cents or 3.4%. The RSI had fallen well under 30. With the 200-day MA up at $23.54, silver has a bit of climb just to get back to that level. But, as we saw on Friday, that gap could close quickly. Like gold, the selling pressure may be exhausted.
The first point at hand is to take out that June low of $22.14. But we can only start to breathe a sigh of relief once we get above $23.50. A better breakout doesn’t occur until over $25. The last high over $31 was seen way back in February 2021. That seems like a lifetime ago. But the all-time was high was seen in January 1980 and basically equaled on a nominal basis in April 2011. On an inflation-adjusted basis, those highs were even higher. To beat that 1980 high, we’d have to today get over $140. We’d have to get over $66 just to take out that 2011 high. They both seem remote at this time.
By our calculation, the commercial COT is 36%. We’d prefer it well over 40% to get us really bullish. This last wave down has the look of an E wave following an ABCDE-type pattern to the downside from the $26.43 high in May. That last high was at $24.05, so we’ll need to take that out to confirm our low. The bottom of a channel is down near $19.50. New lows below $20.75 could send us towards that level.
Source: www.stockcharts.com
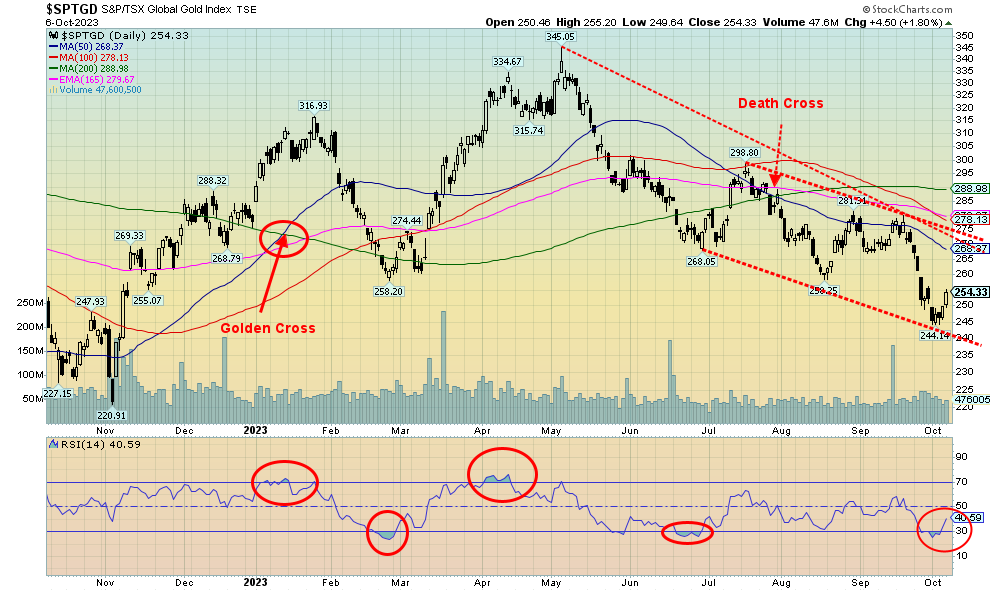
Ideally, we would like to think that the gold stocks have made a bottom. We rebounded this week from a new low for the move down, deep oversold conditions and sinking sentiment. The rebound, despite higher interest rates and a higher US$ Index saw the gold stocks rebound but the final result was mixed. The Gold Bugs Index (HUI) closed down small by 0.4%, but the TSX Gold Index (TGD) closed up 0.5%. We actually saw a few junior exploration miners rebound this past week as well, but the overall junior exploration market remains deeply depressive. We’ve even heard examples of companies now having trouble raising cash. Still, a rebound is overdue with the Gold Miners Bullish Percent Index (BPGDM) still down around 10. Yes, we’ve seen it lower. Zero even, back in 2015. Nonetheless, the TGD and the gold stocks have a way to go to regain our confidence. Ideally, we get above 290 and the MA resistance lines. But just getting back to resistance at 270 would be an accomplishment. The junior mining dominated TSX Venture Exchange (CDNX) also fell this week to its lowest level since 2020 the year of the pandemic. The CDNX has effectively crashed down 52% from its high in February 2021. Some junior stocks are down over 70% from their recent highs. No wonder some are experiencing some problems raising cash. But they are also deeply oversold and sentiment is awful. From these conditions a rally often gets underway. The rebound this week in the gold stocks may turn out to be a positive sign that the pain is over. The TGD is down 26% from the recent May high and down 44% from its all-time high seen way back in 2011. The HUI is even worse, down 67% still from its all-time high in 2011.
Source: www.stockcharts.com
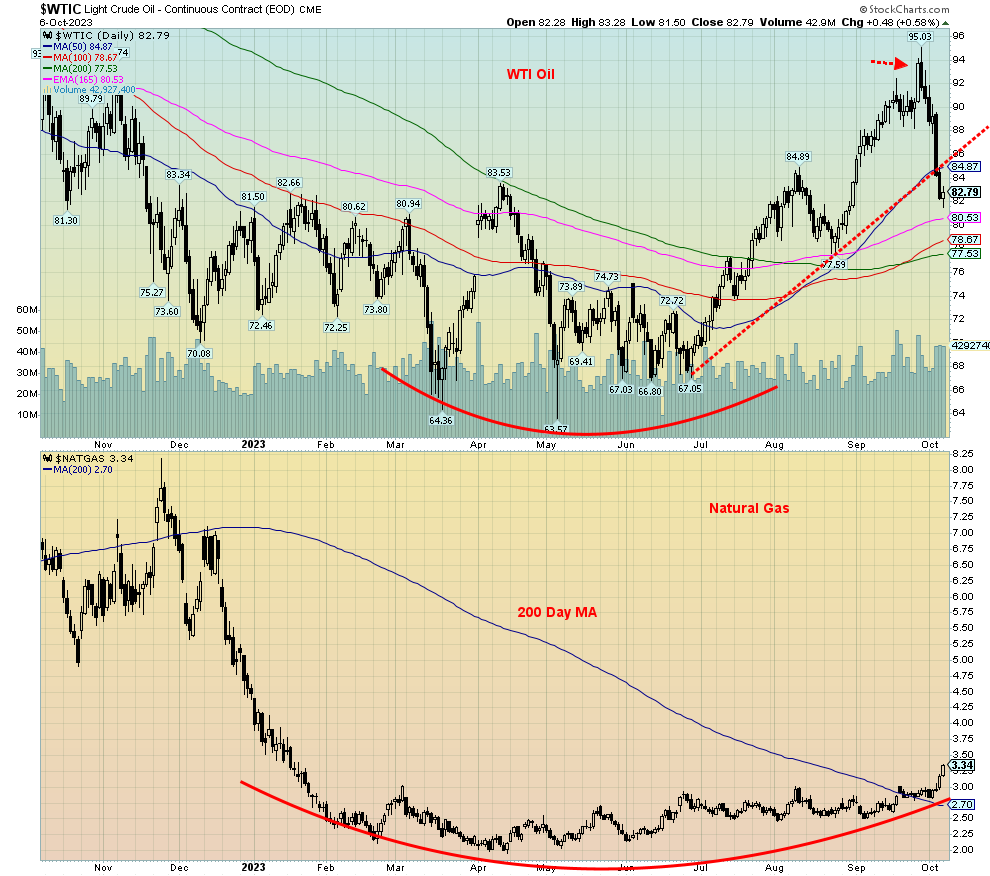
Oil crashed this past week, falling a sharp 8.8% from a high of $95 to Friday’s low at $81.50 before oil prices rebounded and closed higher by $0.48. So why did oil prices effectively crash this past week, down over $12? Sharply rising interest rates raised fear of a recession and falling demand. But Friday’s job numbers tempered that thought and were probably the reason oil rose from negative to positive on the day. The swift crash was also overdone. Brent crude also fell, dropping even more down 9.4%.
Not so natural gas (NG) as Henry Hub NG rose about 14% and finally took out the 200-day MA rising to $3.34, up from $2.93 the previous week. EU Dutch Hub NG actually fell as warm weather gripped the EU and gave thoughts to reduced demand. EU gas fell 8.7%. However, EU gas rebounded on Friday as news of a prolonged strike at an LNG plant in Australia was resuming. The energy stocks followed the both the falling oil prices and the falling stock market lower this past week. The ARCA Oil & Gas Index (XOI) dropped 5.4% while the TSX Energy Index (TEN) was off 4.8%. Both were somewhat overbought. Last week we contemplated a pullback/correction in the energy space.
Obviously, thoughts of $100 oil are on hold. U.S. reserve stocks continue to deteriorate, but gasoline stocks rose on the week. Apparently, there is only 17 days left in the Strategic Reserves. The continued falling U.S. reserves is a concern and also positive for oil prices. Would the drop in prices prompt Russia and Saudi Arabia to cut production further to help bring prices back up? We have no OPEC meetings on the agenda.
Could the drop in oil prices be over? It’s hard to say, but we could still fall further towards $80. However, the swift decline could bring a snapback to correct. The drop has the look of a correction within the context of a bull rise. So, as long as we hold above the August low near $77.60, we could recoup and start rising again. Friday’s reversal day, we suspect, signaled at minimum a correction to the drop. A move above $88 would go a long way to confirm a low.
NG fared better and the rounding bottom may now play itself out. We could make it to at least $4. Only a move back under $2.70 would suggest this run-up is over and the downtrend would renew. We doubt that, as the rounding pattern is too compelling and now we appear to have broken out.
GLOSSARY
Trends
Daily – Short-term trend (For swing traders)
Weekly – Intermediate-term trend (For long-term trend followers)
Monthly – Long-term secular trend (For long-term trend followers)
Up – The trend is up.
Down – The trend is down
Neutral – Indicators are mostly neutral. A trend change might be in the offing.
Weak – The trend is still up or down but it is weakening. It is also a sign that the trend might change.
Topping – Indicators are suggesting that while the trend remains up there are considerable signs that suggest that the market is topping.
Bottoming – Indicators are suggesting that while the trend is down there are considerable signs that suggest that the market is bottoming.
Disclaimer
David Chapman is not a registered advisory service and is not an exempt market dealer (EMD) nor a licensed financial advisor. He does not and cannot give individualised market advice. David Chapman has worked in the financial industry for over 40 years including large financial corporations, banks, and investment dealers. The information in this newsletter is intended only for informational and educational purposes. It should not be construed as an offer, a solicitation of an offer or sale of any security. Every effort is made to provide accurate and complete information. However, we cannot guarantee that there will be no errors. We make no claims, promises or guarantees about the accuracy, completeness, or adequacy of the contents of this commentary and expressly disclaim liability for errors and omissions in the contents of this commentary. David Chapman will always use his best efforts to ensure the accuracy and timeliness of all information. The reader assumes all risk when trading in securities and David Chapman advises consulting a licensed professional financial advisor or portfolio manager such as Enriched Investing Incorporated before proceeding with any trade or idea presented in this newsletter. David Chapman may own shares in companies mentioned in this newsletter. Before making an investment, prospective investors should review each security’s offering documents which summarize the objectives, fees, expenses and associated risks. David Chapman shares his ideas and opinions for informational and educational purposes only and expects the reader to perform due diligence before considering a position in any security. That includes consulting with your own licensed professional financial advisor such as Enriched Investing Incorporated. Performance is not guaranteed, values change frequently, and past performance may not be repeated.
About the author


Website: https://www.enrichedinvesting.com
Disclaimer: David Chapman is not a registered advisory service and is not an exempt market dealer (EMD) nor a licensed financial advisor. We do not and cannot give individualised market advice. David Chapman has worked in the financial industry for over 40 years including large financial corporations, banks, and investment dealers. The information in this newsletter is intended only for informational and educational purposes. It should not be considered a solicitation of an offer or sale of any security. The reader assumes all risk when trading in securities and David Chapman advises consulting a licensed professional financial advisor before proceeding with any trade or idea presented in this newsletter. David Chapman may own shares in companies mentioned in this newsletter. We share our ideas and opinions for informational and educational purposes only and expect the reader to perform due diligence before considering a position in any security. That includes consulting with your own licensed professional financial advisor.