The concept of a peak resource should be familiar to most readers and investors. Peak oil, peak gold and peak copper, all refer to the point when production is no longer growing, year after year. It reaches a peak, then declines.
In a previous article we proved peak gold; in this piece, a deep dive into copper supply depletion, we ultimately reach the same conclusion, ie., that we have reached peak copper.
Depletion
In 2018 we made a bold prediction: that copper supply is NOT going to be able to keep up with demand, in the long-term.
The bull case for copper, and copper prices, has been well-covered by analysts, journalists and mining company CEOs, on the demand side. We all know about the EV revolution, how copper is essential to electrification, renewable energy, electricity transmission, plumbing and wiring. Copper use is so widespread, it is a leading indicator of global economic activity. The red metal isn’t called “Dr. Copper” for nothing.
Supply concerns, or more specifically, the projected short fall of copper, viz a viz demand, has been less written about, mostly because the issue is complicated and not well understood.
Clarity starts by understanding there are two ways for the mining industry to increase copper reserves: it can either find large new deposits to develop into mines; or copper companies can lower their cut-off grades and add new reserves that way.
We get that exploration isn’t easy, especially given that most of the world’s big, high-grade deposits have already been found. But why can’t the large copper miners simply tap into their existing reserves to meet growing demand?
The truth is, they have been. Instead of sending exploration teams around the world turning over rocks to find the next gigantic copper deposit, the main way copper companies have added reserves is by lowering their cut-off grades.
The way this is done is fairly simple. A mine plan is based on the “cut-off grade”, which is the minimum grade needed to make a unit of rock economic to extract at a given price. Any ore below this grade stays in the ground. When metal prices rise, the mining company makes more per tonne, so it is able to “lower the cut-off grade” and still make a profit. It’s essentially turning what was previously waste rock at old pricing into mineable ore at the new prices.
In a recent report, Goehring & Rozencwajg Associates found, after studying the various sources of the copper industry’s reserve additions, that very few new discoveries had been made. In fact, between 2001 and 2014, 80% of new reserves came from re-classifying waste rock into mineable ore, ie., lowering the cut-off grade.
Drawing from a database of 115 mines responsible for four-fifths of total output, the Wall Street natural resource investment house discovered the grade of new reserves each year has steadily declined, as a result of this practice.
In 2001, the new reserves grade was 0.80% copper but by 2012, it had fallen to 0.26%. The copper industry was still able to replace all the ore used in production with new reserves, but the quality of those reserves, ie., the grade, had dropped by nearly two-thirds.
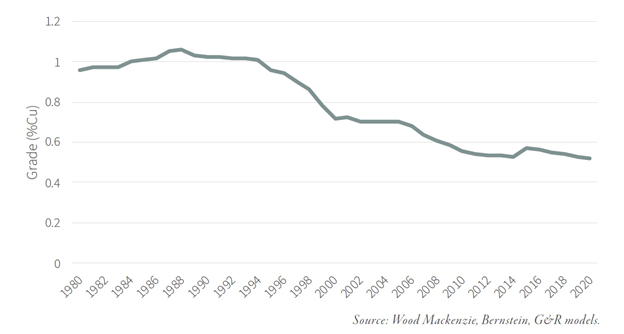 Average grade of copper remaining reserve
(Before 2005 reserves depletion wasn’t even an issue. Starting in the 1980s, a lot of new copper mines came online, making the average reserve grade AND the cut-off grade trend upwards. By the 1990s, however, the introduction of new large-scale copper mines slowed dramatically while depletion in the existing, aging mine base began to accelerate. In 2005, Goehring & Rozencwajg predicted, presciently as it turns out, that mine supply would be “insufficient to close the structural gap between supply and demand [and that] copper prices must remain high.”)
Chile’s Escondida, the world’s largest copper mine, provides a good example of how lowering the cut-off grade has diminished the quantity and quality of its reserves.
Between 2005 and 2012, the mine’s reserves grew from 32 million tonnes contained copper to over 54Mt, well exceeding the 8Mt of copper produced. No exploration successes occurred during this period; instead, nearly 100% of reserve additions were due to higher copper prices allowing the operators to lower the cut-off grade. An estimated cut-off in 2005 of 0.45%, by 2012 had fallen to 0.27%.
The practice was reflected in the reserve grade, which fell from 1% in 2005 to 0.6% seven year later. According to the Goehring & Rozencwajg report, After peaking at 9.1 bn tonnes in 2012, Escondida’s reserves have fallen to 8.8 bn tonnes and reserve grades continued to fall. By 2021 reserves had fallen another 5% — from 0.60% to 0.57%. Contained copper in these ore reserves, which stood at 54 million tonnes in 2012, had fallen to 51Mt. Between 2012 and 2020, Escondida was unable to replace all of its production with new reserves.
Between 2005 and 2012, Escondida added almost 30Mt tonnes of copper and replaced 275% of the reserves it produced — almost all by aggressively lowering the mine’s cut-off grade. Between 2012 and 2020, falling copper prices prevented Escondida’s operators from lowering cut-off grades and reserve additions plummeted to only 4Mt. The reserve replacement ratio had fallen from 275% to only 50%.
 Reserve changes per year, in million tonnes
This brings up a crucial point: there is only so far a miner can go in lowering the cut-off grade. At a certain point, it doesn’t matter how much the price rises, lowering the cut-off involves too many costs; mining then becomes un-economic.
Examples of such costs might be, the grades are simply too low, even at a higher price; the metallurgy becomes more difficult at a lower grade; trying to convert waste rock to reserves means going to a far-flung jurisdiction where there all kinds of added costs, like paying off a foreign government, or high royalties.
Goehring & Rozencwajg use the example of copper porphyries, from which 80% of the world’s copper is mined, to demonstrate this concept of diminishing returns.
For a given porphyry, the grade-tonnage curve is typically “log-normal” meaning there is a steep hump at the left side and a long, shallow “tail” at the right.
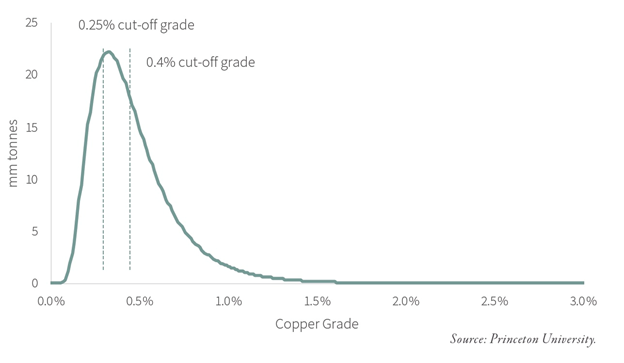 Porphyry copper-grade tonnage curve
In the graph above, assume a hypothetical deposit of 1 billion tonnes grading 0.5% copper. Until the mid-2000s, a typical copper grade was 0.4%, meaning everything to the left of the dashed line was considered waste rock. By 2014, the cut-off grade is reduced to 0.25%. According to the report, such a reduction in overall reserve grade implies over 30% more material (and hence capital) is required to produce the same amount of contained metal. Therefore,
Lowering the cut-off grade clearly cannot go on indefinitely; unlike interest rates there is a firm low at zero. More important, the log-normal shape of the grade-tonnage plot means that most of the reserves have likely already been added…
For example, taking the cut-off grade down by 0.15% from 0.4% to 0.25% added an incremental 1.1 mm tonnes of new copper reserve. Taking the cut-off grade down another 0.15% from 0.25% to 0.1% would only add another 300,000 tonnes of contained copper — 70% less than going from 0.4% to 0.25%. At that point, reducing the cut-off grade to zero would only add an incremental 2,000 tonnes of contained copper reserve.
Because the grade-tonnage plot is not symmetric, once you hit a certain cut-off (typically near the mean resource grade), it is no longer possible to add large amounts of reserves. Given the average resource grade of a modern porphyry is likely in the 0.3–0.4% range, the industry is probably already past the point of adding reserves by lowering the cut-off grades.
The authors contend that even with prices above $10,000 per tonne, reserves cannot keep growing, specifically at porphyry deposits. Their analysis also suggests that “we are quickly approaching the lower limits of cut-off grades,” concluding that
“If this is correct, then we are rapidly approaching the point where reserves cannot be grown at all.” In other words, peak copper. Remember, the definition of peak copper (or peak anything) is when production stops growing. If reserves aren’t increasing, there will eventually be nothing left to mine. Production will have to reach a peak, then decline.
This in itself is a shocking revelation. It suggests the copper mining industry has gone as far as it can in lowering cut-off grades further, meaning it is no longer possible to add large amounts of reserves — especially given that porphyry deposits are typically low-grade, in the 0.3 to 0.4% Cu range. The industry, the report alludes to, is nearing its production peak:
Our models strongly suggest copper mine supply growth will grind to a halt this decade. The number of new world-class discoveries coming online will decline substantially and depletion problems at existing mines will accelerate. Also, geological constraints surrounding copper porphyry deposits, which is where we get 80% of our copper, a subject few analysts and investors understand, will contribute to the problems.
Greenfield and brownfield reserve additions are expected to disappoint through the decade, according to the report. S&P Global Market Intelligence estimates that new discoveries averaged nearly 50Mt annually between 1990 and 2010. Since then, new discoveries have fallen by 80% to only 8Mt per year.
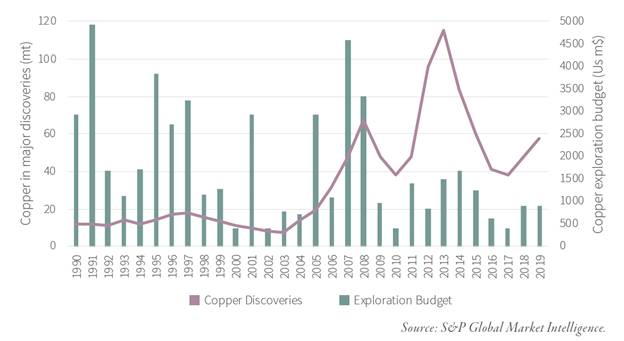 Copper discoveries and capital expenditures
Goehring & Rozencwajg therefore forecast that stagnating copper mine supply, already colliding with strong demand, will push copper prices far higher than anyone expects.
“The previous copper bull market took place between 2001 and 2011 and saw prices rise seven-fold: from $0.60 to $4.62 per pound. The fundamentals today are even more bullish,” the firm states, adding:
“We would not be surprised to see copper prices again advance a minimum of seven-fold before this bull market is over. Using $1.95 as our starting point, we expect copper prices to potentially peak near $15 per pound by the latter part of this decade.”
Spot copper has already nearly doubled over the past year.
The main factors driving prices higher are increased Chinese orders amid a strong manufacturing sector; expectations of a return to growth following a disastrous 2020; trillions in promised green and blacktop infrastructure spending particularly in the US, Europe, and China; and supply disruptions resulting from virus-related mine closures.
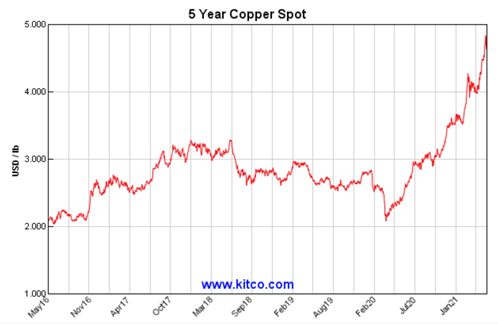 Source: Kitco
Cost inflation
Operational problems aside, there are other hurdles copper companies are having to climb, when it comes to increasing production and reserves to match the surge in demand coming from electrification and decarbonization.
Three that immediately come to mind are: supply shortages in business inputs leading to higher prices; “black swan” events that have caused supply disruptions; and resource nationalism in some of the most important copper-producing nations.
The pandemic has put tremendous pressure on supply chains, which in some cases, pose a threat to mining companies’ costs per tonne or ounce. For example the cost of diesel fuel has risen 22% year to date, to US$3.24 per gallon, the highest in three years.
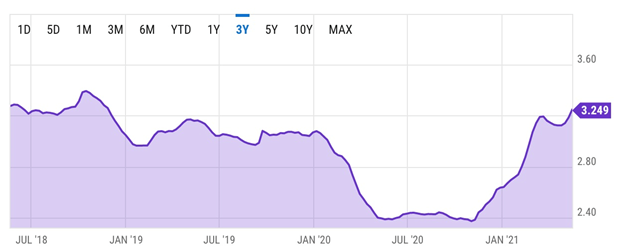 US retail diesel price. Source: YCharts
Another one is transportation. As more Americans get vaccinated and businesses/ individuals ramp up their spending, imports from China are soaring, throwing the US balance of trade further into deficit. Container vessels are running at capacity, pushing ocean freight rates to record highs and causing backlogs at West Coast ports. Executives at Maersk, the world’s largest container shipping line, reportedly see only a gradual decline in freight rates for the rest of the year.
This month the Baltic Dry Index, a bellwether of shipping activity, hit an 11-month high, while the Cass Freight Index which measures shipping expenditures, reached a fourth monthly record in April.
Experts say the difference between the current supply crunch and previous ones, is “the sheer magnitude of it,” Bloomberg states, and the fact that there is — as far as anyone can tell — no clear end in sight. Big or small, few businesses are spared.
Supply chain disruptions, many covid-related, have also been exacerbated by several out-of-the-blue events, including the container ship that went aground in the Suez Canal and was estimated to cost $400 million per hour in delayed goods; a February deep freeze and mass blackout that wiped out energy/ petrochemical operations in the central United States; and a hacked fuel pipeline that drove gasoline prices above $3 a gallon for the first time since 2014.
“Essentially what people are telling us to expect is that it’s going to be hard to get supply up to a place where it matches demand, and because of that, we’re going to continue to see some price increases over the next 12 months,” Bloomberg quoted a business professor who helps compile the Logistics’ Managers Index — a gauge built on a monthly survey of inventory, transportation and warehouse expenses — the three key components of managing supply chains.
In a previous article we showed that the current environment of monetary stimulus, designed to boost borrowing and spending, and fiscal stimulus, in the form of trillions in government spending, combined with supply chain disruptions, has created the perfect conditions for inflation.
The Wall Street Journal reported last week that the US consumer price index (CPI) surged in April by 4.2%, the most in any 12-month period since 2008, as economic activity picked up but was constrained in some sectors by supply bottlenecks.
Resource nationalism
It isn’t only cost-push inflation that is making it tough for copper producers, already stretched to the limit with supply not able to keep up with demand, amid peak copper.
Governments are getting in the way of miners’ progress by implementing anti-mining agendas and/or thinking up new ways to hit the extractive industry with higher taxes.
Some have gone beyond taxation in getting more out of the mining sector with a wave of requirements such as mandated beneficiation (where ore is processed locally rather than exported raw), export restrictions (eg. Indonesia) and increased state ownership of mines (eg. Mongolia).
We’ve seen many instances of companies losing assets that were lawfully theirs. Several countries come to mind as places where shareholders could, without warning, receive news that operations have been taken over by the government or its friends, or where permits get delayed or canceled outright.
A recent study pointed to 34 countries that have seen a significant increase in resource nationalism risk over the past year. Countries now rated “extreme risk”, according to the March 2021 report by Verisk Maplecroft, include major African copper producers Zambia and the DRC.
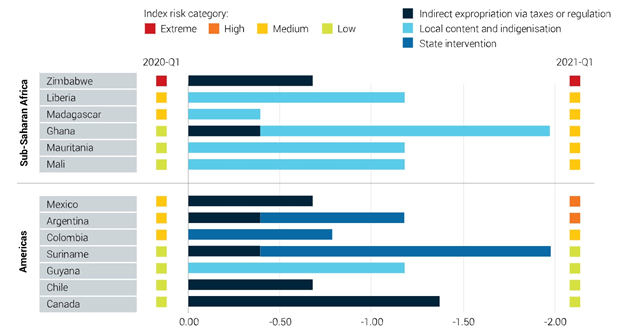 Countries that recorded the greatest increase in resource nationalism, Q1 2021 vs Q1 2020. Source: Verisk Maplecroft
Zambia made it into Maplecroft’s top riskiest places to mine in due to an attempted liquidation of Konkola Copper Mines, whereas in the Democratic Republic of Congo, the Congolese government in 2018 raised taxes on mining firms and increased royalties. The country is Africa’s biggest producer of copper and cobalt. Another threat to copper supply is happening in eastern Congo where in April President Felix Tshisedeki declared a state of siege over escalating violence in the minerals-rich provinces of Ituri and North Kivu.

Port workers in Chile, the world’s top copper producer, in April launched a national strike against the government’s pandemic relief policies, thereby threatening shipments. Last Friday 97% of workers in the union at BHP’s Escondida and Spence mines voted to reject the company’s contract offer, raising the risk of a strike at the two huge mines.
Also in Chile, the lower house this month approved a bill that would tax mining companies at a higher rate when the copper price increases. If passed by the Senate, miners would pay between 15% and 75%. The industry warns the new law, designed to collect more money for social programs, would stifle investment and make Chile less competitive.
The original text had a 3% flat tax on copper.
The Chilean government is being pressured by groups within its society to do more to address inequality. Triggered by the worst social unrest in a generation, the country reportedly has just elected an assembly that will place responsibility for writing a new constitution in the hands of the left wing.
The reforms could give more power to indigenous communities and expand water rights, including a potential ban on mining in areas where there are glaciers, along with increased state ownership of water desalinated by mining companies.
In neighboring Peru, a well-known socialist who wants to redistribute mineral wealth is leading the polls in the upcoming June election. Pedro Castillo has reportedly pledged to keep 70% of mining profits in the country and stop foreign firms’ “plundering”, and has warned he could nationalize some resources.
The number two copper producer has some $56 billion in mining investments.
Community opposition has already paralyzed large mining development projects including Southern Copper’s Tia Maria and the $5 billion Conga project put forward by Newmont Mining and Peruvian firm Buenaventura.
A recent story on rising political risks states that 42% of global copper production is under political uncertainty right now, that could affect future production.
The news outlet quotes Diego Macera, director of the Peruvian Institute of Economics, saying that redistribution of mineral wealth was an obvious way to raise public funds for the post-pandemic recovery, though a fragmented congress would likely limit the power of whoever becomes president.
But, he added, the uncertainty could put off investors, fearful the state will seize assets.
“Nobody likes to put in $1-1.5 billion of investment when the head of state might nationalize it,” he said.
Bob Moriarty, the outspoken publisher of 321gold.com, had this to say about the rising tide of resource nationalism:
[W]hen countries such as Chile and the Dominican Republic and Peru see the price of commodities going higher, rather than celebrating their good fortune, they begin to demand more and more of the pie. In Chile, the world’s largest copper producing country, a bill is in front of their congress to expand the royalty on copper to 75% in 2024 if copper is higher than $4.50 a pound. Since copper has been as high as $4.82 in the last week, the bill has an excellent chance of passing. It also will make Chile one of the worst countries in the world for a junior to do business.
Resource Nationalism has been an issue in the past, no one wants to explore in Nigeria or Zimbabwe or Afghanistan but it is going far wider and casting a net over major mining jurisdictions at present. And I am content to predict it will only get worse.
Conclusion
The demand pressure about to be exerted on copper producers in the coming years all but guarantees a market imbalance, resulting in copper becoming scarcer, and dearer, with each ambitious green initiative rolled out by governments, whose backs are against the wall due to negative fall-out from global warming.
The problem is existing copper mines are running out of ore, and the capital being invested in new mines is far below the level needed.
According to research by S&P Global Market Intelligence, of 224 sizable copper deposits discovered in the past 30 years, only 16 have been found in the last decade.
It takes seven to 10 years, at minimum, to move a copper mine from discovery to production. In regulation-happy jurisdictions like Canada and the US, the time frame is more like 20 years.
The pipeline of copper development projects is the lowest it’s been in decades.
Why can’t we just mine more copper? Over the past two decades, the big mining companies have approached the problem of dwindling reserves by doing exactly that.
Between 2001 and 2014, 80% of new reserves came from re-classifying waste rock into mineable ore, ie., lowering the cut-off grade.
The problem is that between lowering their cut-off grades and high-grading (removing all the best ore and leaving the rest) the grade of new reserves each year has steadily declined.
In 2001, the new reserves grade was 0.80% copper but by 2012, it had fallen to 0.26%. The copper industry was still able to replace all the ore used in production with new reserves, but the quality of those reserves, ie., the grade, had dropped by nearly two-thirds.
The evidence suggests the industry cannot simply mine itself out of the problem.
The authors of a recent report contend that even with prices above $10,000 per tonne, reserves cannot keep growing, specifically at porphyry deposits, where most copper is mined.
Their analysis also suggests that we are quickly approaching the lower limits of cut-off grades, concluding that we are rapidly approaching the point where reserves cannot be grown at all. In other words, peak copper.
In sum, the copper industry is in the grips of a structural supply deficit that, combined with inflationary cost pressures and a creeping resource nationalism in some of the world’s largest copper producers, is only expected to get worse.
Cut-off grades have already been lowered as far as they can go. This method can no longer relied upon to increase reserves, leaving only one alternative: exploration.
For the mining industry to avoid becoming the traffic jam on a super-highway leading to the future electrified/ decarbonized economy, a lot more copper needs to be found.
Richard (Rick) Mills
aheadoftheherd.com
Legal Notice / Disclaimer
Ahead of the Herd newsletter, aheadoftheherd.com, hereafter known as AOTH.
Please read the entire Disclaimer carefully before you use this website or read the newsletter. If you do not agree to all the AOTH/Richard Mills Disclaimer, do not access/read this website/newsletter/article, or any of its pages. By reading/using this AOTH/Richard Mills website/newsletter/article, and whether you actually read this Disclaimer, you are deemed to have accepted it.
Any AOTH/Richard Mills document is not, and should not be, construed as an offer to sell or the solicitation of an offer to purchase or subscribe for any investment.
AOTH/Richard Mills has based this document on information obtained from sources he believes to be reliable, but which has not been independently verified.
AOTH/Richard Mills makes no guarantee, representation or warranty and accepts no responsibility or liability as to its accuracy or completeness.
Expressions of opinion are those of AOTH/Richard Mills only and are subject to change without notice.
AOTH/Richard Mills assumes no warranty, liability or guarantee for the current relevance, correctness or completeness of any information provided within this Report and will not be held liable for the consequence of reliance upon any opinion or statement contained herein or any omission.
Furthermore, AOTH/Richard Mills assumes no liability for any direct or indirect loss or damage for lost profit, which you may incur as a result of the use and existence of the information provided within this AOTH/Richard Mills Report.
You agree that by reading AOTH/Richard Mills articles, you are acting at your OWN RISK. In no event should AOTH/Richard Mills liable for any direct or indirect trading losses caused by any information contained in AOTH/Richard Mills articles. Information in AOTH/Richard Mills articles is not an offer to sell or a solicitation of an offer to buy any security. AOTH/Richard Mills is not suggesting the transacting of any financial instruments.
Our publications are not a recommendation to buy or sell a security – no information posted on this site is to be considered investment advice or a recommendation to do anything involving finance or money aside from performing your own due diligence and consulting with your personal registered broker/financial advisor.
AOTH/Richard Mills recommends that before investing in any securities, you consult with a professional financial planner or advisor, and that you should conduct a complete and independent investigation before investing in any security after prudent consideration of all pertinent risks. Ahead of the Herd is not a registered broker, dealer, analyst, or advisor. We hold no investment licenses and may not sell, offer to sell, or offer to buy any security.


